Tài liệu Báo cáo khoa học: "Japanese OCR Error Correction using Character Shape Similarity and Statistical Language Model " pptx
Bạn đang xem bản rút gọn của tài liệu. Xem và tải ngay bản đầy đủ của tài liệu tại đây (668.43 KB, 7 trang )
Japanese OCR Error Correction using Character Shape
Similarity and Statistical Language Model
Masaaki NAGATA
NTT Information and Communication Systems Laboratories
1-1 Hikari-no-oka Yokosuka-Shi Kanagawa, 239-0847 Japan
nagata@nttnly, isl. ntt. co. jp
Abstract
We present a novel OCR error correction method
for languages without word delimiters that have a
large character set, such as Japanese and Chinese.
It consists of a statistical OCR model, an approxi-
mate word matching method using character shape
similarity, and a word segmentation algorithm us-
ing a statistical language model. By using a sta-
tistical OCR model and character shape similarity,
the proposed error corrector outperforms the previ-
ously published method. When the baseline char-
acter recognition accuracy is 90%, it achieves 97.4%
character recognition accuracy.
1 Introduction
As our society is becoming more computerized, peo-
ple are getting enthusiastic about entering every-
thing into computers. So the need for OCR in areas
such as office automation and information retrieval
is becoming larger, contrary to our expectation.
In Japanese, although the accuracy of printed
character OCR is about 98%, sources such as old
books, poor quality photocopies, and faxes are still
difficult to process and cause many errors. The accu-
racy of handwritten OCR is still about 90% (Hilde-
brandt and Liu, 1993), and it worsens dramatically
when the input quality is poor. If NLP techniques
could be used to boost the accuracy of handwriting
and poor quality documents, we could enjoy a very
large market for OCR related applications.
OCR error correction can be thought of a spelling
correction problem. Although spelling correction
has been studied for several decades (Kukich, 1992),
the traditional techniques are implicitly based on
English and cannot be used for Asian languages such
as Japanese and Chinese.
The traditional strategy for English spelling cor-
rection is called isolated word error correction: Word
boundaries are placed by white spaces. If the tok-
enized string is not in the dictionary, it is a non-
word. For a non-word, correction candidates are re-
trieved from the dictionary by approximate string
match techniques using context-independent word
distance measures such as edit distance (Wagner and
Fischer, 1974) and ngram distance (Angell et al.,
1983).
Recently, statistical language models and feature-
based method have been used for context-sensitive
spelling correction, where errors are corrected con-
sidering the context in which the error occurs
(Church and Gale, 1991; Mays et al., 1991; Golding
and Schabes, 1996). Similar techniques are used for
correcting the output of English OCRs (Tong and
Evans, 1996) and English speech recognizers (Ring-
ger and Allen, 1996).
There are two problems in Japanese (and Chinese)
spelling correction. The first is the word boundary
problem. It is impossible to use isolated word error
correction techniques because there are no delimiters
between words. The second is the short word prob-
lem. Word distance measures are useless because the
average word length is short (< 2), and the charac-
ter set is large (> 3000). There are a much larger
number of one edit distance neighbors for a word,
compared with English.
Recently, the first problem was solved by selecting
the most likely word sequence from all combinations
of exactly and approximately matched words using a
Viterbi-like word segmentation algorithm and a sta-
tistical language model considering unknown words
and non-words (Nagata, 1996). However, the second
problem is not solved yet, at least elegantly. The so-
lution presented in (Nagata, 1996) which sorts a list
of one edit distance words considering the context
in which it will be placed is inaccurate because the
context itself might include some errors.
In this paper, we present a context-independent
approximate word match method using character
shape similarity. This is suitable for languages with
large character sets, such as Japanese and Chinese.
We also present a method to build a statistical OCR
model by smoothing the character confusion proba-
bility using character shape similarity.
It seems previous NLP researchers are reluctant
922
to use resources such as the character confusion ma-
trix and feature vectors of the characters, and try to
solve the problem by using only linguistic devices.
We found that, by using character shape similarity,
the resulting OCR error corrector is robust and ac-
curate enough to correct unrestricted texts with a
wide range of recognition accuracies.
2 OCR Model
2.1 Noisy Channel
Model
First, we formulate the spelling correction of OCR
errors in the noisy channel paradigm. Let C rep-
resent the input string and X represent the OCR
output string. Finding the most probable string C"
given the OCR output X amounts to maximizing
the function
P(XIC)P(C),
= arg m~x
P(C[X)
= arg mcax
P(X[C)P(C)
(1)
because Bayes' rule states that,
P(C[X)- P(X[C)P(C)
P(X)
(2)
P(C)
is called the language model. It is computed
from the training corpus. Let us call
P(XIC )
the
OCR model. It can be computed from the a priori
likelihood estimates for individual characters,
n
P(XIC) = II P(xilci)
(3)
i=1
where n is the string length.
P(xi[ci)
is called the
characters confusion probability.
2.2 Zero-Frequency Problem
The character confusion probabilities are computed
from the character confusion matrix, which is a set of
the frequencies of the input-output character pairs of
the OCR. The confusion matrix, however, is highly
dependent on the character recognition method and
the quality of the input image. It is a labor intensive
task to make a confusion matrix, since Japanese has
more than 3,000 characters. But the more serious
problem is that the confusion matrix is too sparse
to be used for statistical modeling.
For example, suppose the word "ItI~31E" (environ-
ment) is incorrectly recognized as a non-word "~
~". The following is an excerpt of a confusion ma-
trix, where the pair of a character and a number
separated by a slash represents the output character
and its frequency.
input character ~:
~/1289 ~/1 {~/1
input character ~:
~/1282 ~/5 ~/1 ~/1 ~/I ~/1 ~/i
Even if we collect more than one thousand recog-
nition examples, there are no examples in which qll'
is recognized as '~'. To compute the confusion prob-
ability P(~[!II), we need a smoothing method.
This is called the zero-frequency problem. Al-
though it has been studied in many areas such
as speech recognition, statistical language modeling
and text compression, no previous work has exam-
ined on the smoothing of the character confusion
probabilities. This is probably because the problem
arises only when we consider OCR error correction
of languages with large character sets.
We propose a novel method to smooth the char-
acter confusion probabilities. First, we estimate the
sum of the probabilities of novel events. We then
distribute the probability mass to each novel event
based on character similarity.
We use a scheme, which we refer to as the Witten-
Bell method (Witten and Bell, 1991), to estimate the
sum of the probabilities for all novel events because
it is simple and robust 1. Let
C(ci,cj)
be the fre-
quency of events where
ci
and cj are the input and
the output characters, respectively. Let
~(ci)
be the
sum of the probabilities of unseen output charac-
ters where the input character is ci. By using the
Witten-Bell method,
~(ci)
is estimated as,
B(ci) = ~_, P(cijci)
c a :C(ci ,c1 )=0
= Ej o(c(c.cj))
(4)
C(c.c ) + o(c(c.cj))
where
1 ifx>O
O(x) = 0 otherwise (5)
In the above example, '~' appears 1291(= 1289+1+
1) times as input and there are three distinct char-
acters in the output. Therefore, the probability of
observing novel characters is 3/(1291 + 3) = 3/1294.
One of the possible alternatives to the Witten-Bell
method is the Good-Turing method (Good, 1953).
But we didn't use the method since it assumes the
distribution of the frequency of frequencies to be rel-
atively smooth, which is not the case in the character
confusion matrix.
2.3 Back-off Smoothing
Both the Witten-Bell and Good-Turing methods do
not in themselves tell one how to share/~(ci) among
1In (Witten and Bell, 1991), the method is referred to as
"method C" for estimating the escape probability in a text
compression method, Prediction by Partial Matching (PPM).
It estimates the probability of observing novel events to be
r/(n + r), where n is the total number of events seen previ-
ously, and r is the number of symbols that are distinct. The
probability of the event observed c times is c/(n + r).
923
the distinct unseen events. The simplest strategy
is to assume all unseen events are equally probable,
but this is not reasonable because recognition errors
are more likely to occur among characters with simi-
lar shapes. Therefore, we distributed the probability
mass D(c~) based on character shape similarity com-
puted from feature vectors.
First, we made an appropriate number of charac-
ter classes in which similar characters are gathered.
This is done by clustering the feature vectors of each
character; details are described in the next subsec-
tion. We then made a confusion matrix between the
character classes from the character confusion ma-
trix. Let
C(class~, classj)
be the frequency that the
characters in
classl
are recognized as the characters
in
classj.
It is computed as the sum of the elements
in the character confusion matrix associated with
the characters in
class~
and
classj.
C(classl,class.,) = ~_, C(ci, cj)
(6)
ci Eclass l ,cj C=class j
By using the Witten-Bell method, we can esti-
mate the class confusion probabilities between arbi-
trary classes. We then distribute the probability for
unseen events in proportion to the class confusion
probability,
P(cj[c~) = a(ci)P(class(cj)[class(c~))
(7)
where
Z(c~)
~(c~) = E~,:c(~,,~=0 P(d~(cDId~s(~)) (8)
is a normalizing constant, and
class(c{)
is the func-
tion that returns the class of character c~.
Numerical values for a's as well as the charac-
ter class confusion probabilities can be precomputed.
Therefore, the method is computationally efficient.
2.4 Character Clustering
In general, character recognition consists of feature
extraction and classification. Feature extraction is
applied to concentrate the information in the im-
age into a few, highly selective features. Classifica-
tion is accomplished by comparing the feature vec-
tor corresponding to the input character with the
representatives of each character, using a distance
metric. Therefore, if we cluster feature vectors of
each character, the members of the resulting class
are characters with similar shape, and so tend to
cause confusion.
The feature we used in the clustering experi-
ment is PDC (Peripheral Direction Contributivity)
(Hagita et al., 1983), which is one of the best features
for Japanese character recognition 2. We clustered
the feature vectors for 3021 Japanese characters into
128 classes by using the LBG algorithm (Linde et
al., 1980), which is one of the most popular vector
quantization methods.
Let's go back to the previous example of estimat-
ing P(~I~)- After character clustering, '~' and '~'
are clustered into class 29 and 119, respectively.
class
class
29 (including ~) :
119 (including ~) :
Here is the excerpt of the class confusion matrix for
class 29.
input class 29:
29/30884 87/23 33121 59/20 15/9 119/7 94/6
78/6 28/5 2/4 109/4 101/4 71/4 104/3 107/3
21/3 58/3 70/2 113/2 56/2 0/2 34/2 38/2 26/2
1812 4411 7211
5011
3011 10211 1911 8911
110/1 4/1 122/1 123/1
Since class 29 appears 31036(30884 + 23 + )
times as input and there are 36 distinct classes
in the output, where class 119 appeared 7 times,
P(classnglclass29) =
7/(31036 + 36) = 7/31072.
This class confusion probability and the normalizing
constant ~(~) are used to compute P(~I~) using
equation (7).
3 Language Model
3.1 Word Segmentation Model
Let the input Japanese character sequence be C =
clc2 cm,
which can be segmented into word se-
quence
W = wlw2 w,.
We approximate
P(C)
in Equation (1) by the joint probability of word se-
quence
P(W). P(W)
is then approximated by the
product of word bigram probabilities
P(w~lwi_l).
n
P(C) ,~, P(W) = H P(w'lw'-l)
(9)
i 1
2PDC features are formed by assigning stroke directions
to pixels and selecting just pixels on the first, second, and
third stroke encountered by the scan line. The marginal dis-
tribution of the four direction contributivity of such three pix-
els is then taken along 16 lines in eight different directions.
Therefore, the dimension of the original PDC feature vector is
8"3"4"16 1536. By using 2-stage feature selection, it can be
reduced to 256, while still preserving the original recognition
ability.
924
Using the language model (9), the OCR error cor-
rection task can be defined as finding a word se-
quence r~d that maximizes the joint probability of
word sequence given recognized character sequence
P(WIX ).
By using Bayes' rule, this amounts to
maximizing the product of
P(XIW )
and
P(W).
= arg mwax
P(W[X) = arg mwax P(X[W)P(W)
(10)
The maximization search can be efficiently imple-
mented by using the Viterbi-like dynamic program-
ing procedure described in (Nagata, 1996). The
algorithm starts from the beginning of the input
sentence, and proceeds character by character. At
each point in the sentence, it looks up the combina-
tion of the best partial word segmentation hypoth-
esis ending there and all word hypotheses starting
there. The word hypotheses proposed at each point
include both exactly matched words and approxi-
mately matched words. All prefixes of the substring
starting at the point are also proposed as unknown
words if they are not in the dictionary.
3.2 Word Model for Unknown Words
We defined a statistical word model to assign a rea-
sonable word probability to an arbitrary substring
in the input sentence. The word model is formally
defined as the joint probability of the character se-
quence
wi = cl ck
if it is an unknown word. We
decompose it into the product of word length prob-
ability and word spelling probability,
P(wil<tlNg>)
=
P(Cl ck
[<IJNI~>) =
P(k)P(cl ck
Ik) (11)
where k is the length of the character sequence and
<UNK> represents unknown word.
We assume that word length probability
P(k)
obeys a Poisson distribution whose parameter is the
average word length A in the training corpus. This
means that we regard word length as the interval
between hidden word boundary markers, which are
randomly placed with an average interval equal to
the average word length.
P(k)
= (A - 1) k-1
(k- 1)! e-(X-]) (12)
We approximate the spelling probability given
word length
P(cl c~[k)
by the word-based char-
acter bigram model, regardless of word length.
k
P(cx Ck) = P(Cl
[#) 1-IP(cilci-1)P(#[ck) (13)
i=2
where "#" indicates the word boundary marker.
4 Approximate Word Matching
Since there are no delimiters between words in
Japanese, we have to hypothesize all substrings in
the input sentence as words, and retrieve their ap-
proximately matching words from the dictionary as
correction candidates. The most likely correction
candidate is selected by the word segmentation algo-
rithm using the OCR model and the language model.
For simplicity, we will present the method as if it
were for an isolated word error correction.
In English spelling correction, correction candi-
dates are generated by the minimum edit distance
technique (Wagner and Fischer, 1974). Edit dis-
tance is the minimum number of editing operations
(insertions, deletions, and substitutions) required to
transform one string into another. Since the tar-
get is OCR output, we can restrict the type of er-
rors to substitutions only. Thus, the edit distance
of two words becomes
c/n,
where c is the number of
matched characters and n is the length of the mis-
spelled (and the dictionary) word. Since the cost of
computing the edit distance between a string and all
dictionary words is expensive, we create an inverted
index into the dictionary using character bigrams as
the access keys (Angell et al., 1983).
In Japanese OCR spelling correction, it is rea-
sonable to generate correction candidates by edit
distance for words longer than 2 characters since
the number of correction candidates would be small.
However, for two character words, edit distance is
useless, because there are a large number of words
with one edit distance. Since the average word
length of Japanese is about two characters, this is
a serious problem.
We propose an approximate word matching
method that uses character similarity. Let X be a
non-word caused by OCR errors, and W be a cor-
rection candidate word. X would be corrected by W
if the following relationship holds,
P(X)P(XIX ) < P(W)P(XIW )
(14)
The left hand side represents the probability that
X is an unknown word and that it is correctly rec-
ognized. The right hand side represents the proba-
bility that W is incorrectly recognized as X. The
larger the product of the word unigram probability
P(W)
and the word confusion probability
P(XIW),
the more likely word W is the correct word for X.
Therefore, for two character words, we sort the list
of all one edit distance words by
P(W)P(X I W),
and
select the top-k words as the correction candidates.
For example, if "~" is incorrectly recognized as
"~", there are at least 20 dictionary words whose
edit distance is one.
925
If we sort the list of one edit distance words by
P(W), P(XIW),
and
P(W)P(X[W),
the correction
candidates become as follows,
sorted by
P(W):
t~
~ []~ tt~ ~
sorted by
P(XIW):
tt~ ~ ~ tt~ []~
sorted by P(W) P(XIW):
~ tt~Y ~ ~ ~
Thus, by using
P(W)P(XIW),
we can make "~
~" the most likely correction word. The approxi-
mate word matching method is so accurate that, in
practice, it is sufficient to use only the top 5 candi-
dates. This makes the program very efficient.
5
Experiments
5.1 Training Data for the Language
Model
We used the EDR Japanese Corpus Version 1.0
(EDR, 1991) to train the language model. It is a
corpus of approximately 5.1 million words (208 thou-
sand sentences). It contains a variety of Japanese
sentences taken from newspapers, magazines, dic-
tionaries, encyclopedias, textbooks, etc. It has a
variety of annotations including word segmentation,
pronunciation, and part of speech.
In this experiment, we randomly selected 90% of
the sentences in the EDR Corpus for training. The
first column of Table 1 shows the number of sen-
tences, words, and characters of the training set.
Table 1: The amount of the training data and the
test data for handwritten OCR
training
Sentences 192802
Words 4746461
Characters 7521293
testl
100
2463
3912
There were 133281 distinct words in the training
data. We discarded the words whose frequency was
one, and made a dictionary of 65152 words. We then
counted the vocabulary dependent word bigrams.
That is, the words that were not in the dictionary
were replaced with the unknown word symbol <UNK>
before counting the bigrams. There were 758172
distinct word bigrams. We discarded the bigrams
whose frequency was one, and the remaining 294668
bigrams were used in the word segmentation model.
In the word model, we used 3167 character uni-
grams and 91198 character bigrams. All unigrams
and bigrams whose frequencies were one were dis-
carded. As for the average word length, instead of
averaging all words in the corpus (=1.58), we aver-
aged the words whose frequency was one (=4.76) in
order to avoid the influence of highly frequent words.
5.2 Testl: Handwritten OCR
We designed two experiments to evaluate the perfor-
mance of the OCR error corrector. The first experi-
ment used simulated outputs of a handwriting OCR,
while the second used real outputs of a printed char-
acter OCR.
The first experiment was designed to test the OCR
error corrector over a wide range of baseline recogni-
tion accuracies. The use of the OCR simulator was
necessary because it is very difficult to obtain a large
amount of test data with arbitrary accuracies.
We selected 100 sentences from the remaining 10%
of the EDR corpus for testing. The second column
of Table 1 shows the number of sentences, words,
and characters of the test set. By using an OCR
simulator, we made four sets of character matrices
whose first-rank recognition accuracies were 70%,
80%, 90%, and 95%. They contained at most 10
candidates for each character and their cumulative
recognition accuracies were 90%, 95%, 98%, and
98%, respectively.
For comparison, we implemented the OCR er-
ror correction method, which does not use char-
acter similarity information, presented in (Nagata,
1996). Instead of using character confusion matrix,
he approximated it by the correct character distri-
bution over the rank of the candidates 3. We refer
to his method as the candidate rank method, and
our method as the character similarity method.
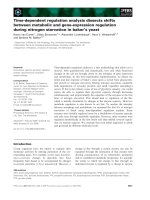
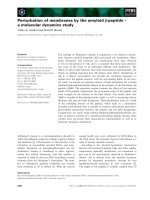
Figure 1 shows the recognition accuracies after er-
ror correction for various baseline OCR accuracies.
The horizontal axis represents the accuracies of the
baseline OCR, while the vertical axis represents the
accuracies after error correction. The farther the
point lies above the diagonal line, the more improve-
ments are brought by the OCR error corrector.
3In (Nagata, 1996), it was assumed that the rank order
distribution of the correct characters is a geometric distribu-
tion whose parameter is the accuracy of the first candidate.
Let c/ be the i-th character in the input,
xlj
be the j-th can-
didate for
ci
in the output, and p be the probability that the
first candidate is correct. The confusion probability
P(xij Icl)
is
approximated as,
P(xij]ci) ~ P(xij
is
correct) ~ p(1 -p)j-1
926
0.95
v 0.0
0.8
0.75
0.7
0.65 i I
0.~ 0 7 0.75
Error
Coerec2ion Accu.1cy
h-"
o
S=m~
R=
J
. . • " "4* "S~mly
°''"
First
Rank Accuracy ,.e
Cumulative Accuracy
-4-
•
Ch=mcter
Similarity D
Cindidm
Rink x
i I i I
0.8 0.85 0.9 0.95
C~lracter
R~.ognition Accuracy (Before NiP)
Figure 1: Comparison of the improvement in char-
acter recognition accuracy
The character similarity method is significantly
better than the candidate rank method for all base-
line recognition accuracies examined. For example,
when the baseline accuracy is 90%, the character
similarity method achieved 97.4%, while the accu-
racy of the candidate rank method was 93.9% 4
5.3 Test2: Printed Character OCR
The second experiment was designed to test the
OCR error corrector on unrestricted text and un-
known OCR. In the first experiment, although the
test sentences were open data, their statistical char-
acteristics are expected to be similar to the training
data because both of them were taken from the same
corpus. Moreover, since the OCR simulator and the
OCR error corrector used the same character confu-
sion matrix, the input character matrices were closed
data with respect to OCR.
We selected 30 documents, each of which con-
tained about 1000 characters. These documents had
nothing to do with the EDR corpus. Ten of them
were newspapers and the other 20 documents were
a miscellaneous collection of novels, essays, patents,
laws, scientific papers, etc Table 2 shows the break-
down of document type and image resolution. News-
papers were scanned at 300dpi and 400dpi, two of
4(Nagata, 1996) reported that, when the baseline accuracy
is 90%, his method achieved 96.3%. The difference between
96.3% and 93.9% comes from the difference in the corpora.
He tested the ATR corpus whose word perplexity is about 30,
while we tested the EDR corpus whose perplexity is about 95.
Here, perplexities are computed using word bigram model.
Table 2: The document type and the image resolu-
tion of the test data for the printed character OCR
200dpi 300dpi 400dpi
newspapers 0 8 10
miscellaneous 20 20 10
them, scanned at 300dpi, were discarded because of
low quality. Other miscellaneous documents were
mainly scanned at 200dpi and 300dpi. Ten that used
smaller fonts were also scanned at 400dpi.
The printed character OCR used was a commer-
cial product (RICOH
Yomitori-Monogatari).
It out-
puts at most 10 candidates for each character as well
as a score ranging from 0 to 100 that represents the
certainty of the first candidate. In fact, we know
nothing about the algorithm and the training data
of the OCR. At least, the training data should be
different from ours since one is created for printed
characters while the other was designed for hand-
written characters.
The 68 test document images contained 69102 in-
put characters. After character recognition, there
were 69305 output characters where 67639 (97.9%)
characters were correct. There were 1422 (2.1%) re-
placement errors, 244 (0.4%) insertion errors and 41
(0.06%) deletion errors.
1
0.99
0.98
0.97
0.96
0.95
0.94
0.93
0.92
0.91
Error Correction
Accuracy
oo
o
o~°
o
e~ o
e • o
~0 i i i i l i I i i
O. .9 0.91 0,92 0.93 0,94 0.95 0.96 0,97 0.98 0.99
Character Recognition Accuracy
(Before NLP)
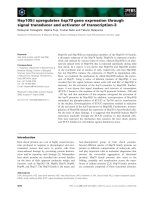
Figure 2: Error correction accuracy
By using the OCR error corrector, 575 characters
were corrected, where 294 were right and 281 were
wrong. The net improvement was only 13 charac-
ters. Figure 2 shows the recognition accuracies of
each document image before and after error correc-
927
Table 3: OCR score and the number of right and
wrong corrections by the error corrector
OCR score <= 100
right correction 294
wrong correction 281
net improvements 13
<= 80 <= 60
199 169
48 22
151 147
tion: 24 documents were improved, 30 documents
got worse, and 14 documents were unchanged.
Figure 2 indicates that the OCR error corrector
improves the accuracy when the baseline recognition
accuracy is less than 98%, while it worsens when the
accuracy is more than 98%. This is mainly because
of wrong corrections, where unknown words in the
original text are replaced by more frequent words in
the dictionary. Most unknown words are numbers,
acronyms, and transliterated foreign words.
Wrong correction can be avoided if the certainty of
the character recognition (OCR score) is available.
Table 3 shows the number of right and wrong cor-
rections when correction is allowed only if the the
OCR score is less than a certain threshold. The
score of the printed character OCR ranges from 0
to 100, where 100 means it is pretty sure about the
output. If we reject the corrections suggested by the
error corrector when the OCR score is more than
80, the number of wrong corrections is reduced from
281 to 48, while that of right correction is reduced
from 294 to 199. Thus, the number of net improve-
ments increases from 13 to 151, which means a 10.6%
(151/1422) reduction in replacement errors.
6
Discussion
Most previous works on Japanese OCR error cor-
rection considered only printed character OCRs
and their target domain was limited. (Takao and
Nishino, 1989) used part of speech bigram model
and heuristic templates for unknown words. They
achieved about 95% accuracy when the baseline ac-
curacy was 91% for magazines and introductory
textbooks of science and technology. (Ito and
Maruyama, 1992) used part of speech bigram model
and beam search in order to get multiple candidates
in their interactive OCR corrector. They achieved
94.61% accuracy when the baseline accuracy was
87.46% for patents in electric engineering. We used
word bigram model, a statistical word model for un-
known words, and a statistical OCR model. We
achieved 97.4% accuracy, when the baseline accu-
racy was 90% and the domain was not limited.
It is very difficult to compare our results with the
previous results because the experiment conditions
are completely different. However, considering the
fact that we did not restrict the target domain, our
method arguably outperformed the previously pub-
lished results, when the baseline accuracy is more
then 90%. There is only one published work inves-
tigating the baseline accuracy much lower than 90%
(Nagata, 1996). As we proved in the experiment, we
outperformed his results significantly.
7
Conclusion
We have presented a Japanese OCR error corrector.
It arguably outperforms previously published tech-
niques. To improve the error correction accuracy,
a more sophisticated language model for unknown
words, including numbers, acronyms, and transliter-
ated foreign words, must be investigated.
References
Richard C. Angell, George W. Freund, and Peter Willett.
1983. Automatic spelling correction using a trigram sim-
ilarity measure.
Information Processing ~ Management,
19(4):255-261.
Kenneth W. Church and William A. Gale. 1991. Probability
scoring for spelling correction.
Statistics and Computing,
1:93-103.
EDR. 1991. Edr electronic dictionary version 1 technical
guide. Technical Report TR2-003, Japan Electronic Dic-
tionary Research Institute.
Andrew R. Golding and Yves Schabes. 1996. Combin-
ing trigram-based and feature-based method for context-
sensitive spelling correction. In
ACL-96,
pages 71-78.
I. J. Good. 1953. The population frequencies of species
and the estimation of population parameters.
Biometrika,
40:237-264.
Norihiro Hagita, Seiichiro Naito, and Isao Masuda. 1983.
Handprinted chinese characters recognition by periph-
eral direction contributivity feature.
IEICE Transactions
on Information and Systems,
J66-D(10):l185-1192. (In
Japanese).
Thomas H. Hildebrandt and Wentai Liu. 1993. Optical recog-
nition of handwritten chinese characters: Advances since
1980.
Pattern recognition,
26(2):205-225.
Nobuyasu Ito and Hiroshi Maruyama. 1992. A method of de-
tecting and correcting errors in the results of japanese ocr.
Transaction of Information Processing Society of Japan,
33(5):664-670. (In Japanese).
Karen Kukich. 1992. Techniques for automatically correcting
words in text.
A CM Computing Surveys,
24(4):377-439.
Yoseph Linde, AndrOs Buzo, and Robert M. Gray. 1980. An
algorithm for vector quantizer design.
IEEE Transactions
on Communications,
COM-28(1):84-95.
Eric Mays, Fred J. Damerau, and Robert L. Mercer. 1991.
Context based spelling correction.
Information Processing
Management,
27(5).'517-522.
Masaaki Nagata. 1996. Context-based spelling correction for
japanese ocr. In
COLING-96,
pages 806-811.
Eric K. Ringger and James F. Allen. 1996. A fertility channel
model for post-correction of continuous speech recognition.
In
ICSLP-96,
pages 897-900.
Tetsuyasu Takao and Fumihito Nishino. 1989. Implementa-
tion and evaluation of post-processing for japanese docu-
ment readers.
Transaction of Information Processing So-
ciety of Japan,
30(11):1394-1401. (In Japanese).
Xiang Tong and David A. Evans. 1996. A statistical approach
to automatic ocr error correction in context. In
WVLC-96,
pages 88-10.
Robert A. Wagner and Michael J. Fischer. 1974. The
string-to-string correction problem.
Journal of the ACM,
21(1):168-173.
Ian H. Witten and Timothy C. Bell. 1991. The zero-frequency
problem: Estimating the probabilities of novel events in
adaptive text compression.
IEEE Transaction on Infor-
mation Theory,
37(4):1085-1094.
928