Tài liệu India’s Poultry Sector: Development and Prospects docx
Bạn đang xem bản rút gọn của tài liệu. Xem và tải ngay bản đầy đủ của tài liệu tại đây (1.11 MB, 67 trang )
India’s Poultry Sector: Development and Prospects. Maurice Landes, Suresh
Persaud, and John Dyck. Market and Trade Economics Division, Economic
Research Service, U.S. Department of Agriculture, Agriculture and Trade Report
WRS-04-03.
Abstract
Poultry meat is the fastest growing component of global meat demand. India, the
world’s second largest developing country, is contributing to the expansion through
the rapid growth of its poultry sector. In India, poultry sector growth is being
driven by rising incomes, together with the emergence of vertically integrated
poultry producers that have reduced consumer prices by lowering production and
marketing costs. Integrated production, a market transition from live birds to
chilled and frozen products, and policies that help ensure supplies of competitively
priced domestic or imported corn and soybeans are keys to future poultry industry
growth in India and in other developing countries.
Keywords: India, developing countries, poultry, demand, prices, vertical integration,
contract growing, feed, policy, trade, economic model.
Acknowledgments
The authors would like to thank Dr. A.P. Sachdev, Dr. V. Shunmugam, Weyland
Beeghley, and Joe Carroll for their assistance in arranging study visits and interviews
in India. David Harvey made valuable contributions to this report. Appreciation is
also extended to Praveen Dixit, Shayle Shagam, and Joy Harwood for their reviews.
John Weber, the editor, and designers Wynnice Pointer-Napper and Victor Phillips, Jr.
provided excellent publication support. Financial support for this project was
provided by the Emerging Markets Program of USDA’s Foreign Agricultural
Service.
Cover Photos: Chicken Center at INA Market in New Delhi, India.
1800 M Street, NW
Washington, DC 20036-5831 January 2004
ii ◆ India’s Poultry Sector: Development and Prospects / WRS-04-03 Economic Research Service/USDA
Table of Contents
Executive Summary . . . . . . . . . . . . . . . . . . . . . . . . . . . . . . . . . . . . . . . . . . . . . . .iii
Map of India . . . . . . . . . . . . . . . . . . . . . . . . . . . . . . . . . . . . . . . . . . . . . . . . . . . . .vi
Introduction . . . . . . . . . . . . . . . . . . . . . . . . . . . . . . . . . . . . . . . . . . . . . . . . . . . . . .1
Recent Trends in Poultry Supply and Demand . . . . . . . . . . . . . . . . . . . . . . . . . .2
Consumer Demand and Preferences . . . . . . . . . . . . . . . . . . . . . . . . . . . . . . . . . .5
Income and Price Sensitivity of Demand . . . . . . . . . . . . . . . . . . . . . . . . . . . . .6
Regional Demand Patterns . . . . . . . . . . . . . . . . . . . . . . . . . . . . . . . . . . . . . . . . .6
Substitutes and Complements . . . . . . . . . . . . . . . . . . . . . . . . . . . . . . . . . . . . . .8
Preferences for Dark and White Meat . . . . . . . . . . . . . . . . . . . . . . . . . . . . . . . .8
Seasonality in Demand . . . . . . . . . . . . . . . . . . . . . . . . . . . . . . . . . . . . . . . . . . . .9
Poultry Production: Structure and Technical Performance . . . . . . . . . . . . . .10
The Role of Integrated Poultry Operations . . . . . . . . . . . . . . . . . . . . . . . . . . .10
Poultry Breeds . . . . . . . . . . . . . . . . . . . . . . . . . . . . . . . . . . . . . . . . . . . . . . . . .12
Poultry Production Practices . . . . . . . . . . . . . . . . . . . . . . . . . . . . . . . . . . . . . .13
Technical Performance Indicators and Production Costs by Region . . . . . . . .14
Poultry Marketing and Prices . . . . . . . . . . . . . . . . . . . . . . . . . . . . . . . . . . . . . . .18
Live-Bird Preference . . . . . . . . . . . . . . . . . . . . . . . . . . . . . . . . . . . . . . . . . . . .18
Processed Poultry Demand . . . . . . . . . . . . . . . . . . . . . . . . . . . . . . . . . . . . . . .18
Poultry Processing . . . . . . . . . . . . . . . . . . . . . . . . . . . . . . . . . . . . . . . . . . . . . .19
Farm Price Determination . . . . . . . . . . . . . . . . . . . . . . . . . . . . . . . . . . . . . . . .20
Farmers’ Compensation Under Integration . . . . . . . . . . . . . . . . . . . . . . . . . . .22
Regional Variations in Retail Prices and Margins . . . . . . . . . . . . . . . . . . . . . .22
Integration Leads to Lower Costs and Margins . . . . . . . . . . . . . . . . . . . . . . . .23
Poultry Trade Policy and Import Potential . . . . . . . . . . . . . . . . . . . . . . . . . . .24
Poultry Feed Supply and Demand . . . . . . . . . . . . . . . . . . . . . . . . . . . . . . . . . . .26
Feed Composition . . . . . . . . . . . . . . . . . . . . . . . . . . . . . . . . . . . . . . . . . . . . . .26
Feed Production and Consumption Trends . . . . . . . . . . . . . . . . . . . . . . . . . . .27
Feed Price Trends . . . . . . . . . . . . . . . . . . . . . . . . . . . . . . . . . . . . . . . . . . . . . . .29
Feed Trade Policy . . . . . . . . . . . . . . . . . . . . . . . . . . . . . . . . . . . . . . . . . . . . . . .30
Prospects for India’s Poultry Sector . . . . . . . . . . . . . . . . . . . . . . . . . . . . . . . . . .31
Income Growth . . . . . . . . . . . . . . . . . . . . . . . . . . . . . . . . . . . . . . . . . . . . . . . . .31
Poultry Integration . . . . . . . . . . . . . . . . . . . . . . . . . . . . . . . . . . . . . . . . . . . . . .32
Corn Trade Liberalization . . . . . . . . . . . . . . . . . . . . . . . . . . . . . . . . . . . . . . . .35
Integration and Corn Trade Liberalization . . . . . . . . . . . . . . . . . . . . . . . . . . . .36
Conclusions . . . . . . . . . . . . . . . . . . . . . . . . . . . . . . . . . . . . . . . . . . . . . . . . . . . . . .38
References . . . . . . . . . . . . . . . . . . . . . . . . . . . . . . . . . . . . . . . . . . . . . . . . . . . . . . .40
Appendices . . . . . . . . . . . . . . . . . . . . . . . . . . . . . . . . . . . . . . . . . . . . . . . . . . . . . .41
1.1-1.6: Poultry and Feed Data Tables . . . . . . . . . . . . . . . . . . . . . . . . . . . . . . .41
2.1– 2.4: India Poultry-Feed Model & Results . . . . . . . . . . . . . . . . . . . . . . . .50
Economic Research Service/USDA India’s Poultry Sector: Development and Prospects / WRS-04-03 ◆ iii
Executive Summary
Poultry meat is the fastest growing component of global meat production,
consumption, and trade, with developing and transition economies playing a
leading role in the expansion. In addition to providing opportunities to increase
poultry exports, rising poultry production spurs growth in global import demand
for feeds and other inputs and in investment opportunities in these sectors. India,
the world’s second largest developing economy, now has a large and rapidly
expanding poultry sector. Expansion in India is being driven by rising incomes and
a shift in industry structure toward integrated ownership and coordination of the
input, production, and marketing operations involved in poultry production
(vertical integration). These factors, in addition to government policies affecting
feed supply levels, will help shape future growth in the poultry industry in India,
as well as in emerging trade and investment opportunities.
Several key findings based on developments in India’s poultry market may provide
insights to prospects for poultry industry growth in other developing countries:
◆ Poultry meat demand is highly price sensitive among low- and middle-income
consumers. Policies that protect the domestic poultry market may also slow
growth in consumption and production.
◆ Factors that discourage transport and distribution of poultry within India,
including limited demand for frozen products, a poor and high-cost transport
infrastructure, and limited and unreliable cold chain, or frozen storage, facili-
ties, are also strong impediments to poultry imports and may be as important as
tariffs in constraining trade.
◆ Vertical integration can promote industry growth by enhancing production and
marketing efficiency and reducing consumer prices. In India, the gains in mar-
keting efficiency appear more significant than in production efficiency.
◆ Competitive feed prices are key to competitive poultry and egg production.
Policies that protect local feed producers are also likely to slow growth in poul-
try and egg output, imposing significant losses on producers and consumers.
Implications for U.S. Agriculture
Prospects for Indian imports of poultry meat are limited. Competitive local production
costs, low demand for frozen meat, and poor cold chain facilities, as well as high
tariffs, are major constraints to trade. Growth in demand for corn and soybean meal,
however, will likely outstrip gains in local production, creating demand for corn
imports and reducing exports of soybean meal. India’s corn import policy, and the
pace of gains in corn and soybean productivity, will influence the amount of trade.
Foreign direct investment (FDI) has, so far, not been a major factor in the develop-
ment of India’s poultry sector. But India’s fast-growing, competitive, and poten-
tially large industry offers investment opportunities in input activities, such as
breeding, medicines, feed, and equipment, as well as vertical integration and
processing. While the country permits FDI in these activities, investments are
constrained by market and policy uncertainty, poor power and transport infrastruc-
ture, and high taxes on processed food.
iv ◆ India’s Poultry Sector: Development and Prospects / WRS-04-03 Economic Research Service/USDA
Incomes, Changing Market Structure, Drive Growth
Available data indicate that, since the early 1990s, poultry meat has been the
fastest growing sector of animal product production and consumption in India.
Factors driving the industry’s expansion include quickening growth in per capita
incomes, a young and increasingly urban population, and declining real poultry
prices. With recent studies suggesting that most Indians do not have strict vege-
tarian dietary preferences, income and price are likely to continue to influence
rising demand.
The expanding role of poultry integrators, primarily in South and West India, has
contributed to declining poultry prices. Integration, typically encompassing enter-
prises ranging from breeding, feed milling, and contract growing to wholesale and
retail marketing, appears to have increased production efficiency and significantly
reduced marketing margins and consumer prices. Future industry expansion may
depend on the pace at which integrated poultry operations spread in the West, East,
and, particularly, the affluent North.
Expansion of poultry sector integration, in turn, may depend on the pace of transi-
tion in India’s poultry sector from a live-bird market to a chilled/frozen-product
market. Live-bird sales now dominate the market, preventing exploitation of
regional comparative advantages in production, or the use of storage, domestic
product movements, and international trade to stabilize supplies and prices. A shift
to mechanical, and more hygienic, processing that would be an integral part of a
transition to a chilled/frozen-product market may also have public health benefits,
although there is little evidence that current practices are creating health problems.
Competitive Production Costs
Data also suggest that India is an internationally competitive producer of poultry
meat. Producer prices of whole birds in India, while higher than in Brazil, compare
favorably with those in other Asian countries and the United States. Poultry
production in India benefits from improved management practices and the avail-
ability of local supplies of corn and soybean meal at internationally competitive
prices. Competitive local prices, combined with high tariffs, poorly defined
phytosanitary requirements, and a limited market for frozen poultry, are constraints
to significant poultry meat imports in the near term.
If recent trends in poultry and egg production in India are sustained, growth in
demand for corn and soybean meal is likely to outpace gains in domestic produc-
tion. For corn, variable domestic production, expanding feed use, and tariff and
quota restrictions on corn imports could combine to constrain growth in both the
poultry and egg industries, raising production costs and consumer prices and
slowing consumption. For soybean meal, the Indian poultry and egg industries
benefit from local surpluses and ready availability, although rising internal demand
may erode exports.
Policies Affecting Market Integration and Feed Trade Key to
Future Growth
With the expansion of India’s poultry industry, the country’s government must
address a number of new issues, including economic tradeoffs between poultry
producers, feed producers, and consumers, potential public health concerns
Economic Research Service/USDA India’s Poultry Sector: Development and Prospects / WRS-04-03 ◆ v
associated with traditional slaughter and marketing practices, and appropriate tariff
and nontariff policies for imports of poultry and industry inputs. Although govern-
ment policy has traditionally given priority to promoting self-reliance in agricul-
tural products, it is unclear how future policy will weigh the competing interests
of, among others, poultry and egg producers, consumers, and feed producers.
Poultry sector integration can yield substantial benefits for the sector and, particu-
larly, consumers of poultry meat. Feed shortages, however, can have significant
adverse effects on producers and consumers of poultry meat and, particularly, eggs.
Although Indian corn producers may gain from higher prices associated with
import restrictions, these gains must be weighed against losses to producers and
consumers of poultry meat and eggs, as well as to the potential international
competitiveness of Indian poultry production. Development and adoption of tech-
nology that can improve the competitiveness of domestic feed production would
allow all producers and consumers to benefit from poultry sector expansion.
Data Limitations Constrain Policymakers
Analysis of developments in India’s poultry sector is made difficult by the lack of
reliable and timely official data on such variables as production, consumption, feed
use, and production and marketing costs. Information from industry sources
suggests that production and consumption of poultry meat in India has grown by
as much as 15 percent annually since the mid-1990s, far faster than indicated by
official data. Based on these findings, poultry will likely grow in importance to the
Indian diet and to farm income and create new pressures for appropriate policies in
industries that supply inputs to poultry producers, as well as in poultry processing
and marketing activities. Better data and information will be needed to support
public and private sector decisionmaking.
vi ◆ India’s Poultry Sector: Development and Prospects / WRS-04-03 Economic Research Service/USDA
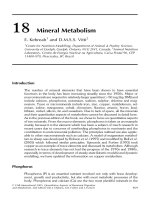
Map of India
Mumbai
Chennai
Kolkata
Arunachal Pradseh
Chinese line of control
Indian claim
Bhopal
Jabalpur
North Region
East Region
South Region
West Region
Pakistan
China
Nepal
Bhutan
Burma
Bangladesh
Economic Research Service/USDA India’s Poultry Sector: Development and Prospects / WRS-04-03 ◆ 1
S
ince the 1970s, global production, consumption,
and trade of poultry meat has grown faster than
that of any other meat. During the 1990s, when
demand growth slowed for other meats, including fish,
demand growth for poultry meat accelerated and
poultry continued to lead the expansion of meat trade.
1
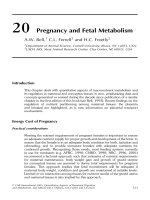
Although demand for poultry meat was strong relative
to demand for other meats in developed countries
during the 1990s, the rapid global gains in poultry
meat supply, demand, and trade were led by gains in
developing countries (fig. 1). Expansion has been most
rapid in the developing Asia region, including China,
South Asia, and Southeast Asia, as well as in Latin
America. The emergence of the poultry sectors in
developing countries, such as India, has the potential
to affect global and U.S. markets for poultry products,
feeds, and related inputs.
With a population of more than 1 billion and real per
capita incomes now growing 3-4 percent annually,
India constitutes a large potential market for poultry
meat. Poultry production and consumption in India
appear to be expanding rapidly, fueled by rising
incomes as well as changes in the structure of poultry
production and marketing. The key structural change
spurring production growth is the emergence of inte-
grated producers, which are combining breeding, feed
milling, contract growing, and marketing activities,
and fostering improved productivity and reduced
marketing costs. Although the country’s expanding
poultry sector now relies on local supplies of corn and
soybean meal, it is unclear whether India will evolve
over the longer term as an importer, or as a competi-
tive producer, of poultry and feed. Development of the
sector may depend on the pace of change in the struc-
ture of poultry production and marketing, as well as
government policies toward production and trade of
poultry and feeds.
This report assesses the supply, demand, structure, and
policy factors affecting the growth of the Indian
poultry industry. The objectives of the study are
twofold: to gain a better understanding of the
prospects for the poultry industry in one of the world’s
largest and fastest growing developing economies, and
to take advantage of the information developed on
India’s diverse sector to draw implications for growth
prospects in the poultry sectors in other developing
countries. To help meet these objectives, the study
analyzes the impacts of alternate economic, technical,
and policy assumptions on poultry supply and demand
prospects and the implications for feed trade.
India’s Poultry Sector
Development and Prospects
Introduction
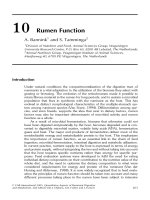
Figure 1
Growth of meat consumption by region, 1990-99
Source: FAOSTAT database.
Growth rate (percent)
Poultry FishMutton & goatPorkBovine
World Developed
countries
Transition
markets
Developing
countries
-8
-6
-4
-2
0
2
4
6
8
10
1
See appendix table 1.1 for a complete summary of trends in
meat and fish supply, demand, and trade.
2 ◆ India’s Poultry Sector: Development and Prospects / WRS-04-03 Economic Research Service/USDA
Assessing recent trends in Indian poultry production
and consumption is complicated by poor and
conflicting data. Government and industry sources
publish very little reliable data on the Indian poultry
sector. Available government data consist only of peri-
odic poultry population estimates, with the most recent
estimates based on a 1992 livestock census. Govern-
ment sources also report wholesale poultry prices for a
few markets, but there are no official statistics on
poultry consumption, marketing, processing, or feed
use. The Food and Agriculture Organization of the
United Nations (FAO) and the U.S. Department of
Agriculture (USDA) publish estimates of Indian
poultry supply and use, but, in the absence of
supporting survey information, these estimates do not
have a strong statistical foundation. Trade associations,
including the Poultry Federation of India, also do not
currently compile industrywide data. Thus, assess-
ments of recent trends rely heavily on information
provided through interviews with various industry
sources.
2
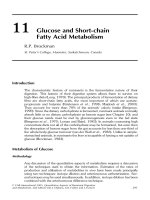
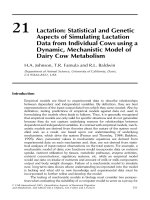
USDA estimates that India’s poultry meat production
grew about 6 percent annually during the 1980s, accel-
erating to 11 percent annually in the 1990s and nearly
19 percent during the 1997-2002 period (table 1 and
fig. 2). With poultry production of 1.4 million tons in
2002, India ranked as the sixth largest poultry
producer in the world, behind the United States,
Brazil, the European Union, China, and Mexico.
USDA estimates of Indian poultry production since the
mid-1990s were revised sharply upward in 2002 to
reflect information from industry sources and are
significantly higher than other official estimates. FAO
estimates, which are based on Government of India
(GOI) data, suggest much lower production and
growth than the USDA data. A third set of estimates,
included in a study by the U.S.A. Poultry & Egg
Export Council (USAPEEC) and reportedly derived
from official GOI and FAO data, is roughly consistent
with USDA data but ends in the mid-1990s.
The lack of timely national survey data makes it diffi-
cult to assess actual production trends. Several factors,
however, suggest that the most recent USDA series,
based primarily on private industry estimates, more
accurately captures actual developments than the other
sources. First, private industry estimates are more
likely to account for the rapid technical and structural
change in the sector. The industry estimates are based
on technical parameters and assessments of breedwise
placements of broiler parents and grandparents by
companies familiar with the industry. The GOI esti-
mates, by contrast, are based on surveys administered
Recent Trends in Poultry Supply and Demand
2
The data and information reported in this study are based pri-
marily on ERS field research in India in August 2001. The ERS
team, comprising Suresh Persaud, Rip Landes, and David Harvey,
traveled throughout India interviewing representatives of poultry
hatcheries, producers, processors, wholesalers, retailers, feed pro-
ducers, and poultry integrators, collecting data and information on
their operations and local market developments. Invaluable support
for the field research was provided by Dr. V. Shunmugam, FAS
Agricultural Specialist in the U.S. Embassy in New Delhi, and Dr.
A.P. Sachdev, local representative of the U.S. Feed Grains Council,
both of whom helped identify key industry contacts.
Table 1—Growth rates of poultry production
in India
Period USDA FAOUSAPEEC
1
Industry
average
2
Growth rates (percent)
1980-90 6.011.7
1990-00 11.05.37.7
1990-96 9.85.88.3
1997-02 18.62.5 14.8
= Not available.
1
USAPEEC is 1990-99 instead of 1990-2000.
2
Industry average is 1997-2001 instead of 1997-2002.
Source: FAOSTAT database, August 2002.
Figure 2
Estimates of poultry production in India
Sources: USDA PS&D database, FAOSTAT database,
U.S.A. Poultry & Egg Export Council.
Mil. tons
USDA
USAPEEC
Industry average
FAO
1981 83 85 87 8991 93 95 97 99 2001 03
0
0.2
0.4
0.6
0.8
1.0
1.2
1.4
1.6
1.8
Economic Research Service/USDA India’s Poultry Sector: Development and Prospects / WRS-04-03 ◆ 3
to known poultry operators every several years, which
may not reflect new capacity and technical change.
3
Second, trends in income growth and prices are consis-
tent with faster growth in poultry consumption and
production since the mid-1990s (table 2). Faster
growth in income (per capita GDP) during the late
1990s, together with population growth, suggests that
demand increased. The lower growth rate for poultry
prices relative to rates for all foods and all meats, at a
time of rising demand, suggests that poultry meat
production grew faster in the late 1990s than in the
earlier periods.
4
Slower growth in the price of corn,
which accounts for a large share of poultry production
costs, also supports faster growth in poultry produc-
tion, as well as slow growth in poultry prices, during
the late 1990s.
Finally, most private sector sources of information,
including hatcheries, feed suppliers, and integrators,
report that the industry is expanding more rapidly than
the 3-4 percent annual growth implied by the FAO
data. It should be noted that industry sources focus
mostly on the organized commercial elements of the
sector. However, the noncommercial elements of the
sector now reportedly account for only 10-20 percent
of broiler supplies and are unlikely to alter broad
industry trends.
Trade or storage of poultry products in India is negli-
gible, so the estimates of poultry consumption are
virtually identical to production (app. table 1.2).
Again, while the consumption numbers constructed
from the industry average production estimates, trade
data, and assumed storage behavior must be used with
caution, the faster consumption growth implied by the
USDA estimates is consistent with other information,
including trends in income and prices, and the views
of industry experts interviewed during field surveys. In
particular, faster growth in per capita incomes and
declining real poultry prices suggest that growth in
poultry consumption is likely to have increased signifi-
cantly since the mid-1990s.
3
Although the industry methods are also susceptible to error, it
does not appear that they have a consistent bias. For example, one
of the industry sources reported that its production estimate may
be understated because the marketing staff that does the assess-
ments is rewarded based on market share performance and, hence,
has an incentive to underestimate competitor placements. On the
other hand, another source indicated that its estimates may tend to
overstate production because some of the firms may have provided
inflated numbers to suggest an impending oversupply that would
lead competitors to reduce placements.
4
Assuming income- and own-price elasticities of demand of 1.7
and -1.5, respectively, the implied growth rates of poultry con-
sumption and production for the periods analyzed would be 1980-
90: 10.5 percent; 1990-99: 9.3 percent; 1990-95: 4.5 percent; and
1995-99: 14.7 percent.
Table 2—Wholesale price and income growth
in India
Wholesale price indices Per capita
PeriodAll food PoultryEggs, fish, Corn
1
GDP
and meat
1981/82=100 Rs.
1979-81 92 123
2
87 87 5,333
1989-91 201 165 193 167 7,063
1994-96 335 277 378 290 8,095
1998-2000 453 304 491 346 9,742
Growth rates (percent)
1980-90 8.14.3
3
8.36.82.9
1990-99 9.57.010.98.43.3
1990-95 10.810.914.311.62.8
1995-99 7.82.36.84.53.8
1
Index of average wholesale prices in Bihar, Karnataka, and Uttar
Pradesh.
2
1982-84 average.
3
1983-90 growth rate.
Sources:
Agricultural Prices in India
, GOI, various issues;
Economic
Survey
, GOI, various issues.
4 ◆ India’s Poultry Sector: Development and Prospects / WRS-04-03 Economic Research Service/USDA
Growth in India’s Poultry Sector Relative to Other Countries
FAO data provide the most complete coverage of
global poultry production and consumption for use in
comparing growth in various countries and regions.
According to FAO data, growth in India’s poultry
sector was slow relative to growth in other devel-
oping countries in both the 1970s and 1990s but fast
in the 1980s (table A-1). USDA estimates, however,
may provide a more accurate assessment of the
growth and structural change in the Indian poultry
industry, particularly during the 1990s (see page 2).
A comparison of the USDA estimates for India with
the FAO data for other regions suggests that Indian
poultry production and consumption are now
expanding at a pace consistent with other fast-
growing developing countries. According to USDA
estimates, India is now the sixth largest poultry
producer in the world, after the United States, Brazil,
the European Union, China, and Mexico.
Table A-1—Growth rates of poultry production and consumption, by global region
1
Production Consumption
Region 1970-80 1980-90 1990-99 1970-80 1980-90 1990-99
Growth rate (percent)
World 5.84.65.35.74.75.1
Developed countries 5.13.52.44.83.61.9
United States 3.75.04.53.25.03.1
Transition markets 7.72.6-5.37.92.6-2.9
Developing countries 7.56.99.
17.86.59.1
Asia developed 8.62.2-0.68.73.61.7
Asia developing 6.38.29.77.27.59.8
South Asia 3.49.66.33.59.66.3
China 5.48.813.55.49.013.6
East & S. East Asia 6.57.45.96.36.95.9
Near East9.
07.65.312.95.05.0
Latin America & Caribbean 9.95.59.09.35.49.1
Africa developing 5.66.04.66.55.54.7
India
FAO data 3.211.56.03.211.56.0
USDA data
2
5.96.39.25.96.39.2
1
Compound annual growth rates between 3-year averages centered on the years indicated.
2
1975-1980 growth rates instead of 1970-1980.
Sources: FAOSTAT database, August 2002; USDA PS&D database, January 2003.
Economic Research Service/USDA India’s Poultry Sector: Development and Prospects / WRS-04-03 ◆ 5
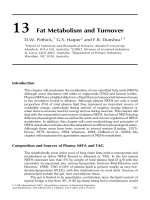
The major meats consumed in India are fish, bovine
(cow and buffalo), mutton and goat, pig, and poultry
(fig. 3).
5
Although consumption of poultry meat appears
to be underestimated in the FAO data, the data indicate
that poultry consumption grew faster than consumption
of other meats and animal products, including milk and
eggs, during the 1990s (table 3). Using the higher
USDA estimates of poultry consumption, poultry’s
share of Indian meat consumption is about 8 percent,
higher than both mutton and goat and pig meat.
According to all major sources—FAO, USDA, and
industry estimates—consumption of poultry meat is
growing faster than consumption of any other major
animal products since 1990.
Industry sources in India tend to minimize the signifi-
cance of religious practices as constraints on growth in
poultry consumption, although there is disagreement on
this issue. Some industry sources claim that the share of
the population that does not eat meat due to religious
practices, as opposed to economic necessity, is fairly
small, perhaps as low as 10-20 percent. A 1994 study
entitled “People of India,” conducted by the Anthropo-
logical Survey of India and based on a survey of 2,469
communities, indicated that only 20 percent of the
“communities” surveyed were vegetarian. According to
the survey, men were more likely to be nonvegetarian,
and older people were more likely to be vegetarian.
6
The age structure of the Indian population indicates a
large potential market for poultry in the years to come,
as 30 percent of the 2000 population were between age
10 and 24. A national food survey, also conducted in
1994 in 32 cities, indicated that 74 percent of urban
households were nonvegetarian.
7
Disagreements have also arisen among government
and industry sources in India regarding the relative
popularity and consumption of various meats, particu-
larly beef and fish, as indicated by the FAO data. Fish,
with the highest level of consumption according to
FAO, is widely consumed and strongly preferred in
some regions, particularly in coastal areas and in
eastern India. Fish availability, however, is highly
seasonal in much of northern and central India and, for
this reason, some analysts question the high level of
consumption at the national level.
The apparent popularity of beef consumption in a
predominantly Hindu country is both surprising and
controversial. The beef consumed is primarily buffalo
meat, which has less religious significance than cow
meat, but some observers still question the high level
of consumption indicated by the FAO data. Beef, along
with pork, is generally the cheapest meat available in
India, and its consumption is reported to be concen-
trated among Muslims and lower income consumers,
and in the southern region. Consumption of both beef
and pork appears to be growing relatively slowly
compared with other meats, although there is now
significant growth in Indian exports of beef, primarily
to Middle Eastern markets. Mutton is generally the
most expensive meat to buy, and available data suggest
that both production and consumption are growing
relatively slowly.
Poultry meat, which is showing the fastest growth in
consumption according to available information, seems
to have broad regional acceptance. Poultry meat is also
generally low cost relative to mutton and fish. Low
poultry prices in South India, due largely to the preva-
lence of poultry integrators in the region, are reported to
have stimulated rapid growth in consumption. Several
sources indicate that per capita poultry consumption in
South India is about 4 kgs, about four times the national
Consumer Demand and Preferences
5
According to FAO data, which provide the most complete
coverage of Indian livestock product consumption.
6
Published in Indian Express, Bombay, April 13, 1994.
7
Conducted by the Indian Market Research Bureau.
Figure 3
Meat consumption shares in India,
1997-99 average
Source: FAOSTAT database.
Fish (51%)
Bovine (29%)
Mutton & goat (8%)
Pig (6%)
Poultry (6%)
6 ◆ India’s Poultry Sector: Development and Prospects / WRS-04-03 Economic Research Service/USDA
average based on industry consumption estimates, but
no firm data support this claim.
Income and Price Sensitivity
of Demand
Growth in the Indian poultry industry is driven prima-
rily by gains in real per capita incomes and changes in
poultry prices. All sources note the importance of
incomes in driving poultry demand, and most recog-
nize the important role of poultry prices. The degree to
which consumption responds to changes in income (or
price) can be expressed as an “elasticity,” which indi-
cates the percentage change in consumption resulting
from a 1-percent change in income (price). Formal
estimates of income or price elasticities of demand for
poultry in India are not available. One recent study
provides income elasticity estimates for “meats” of
.85 (rural) and .63 (urban) and an own-price elasticity
for meats of 88 (both rural and urban).
8
Given the
relatively fast growth in poultry demand relative to
other meats, it seems likely that the elasticities for
poultry are higher than these group averages. For
example, USDA estimates of poultry consumption
growth since the mid-1990s (app. table 1.2), together
with growth rates in per capita income and real poultry
prices (table 2) during the same period, are consistent
with elasticities of demand on the order of 1.7 for
income and -1.5 for price.
Current patterns of poultry consumption provide addi-
tional evidence of the important roles of income and
price. First, poultry consumption is higher in urban
areas, where both average incomes and the number of
high-income consumers are highest. Second, per capita
poultry consumption is higher, perhaps as much as
four times higher, in South India where retail poultry
prices are significantly lower than in other regions.
Given the evidence of sensitivity to both income and
price, the recent trends toward faster growth in per
capita incomes, as well as declining real prices for
poultry, are likely to contribute to more rapid growth
in poultry consumption.
Regional Demand Patterns
India’s States and regions are diverse in terms of
economic factors affecting food demand, including
population, income, and urbanization. The northern
and eastern regions account for the largest shares of
India’s population, but their populations tend to be less
Table 3—Trends in animal product consumption in India
PeriodAll Fish and Bovine Mutton and Pig Poultry Milk Eggs
meat seafood meat goat meat meat meat
1,000 tons
FAO estimates:
1979-81 2,550 2,132 1,628 450 263 111 27,170 496
1989-91 3,776 3,262 2,299 603 417 330 45,878 1,009
1997-99 4,526 4,546 2,626 682 545 542 62,058 1,424
Growth rate (percent)
1980-90 4.04.33.53.04.711.55.47.4
1990-98 2.34.21.71.53.46.43.84.4
1,000 tons
USDA estimates:
1979-81 1,330 601 408 72 214 1,202
1989-91 3,079 1,802 827 393 1,272
1999-01 2,722 1,399 918 1,050 1,991
Growth rate (percent)
1980-90 8.8 11.67.3 6.3 0.7
1990-00 -2.51.0 10.3 4.6
= Not available.
Sources: FAOSTAT database, USDA PS&D database.
8
P. Kumar, Food Demand and Supply Projections for India, Agri-
cultural Economics Policy Paper 98-01, IARI, New Delhi, 1998.
Economic Research Service/USDA India’s Poultry Sector: Development and Prospects / WRS-04-03 ◆ 7
Income Growth and Poultry Meat Demand: A Cross-Country Comparison
The rapid apparent growth in poultry demand in
India is consistent with patterns reflected in cross-
country data for countries in the Asia and Near East
region. Norton and Alwang provide estimates of
income elasticities of demand for poultry and eggs
for a number of developing countries in Asia and
other regions (table B-1). The estimates indicate that
poultry demand is relatively responsive to income in
India, compared with other developing countries.
The relationship between per capita income and
consumption of total meat and poultry for a number of
Asia and Near East countries is shown in figures B-1
and B-2. This analysis is based on 1999 FAO consump-
tion data and 1999 World Bank national per capita
income data that are adjusted for differences in the
purchasing power of national currencies. The figures,
graphed in logarithms to provide a clearer picture, indi-
cate that total meat consumption is strongly related to
per capita income, particularly when countries reach
the equivalent of about $3,000 of per capita income on
a purchasing power parity (PPP) basis. India’s 1999
PPP income is estimated at $2,230.
Among the meats analyzed in the region, poultry
meat consumption is shown to be the most responsive
to income and to have the strongest statistical rela-
tionship with income (table B-2). Fish is the next
most responsive to income.
1
Mutton and goat meat
consumption has a very weak and insignificant rela-
tionship with income among the countries analyzed.
Patterns of meat consumption in India may differ from
other countries in the Asia and Near East region due to
differences in availability, price, consumer preference,
and other factors. Indian consumption of pork and beef
appears not to be showing the signs of income respon-
siveness revealed in a number of the other countries in
the region. On the other hand, traditional preferences
and relatively high local prices may lead Indian
demand for mutton and goat meat to be more respon-
sive to income than in many other countries in the
region. However, in the case of poultry, international
comparisons provide support for the prospects for rela-
tively rapid growth in poultry consumption.
Table B-1—Income elasticities of demand for poultry
and eggs for selected countries
Country PoultryEggs
India 1.50 1.00
Indonesia 1.50 1.20
Egypt 1.30 0.70
Kenya 1.20 1.30
Turkey1.20 0.80
South Korea 1.00 0.80
Nigeria 1.00 1.20
Philippines 1.00 1.00
Mexico 0.93 0.59
Malaysia 0.87 0.73
Brazil0.64 0.
55
Thailand 0.50 0.50
Source: Norton and Alwang, p. 43.
Figure B-1
Total meat consumption and income for selected
Asian countries
Log of kgs/year per capita
0
1
2
3
4
5
6.0 6.5 7.0 7.5 8.0 8.5 9.0 9.5 10.0 10.
5
Log of per capita income (PPP)
y = 0.599x - 1.3706
R
2
= 0.5831
Figure B-2
Poultry meat consumption and income for selected
Asian countries
Log of kgs/year per capita
Log of per capita income (PPP)
y = 1.0283x - 6.693
R
2
= 0.5574
-1
0
1
2
3
4
5
6.0 6.5 7.0 7.5 8.0 8.5 9.0 9.5 10.0 10.5
Sources: ERS calculations using FAOSTAT per capita consumption and
World Bank per capita income data.
Table B-2—Implied income elasticities of demand for
meats for Asia and the Near East
MeatIncome elasticity R-square n
Total meat0.60 0.58 22
Poultry1.03 0.56 22
Pork0.48 0.08 14
Beef0.37 0.29 22
Mutton & goat-0.10 0.00 21
Fish0.59 0.25 22
n = number of Asia and Near East countries. Near East countries
are excluded for analysis of pork.
Sources: Computed from FAO per capita consumption and World
Bank per capita purchasing power parity (PPP) income
data.
1
Muslim majority countries are excluded from the analysis
of pork consumption.
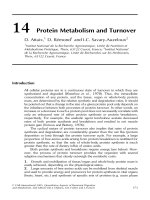
8 ◆ India’s Poultry Sector: Development and Prospects / WRS-04-03 Economic Research Service/USDA
urbanized than in the southern and western areas (fig.
4 and app. table 1.3). In contrast, the southern and
western regions are the most urbanized and have the
highest average per capita incomes. The northern
region also has areas with relatively high incomes and
urbanization, but its averages are weighed down by
low incomes and urbanization in Uttar Pradesh, by far
India’s largest State. The eastern region, including
India’s poorest State, Bihar, has substantially lower
average per capita incomes and urbanization than
India’s other regions.
High incomes and urbanization in the South are
supportive of the region’s rapid gains in poultry
demand, supply, and commercialization. These factors
also support the rapid growth now extant in the
western region, particularly around the large Mumbai
market. The northern region, where the poultry
industry is not growing as rapidly as in the South or
West, does, however, have areas of high income and
urbanization, particularly in Delhi, Haryana, and
Punjab, that can support growth in poultry demand.
Demand fundamentals in the eastern region, however,
suggest that poultry demand growth may remain slow
relative to the other regions.
Substitutes and Complements
The degree to which consumers switch between, or
substitute, different foods because of changes in price
can be expressed as cross-price elasticities of demand.
Formal estimates of cross-price relationships between
poultry and other foods in India are not available. Based
on information supplied by industry and academic
sources, fish is an important substitute for poultry, and
there is a strong correlation between the prices of these
commodities. Goat meat is also a significant substitute
for poultry meat based on relative prices. Given their
different uses in food preparation and the diet, eggs and,
particularly, milk were not considered strong substitutes
for poultry meat.
Most likely some substitution between cereals and
pulses and poultry meat occurs among middle- and
lower income consumers, if not among higher income
consumers. Cereals and pulses account for a large, and
relatively price-inelastic, share of the diet, so relative
prices are likely to affect allocations to poultry. Pulses
and cereals, as well as milk and eggs, are important
sources of dietary protein, but there is little evidence
that consumers substitute among foods on the basis of
protein content. Most consumers, reportedly, are
unaware of the protein content of their daily menu.
Instead, they maximize variety on the plate subject to a
budget constraint.
Poultry meat is still somewhat of a luxury good in
India, but its status is changing. In the past, chicken
was considered to be a delicacy and was more expen-
sive than mutton. But, with the strong gains in poultry
production over the years, poultry prices are now
lower than mutton prices and consumption among
middle-class consumers is expanding rapidly.
Although the price of beef is lower than poultry, and the
quantity consumed is significantly higher according to
available data, it is not clear whether beef will be a
major source of competition for poultry. At present, in
contrast to the relatively universal appeal of poultry,
beef consumption is mostly in Kerala and Tamil Nadu
and, to a lesser extent, in West Bengal and the north-
eastern States where beef slaughter is permitted. From a
socioeconomic standpoint, beef is consumed primarily
by Muslims and the relatively poor.
Preferences for Dark and White Meat
Indian consumers prepare poultry in a variety of ways,
the most popular being curries, kabobs, and tandoori
(barbecue) dishes. Although these dishes are generally
made with a mix of white and dark meat, industry
sources claim that Indian consumers have a preference
for the dark meat portions. This preference for dark
Figure 4
Regionwise population and income in India
Source: Economic Survey, 2001/02, Ministry of Finance,
Government of India, 2002.
Millions
Delhi (UT)
Haryana
H. Pradesh
J. & Kashmir
Punjab
Rajasthan
U. Pradesh
Assam
Bihar
Orissa
W. Bengal
Gujarat
M. Pradesh
Maharashtr
a
A. Pradesh
Karnataka
Kerala
Tamil
Na
du
0
25
50
75
100
125
150
175
200
0
5
10
15
20
25
30
35
40
Production
(left axis)
Per capita income
East
18%
urban
South
33%
urban
West
35%
urban
North
26%
urban
Net State product/capita, 1,000 rs.
Economic Research Service/USDA India’s Poultry Sector: Development and Prospects / WRS-04-03 ◆ 9
meat is not, however, reflected in noticeable price
premiums for dark meat.
9
Sales of chicken parts are
limited to high-end urban shops, but per kilogram
prices for dark and white meat parts were the same, or
very nearly the same, in all the markets visited. It is
possible, however, that these prices are skewed by the
nature of the clientele in such shops, and that many
consumers would pay some premium for dark meat
pieces if they were widely available.
Seasonality in Demand
Perhaps the most significant impacts of religious prac-
tices on consumption of poultry and other meats in
India are the strong seasonal patterns in demand in
some regions. Seasonal religious observances can lead
to significant fluctuations in demand. In some cases,
religious practices prohibit meat for specified periods,
and in others, celebrations and festivals lead to
increases in meat demand. In the Mumbai region, reli-
gious observances significantly reduce poultry
consumption for about 3 months of the year, although
some festivals can lead to offsetting increases in
demand. In Calcutta, on the other hand, an increase in
poultry consumption is associated with the Durga Puja
festival, and no significant seasonal downswings in
consumption are reported.
With limited frozen storage facilities or interregional
movement of live birds, the seasonal swings in
demand contribute to volatility in market prices of
poultry meat in some regions. For example, during
August 2001, a seasonal drop in demand helped push
prices in the Mumbai market down sharply, and below
production costs for most producers in the region.
9
This is in contrast to East Asian markets, in which dark meat
prices are higher than white meat prices, and to North American
markets, where prices for white meat are higher than for dark
meat. These international differences in price for poultry cuts drove
much of the growth in global poultry meat trade in the 1990s.
10 ◆ India’s Poultry Sector: Development and Prospects / WRS-04-03 Economic Research Service/USDA
The structure and costs of production in the Indian
poultry meat industry vary from region to region.
While independent and relatively small-scale
producers still account for most production, relatively
large-scale integrated producers account for a growing
share of output in some regions. Integrated operations
include large regional firms that incorporate all aspects
of production, including raising grandparent and
parent flocks, rearing day-old-chicks (DOC),
contracting production, compounding feed, providing
veterinary services, and wholesaling.
10
Most integrated
firms also have some presence in retail marketing,
largely for the purpose of establishing price leadership
and having influence over wholesale-retail margins
(see section on poultry marketing). Some integrators
(about six to eight nationwide) also process a share of
their production in modern, automated, or semi-auto-
mated plants.
India’s poultry industry also has a number of smaller,
partially integrated firms that typically omit one or
more of the major input enterprises, such as breeding
or feed milling, and may have little or no contract
production. Large-scale integrated producers are most
prominent in the southern and western regions.
Smaller, independent, and sometimes partially inte-
grated producers account for most poultry production
in the northern and eastern regions.
Commercial broilers and eggs are produced by sepa-
rate enterprises using specialized broiler and layer
breeds and distinct management practices. Joint
production of poultry meat and eggs from dual-
purpose birds is confined to noncommercial “back
yard” operations. Although data on noncommercial
production of poultry and eggs is not available,
industry sources indicate that this industry segment is
declining and probably accounts for only 10-20
percent of India’s total output. This study excludes
analysis of this component of production.
The Role of Integrated
Poultry Production
Poultry integrators have been expanding most rapidly
in southern India, particularly in the Coimbatore area
of Tamil Nadu, where, reportedly, integrators now
account for about 75 percent of production and
consumption. Integrators have recently become more
prevalent in western India, including Pune, Nashik,
and Mumbai, where they now account for about 35
percent of production and consumption. In northern
and eastern India, integration has moved more slowly,
Poultry Production: Structure and Technical Performance
Data Collection Methods
The data used in this study were collected during a
field survey by an ERS team that visited India in
August 2001. Because of significant regional varia-
tions in poultry demand and in the structure of
poultry production, the team traveled throughout the
country, visiting Delhi, Punjab, and Haryana in the
North; Ahmedabad, Mumbai, Pune, and Nashik in
the West; Coimbatore, Hyderabad, and Bangalore in
the South; and the Calcutta region in the East. In the
absence of a reliable listing of producers from
which to draw a sample, and to contain data collec-
tion costs, survey respondents were selected based
on recommendations of industry sources, who iden-
tified individuals that had both knowledge of the
industry and reliable records.
In each region, the team visited poultry hatcheries,
producers, processors, wholesalers, retailers, and
feed producers, asking each respondent the same
operations-related questions. The production and
marketing cost data are based on 18 respondents (4
in the North, 5 in the West, 8 in the South, 1 in the
East) who provided complete and consistent data.
Although the sample size is small for such a large
country, the variation in responses within regions is
generally small, increasing confidence in the relia-
bility of the regional and national averages. Because
of the small sample size, however, the results should
be interpreted with caution. In particular, the sample
size is very small in the East (1) and is likely skewed
toward larger integrated operators in the West.
10
The poultry breeding chain starts with “pure line” flocks that
are multiplied into “grandparents” and then “parents,” which are
the source of eggs for the day-old chicks (DOC) used in broiler
enterprises. Smaller enterprises may simply purchase DOCs from a
hatchery, while larger enterprises can reduce DOC costs by inte-
grating maintenance of parent and grandparent flocks into their
operation.
Economic Research Service/USDA India’s Poultry Sector: Development and Prospects / WRS-04-03 ◆ 11
accounting for about 10 percent of the market. In the
North, integrators have found it difficult to enlist and
manage contract growers and, despite the presence of
the large and affluent Delhi market, there are no major,
fully integrated contract growers in the region. In the
East, lower per capita incomes and low demand for
poultry meat are likely contributors to the slow rate of
growth.
In southern India, the process of integration began in the
mid-1990s and accelerated rapidly as independent
growers found the guaranteed returns of contract
farming preferable to the vagaries of market returns. As
integration expanded, some formerly independent hatch-
eries and feed millers found it necessary to become inte-
grators themselves or risk going out of business.
Integration has brought two important changes to the
poultry industry in southern India: lower average costs
of production through improved technology and
management practices and, particularly, a collapsing of
the margins previously commanded for the various
production inputs; and smaller producer-retail margins
and lower retail prices for poultry meat, which has been
a key demand stimulus in the southern and western
regions (see section on poultry marketing and prices).
In the last 2-3 years, several integrators have begun to
operate around the Mumbai market in western India,
primarily in the Pune and Nashik areas. They include
poultry integrators who are expanding from southern
India, ventures by national or regional hatchery and feed
businesses, and local poultry wholesaling firms, all
competing to enlist contract growers and expand market
share in the region. This competition, combined with
seasonally weak demand due to religious observances,
led at times to severely depressed producer and retail
prices in the Mumbai market in 2001.
For integrators to succeed in the Mumbai market as
they have in southern India, they must overcome the
dominant role of the traditional Mumbai wholesale
trade. Traditional trading relationships, together with
the high cost of establishing an effective retail pres-
ence, may prevent integrators from competing down
marketing margins and expanding their share of the
market. The firms that are entering this market,
however, all have significant financial resources and
plan to address this issue through strategic links with
existing food retailing operations.
Integrators are also expanding in the areas of Banga-
lore and Hyderabad in the South and Calcutta in the
East. The only major region where large integrators
have not yet made significant inroads is in North India,
including the large Delhi market. In this region, some
individual producers have expanded into feed mixing
and direct retail marketing. No producers, however, are
involved in rearing parent or grandparent flocks, and
very few are contracting out production. The lack of
poultry integration in the North may be due to difficul-
ties in enforcing contract-farming agreements.
11
Also,
climatic extremes of hot and cold make poultry
production more management- and capital intensive in
the North, compared with the other regions. Lastly,
unlike other regions where the integrators have flour-
ished, the Punjab-Haryana-Western Uttar Pradesh area
near Delhi is heavily irrigated and highly productive
for crop farming. As a result, allocating management
and labor to contract farming for the margins fixed in
standard broiler contracts may be less appealing.
Contract models that call for farmers to serve only as
the owner of the houses, with the integrator providing
all labor and management, may be more successful in
this region (see section on farmer’s compensation
under integration).
According to most of the survey respondents, the
primary constraint in expanding integrated poultry
operations is marketing. Most integrators sell the bulk
of their output as live birds in the wholesale markets,
with a small share sold in retail markets as either live
or dressed birds or products. With limited demand or
capacity for frozen products, and the high cost of
moving live birds to distant markets, integrators are
mostly confined to their local regional market and its
seasonal demand patterns (see section on marketing).
Another common concern among survey respondents
is high interest rates. Producers or integrators looking
to expand facilities can expect to pay interest rates of
about 15 percent on commercial loans that, at the
current rate of wholesale price inflation, imply a 9-10
percent real cost of borrowing. In general, the avail-
ability of feed grain or oil meal was not considered to
be a significant problem, although seasonal shortages
of corn can and have resulted in higher prices. Only in
northern India did integrators regard enlistment, organ-
ization, or management of contract farmers as a signif-
icant problem.
11
At present, India does not have a law covering contract farm-
ing and the contracts between farmers and contractors cannot tech-
nically be enforced. Integrators and growers in other regions
appear to be working together smoothly despite this problem, but
this is not the case in North India.
12 ◆ India’s Poultry Sector: Development and Prospects / WRS-04-03 Economic Research Service/USDA
So far, foreign direct investment (FDI) has been a
minor factor in the expansion of integrated poultry
operations in India. A large integrator in both the
southern and western regions operates a processing
facility built recently with the assistance of private
Saudi Arabian investment. Two large Asian integrators,
Japfa from Indonesia and CP from Thailand, have
been in the feed business in India for several years but
have, so far, not expanded into poultry integration.
Poultry Breeds
Although a number of poultry breeds are available in
India, the Cobb 100 breed owned by Venkateshwara
Hatcheries (VH) currently accounts for 60-70 percent
of all broilers in India. VH has a nationwide infrastruc-
ture that supplies its breed to broiler operators, either
as grandparents, parents, or DOCs, and also provides
comprehensive veterinary services to its growers. At
present, all broilers supplied by VH are the Cobb 100,
a relatively older breed based on breeding stock
imported from the United States and benefiting from a
long period of adaptation to Indian climatic and
disease conditions. A Cobb 500 line, based on more
recently imported breeding stock, is reported to be
under development, as is a Cobb 400 line, based on a
cross between the Cobb 500 and the acclimatized
Cobb 100. Other breeds present in India include Ross
(U.K.), Hybro (Netherlands), Hubbard (U.S.), Avian
(U.S.), and Anak (Israel).
The dominant position of VH and its Cobb 100 in
broiler breeding in India stems from a combination of
factors: government restrictions on imports of grand-
parent lines that were in place until 1995, and the
entrepreneurial skills of the late VH founder, who is
known as the founder of the Indian poultry industry.
Prior to loosening restrictions on imports of grand-
parent stock, only pure line imports were permitted.
Cobb became one of the few imported pure line breeds
available in India, and the breed was developed, accli-
matized, and spread throughout the country as VH
built a nationwide infrastructure of hatcheries and
veterinary services. Most of the other imported breeds
now present in India have entered only since 1995. As
a result, promoters of other breeds have had a much
shorter period to acclimatize their breeds to Indian
conditions, establish products in the marketplace, and
develop production facilities and marketing networks.
Industry sources report that the dominant role of the
Cobb 100 breed and VH in the Indian broiler hatchery
industry has both advantages and disadvantages for the
growth of the broiler industry. On the technical side,
the well-acclimatized Cobb 100 is known for its hardi-
ness in Indian climate and disease conditions. It has
also proved to be a good “breeders bird,” producing a
relatively high number of hatching eggs per parent,
compared with other breeds. Another advantage is the
generally ready availability of chicks and veterinary
support services from VH’s widespread operations.
The Cobb 100, however, is primarily a layer and,
hence, provides a relatively low 75-percent meat yield,
compared with 77-78 percent for newer, specialized
broiler breeds. The Cobb 100 is also a very old breed,
with superior breeds available internationally.
Perhaps a more significant concern with the dominant
role of the Cobb 100 relates to the implications of
concentration and market power in the broiler chick
business. Several integrators indicated that their alloca-
tions of grandparents, parents, or DOCs have been
reduced in certain market conditions, ostensibly to
support broiler prices, but also having the effect of
limiting the growth of some integrators. With the
owner of the Cobb 100 breed also venturing into inte-
grated operations, other firms feel they are at a
competitive disadvantage. Several integrators resorted
to importing and developing their own breeding opera-
tions because they felt they could not rely on sufficient
allocations of Cobb 100s to meet their needs and
expansion plans. Data collected from study respon-
dents suggest that firms that integrate grandparent
breeding enterprises into their business, as opposed to
purchasing Cobb 100 parents or DOCs, experienced
significant cost savings (table 4).
With the expansion of large-scale integrators since
the mid-1990s, and the liberalization of grandparent
imports in 1995, imports of breeding stock of various
international breeds have increased. Given the
apparent cost advantages to integrated firms, this trend
is likely to continue. But it is unclear how long it will
take for the new breeds to become sufficiently accli-
Table 4—Average day-old-chick costs in India
Region Integrators Other farms
Rs/bird
North NA 11.79
West8.75 14.00
South 7.89 10.00
East10.00 NA
NA = Not available.
Source: ERS field survey, August 2001.
Economic Research Service/USDA India’s Poultry Sector: Development and Prospects / WRS-04-03 ◆ 13
matized to Indian conditions to counter the hardiness
and breeding advantages of the Cobb 100. Although
Indian firms are importing breeding stock and tech-
nology from foreign breeders, there is currently no
FDI in broiler breeding in India.
Poultry Production Practices
Poultry production practices in India vary across
regions, based on differences in climate and on the
presence of poultry integrators, who impose a standard
level of technology and operational efficiency on
poultry enterprises. In general, the larger and/or inte-
grated operations, particularly in southern India and
the Mumbai region, appear to be quite technically and
economically efficient, with operators exhibiting
strong knowledge of correct breeding, feeding, veteri-
nary, and rearing practices. In general, technical
performance indicators for these operations, including
numbers of DOCs per parent, days-to-market, feed
conversion, and mortality, are comparable with
average levels achieved in U.S. operations.
Facilities and equipment. Climate conditions are
most suited to poultry production in southern India,
where average temperatures, though fairly high, tend
to avoid the extreme heat of the eastern and western
regions, and the extremes of both hot and cold found
in northern India. The capacities of houses range from
8,000 to 20,000 birds and from 6,000 to 15,000 square
feet. Based on the field survey, production facilities
and equipment in the four regions can be characterized
as follows:
◆ South. In the South, poultry houses tend to be built of
brick pillars, with open sides, tile roofs, and concrete
floors. Cooling, when needed, is provided by ceiling
fans, and heating is unnecessary except for brooding.
Bedding is generally paddy husks. Manual feeders
and bell-type drinkers are most common, with little
use of automatic watering and feeding systems.
◆ West. In the Mumbai region, where average summer
temperatures are higher than in the South, houses
are also built of brick with tile roofs and concrete
floors, but tend to be mostly enclosed with evapora-
tive automatic cooling systems. Automatic watering
and feeding systems are more common in this area.
◆ East. In the region north of Calcutta, houses are
constructed of brick pillars with open sides, very
similar to houses in the South, although side cur-
tains are generally present to help hold in warmth in
the slightly cooler winters. Feeding and drinking
equipment is generally manual, and ceiling fans
provide summer cooling.
◆ North. In the North (Punjab, Haryana, western U.P.),
both summer and winter weather are more extreme
than in the other regions. Houses are built of brick
and concrete and have either enclosed sides or side
curtains and concrete floors. Some houses have
automatic systems for both evaporative cooling and
heating. Because land prices are significantly higher
in this region, two-storied houses are common. Both
manual and automatic watering and feeding equip-
ment is seen in this region.
Breeding practices. While independent operators
generally purchase DOCs from local hatcheries, such
as VH, integrators generally produce their own chicks
from either parent stock or grandparent stock raised in
their own facilities. For integrators, producing DOCs
from their own parent or grandparent operations is a
key source of savings. Integrators reported DOC costs
from their own grandparent operations of Rs6-10 per
chick, compared with costs of Rs10-15 per chick for
other operations. In addition, market prices of DOCs
are, reportedly, quite volatile depending on local
supply and demand conditions. At times, market DOC
prices can crash to as low as Rs3 and rise to as high as
Rs16-18. Recently, hatcheries in some areas jointly
agreed to destroy hatching eggs because of large
surpluses of DOCs.
The parent and grandparent operations visited were
run with strict standards of environmental control and
sanitation to protect the health and productivity of the
flocks. According to industry sources familiar with
both Indian and U.S. practices, it is typical for Indian
poultry breeding operations to achieve levels of
performance, in terms of eggs per parent and hatching
percentage, superior to those achieved in U.S. opera-
tions. Using Cobb 100 parents or grandparents,
growers typically achieve about 170-180 eggs per
parent with a hatching percentage of 90 percent or
higher. These relatively high levels of productivity are
attributed to the hardiness of the Cobb 100 breed, as
well as higher labor inputs relative to U.S. operations.
Feeding practices. Growers tend to cite feed costs as
the critical component of controlling and lowering
production costs. Reducing feed costs includes steps to
improve feed conversion, including innovations such
as pelletization and automated feeding, as well as
improvements in feed purchasing and logistics.
14 ◆ India’s Poultry Sector: Development and Prospects / WRS-04-03 Economic Research Service/USDA
Poultry farmers have a strong understanding of the
importance of balanced feed rations. They recognize
corn and soybean meal as technically superior ingredi-
ents for broiler rations, with corn generally accounting
for most of the energy in the feed ration and soybean
meal providing most of the protein. Most operators,
however, use substitutes for both the energy and
protein ingredients in the ration based on changes in
relative market prices. The most common corn substi-
tutes for energy are broken rice, millet, and wheat
(table 5). Fish meal, sunflower meal (decorticated),
and peanut meal are the most common protein substi-
tutes for soybean meal.
Given the key role of feed costs in overall costs of
production, feed conversion rates (FCR) are a major
concern for growers, most of whom have a clear
understanding of their FCR, as well as the impacts of
alternative ration ingredients on FCRs. Most operators
use mash-type feeds, but a number are beginning to
experiment with pelletized feeds. Although pelletized
feeds are more expensive than mash feeds by Rs0.50-
1.00 per kg, or about 5-10 percent, they result in less
wastage, assure a more balanced ration for each bird,
and lower FCR. Several operators that use pelletized
feed report about a 0.1-kg improvement in the FCR.
The price volatility of local feeds, particularly corn,
and the absence of futures markets to manage price
risk make it difficult to control and predict feed prices.
Some operators pursue a strategy of buying and
storing ingredients when prices are low, but others do
not because of the difficulty in accurately predicting
price movements. Concerns with feed costs tend to be
greatest in southern India, where both corn and
soybean meal are not available locally and must be
purchased from suppliers in central and northern India.
Feed imports are normally not an economically viable
option because of large national surpluses of soybean
meal and a restrictive tariff-rate quota (TRQ) regime
for corn imports (see feed trade policy section).
Most poultry integrators include feed milling as one of
their integrated enterprises. Most also indicate signifi-
cant cost savings, as well as more consistent quality,
from producing their own feed. A number of feed
milling companies, threatened by integrated operations
cutting into their customer base, have evolved into
poultry integrators.
Veterinary practices. Poultry operators also appear to
have a strong understanding of the steps needed to
safeguard the health of their flocks. Most independent
growers retain consultant veterinarians to monitor and
address health problems in the flocks. Poultry integra-
tors provide medicines and veterinary services as part
of their package of inputs for contract growers. Diag-
nostic facilities and medicines are readily available.
Outbreaks of flock-threatening diseases, though
possible, are rare.
Foreign direct investment in poultry inputs. FDI in
poultry production inputs is most common in the area
of pharmaceuticals, as most of the companies oper-
ating in India are multinational corporations or Indian
joint ventures with multinationals. Although some
items are imported, most drugs and vaccines for
poultry production are produced in India.
The major Indian feed companies are Indian owned. Two
foreign companies, Japfa from Indonesia and CP from
Thailand, now have feed operations in India, but they do
not account for major market shares. Most poultry
equipment, including feeders, waterers, and climatic
controls, is produced by Indian-owned companies. Some
equipment, however, is imported and some items are
produced in joint ventures with foreign companies.
Technical Performance and Production
Costs by Region
Summary performance indicators, including days-to-
market, weight, FCRs, and mortality rates and variable
production costs for the operations visited, are shown
in table 6. The results should be interpreted with
caution because they are based on a small number of
firms that may not represent overall regional or
national averages. In particular, the sample is very
small (1) in the East and is likely skewed toward larger
integrated operators in the West. In general, however,
the indicators suggest greater technical efficiency in
Table 5—Major poultry ration ingredients in India
EnergyProtein Other
Corn Soybean meal Soy oil
Broken rice Fish meal Sunflower oil
Pearl millet Sunflower meal
1
Minerals
WheatPeanut meal
Sorghum Rice bran
Rice bran Meat meal
Shares:
60-65 % 30-35% 5%
1
Decorticated.
Source: ERS field survey, August 2001.
Economic Research Service/USDA India’s Poultry Sector: Development and Prospects / WRS-04-03 ◆ 15
the South and West, compared with the North and
East. Findings also suggest greater technical efficiency
in those operations employing automatic climate
controls in their houses, regardless of region. Opera-
tions in the South, as well as the firm surveyed in the
East, tend to achieve roughly equivalent or better tech-
nical performance than the other regions without
having to use costly environmental controls (other than
simple ceiling fans).
FCRs and days-to-market are generally higher in the
North, at least in part because of higher market weights.
Mortality rates are also highest in the North, where the
extremes of hot and cold temperatures are most prob-
lematic. Growers in this region clearly face the greatest
challenge from climatic conditions, which they cite as a
key reason that their costs are higher than in the South.
Northern Indian growers, however, have less difficulty
with corn supplies because of local production.
Variable production costs by region. Average vari-
able costs of production are lowest in the South,
followed by the West, East, and North (fig. 5).
However, the range of average variable production
costs across regions, from Rs25.92 per kg to Rs29.44
per kg, is not very large. Feed is the largest component
of costs, ranging from about 55 percent of total vari-
able costs in the North to about 64 percent in the
South. DOCs are the second largest cost component,
ranging from 17 percent of variable costs in the South
to about 23 percent in the North.
◆ South. Variable production costs in the South aver-
age Rs25.92 per kg. Some of the larger integrators
in the region reported costs below Rs25.00 per kg.
The South has the lowest total costs despite facing
the highest feed prices (both corn and soybean meal
generally must be shipped from greater distances
than in the other regions). DOC costs are lowest in
the South, and mortality costs are also low relative
to two other regions. The greater cost efficiency in
the South likely stems both from favorable climate
and better management by the integrated poultry
operations. Relatively low energy costs for both
heating and cooling hold down “other” costs in the
South.
◆ West. Average variable costs in the sample of western
region operations were Rs26.75 per kg, with this
region having the lowest feed costs per kg of output
and the lowest mortality costs. Producers in this
region benefit from close proximity to Madhya
Pradesh, which produces soybean meal and corn, and
to Karnataka and Andhra Pradesh, which also pro-
duce corn. As noted earlier, however, all of the firms
visited in this region were relatively large and well-
managed integrated operators using climatic controls
in their houses; hence, these findings may not be
indicative of the region as a whole. “Other” costs are
Table 6—Summary of performance indicators and
variable costs for poultry in India, by region
Variable North West South East
Harvest weight
(kg/bird)1.83 1.68 1.89 1.50
FCR (kg/kg)1.88 1.88 1.85 1.90
Mortality rate
(percent) 4.33.93.93.9
Rs/kg, live harvest weight
DOC cost6.72 6.14 4.35 6.67
Feed 16.13 15.96 16.58 17.10
Mortality 0.71 0.65 0.62 0.75
Other
1
5.88 4.87 4.38 3.98
Total variable
costs 29.44 27.63 25.93 28.50
(US$/kg)(0.62) (0.59) (0.55) (0.60)
Feed share
(percent) 54.857.863.960.0
Feed price
(Rs/kg)8.58 8.55 8.97 9.00
1
Includes medicines, labor, energy, grower fees, and overhead.
Source: ERS field study, August 2001.
Figure 5
Variable poultry production costs in India,
by region
Source: ERS field survey, August 2001.
Rs/kg, live weight
DOC OtherMortalityFeed
North West South East
0
5
10
15
20
25
30
16 ◆ India’s Poultry Sector: Development and Prospects / WRS-04-03 Economic Research Service/USDA
relatively high in this region, in part due to the energy
costs associated with operating climate controls.
◆ East. The eastern region had the third highest total
for variable production costs, although the sample
consists of only one, relatively large, integrated
operator. Based on the data from this firm, this
region has the highest feed costs, due to relatively
high feed prices and FCR, as well as relatively high
mortality and DOC costs.
◆ North. Average total variable production costs were
highest in the sample of northern India producers, at
Rs29.44 per kg. The benefits of relatively low feed
prices in this region are offset by relatively high
FCRs, DOC costs, mortality rates, and energy costs.
To some extent, performance and costs are affected
by the climatic extremes in this region. The absence
of integrated poultry operations probably also
affects costs, particularly for DOCs.
Fixed production costs by region. Data were collected
on fixed costs of production, including housing, equip-
ment, and, where applicable, environmental controls
(table 7 and fig. 6). As expected, given differences in
climate and production practices, there are sizable
regional differences in fixed costs of production. Fixed
costs tend to be lowest in the South and the East and
highest in the West and North. In both the South and
East, the favorable climate permits relatively low
housing costs, automatic climate controls are generally
unnecessary, and most producers use lower cost manual
feeding and watering equipment.
By contrast, costs of both housing and equipment are
significantly higher in the North and, at least for the
operations visited, in the West. On a square-foot basis,
housing and equipment costs in the West and North are
two to three times higher than for typical producers in
the South or East. With interest rates on bank borrowing
for poultry operations of about 15 percent, according to
most respondents, the differences in fixed costs can
translate into significant differences in interest costs
across the regions. Assuming a 15-percent interest rate,
financing of 100 percent of construction costs, and six
flocks per year per house, interest costs are Rs2.96-4.72
per square foot per flock in the North and West, and
Rs1.65-1.72 in the South and East.
Although estimates of land costs are not available
across all regions, industry sources indicate that land
costs are highest in the North (Punjab, Haryana,
western Uttar Pradesh), where farm land is more likely
to be irrigated and more productive for crop farming.
In the Punjab region, farmers quoted land prices
ranging from of Rs150,000 to 1,200,000 ($3,100-
$25,000) per acre, depending on location.
Overall, the data collected suggest that lower fixed
costs may tend to hold down poultry costs and prices
and favor industry expansion in the South and East.
However, because it is not feasible to ship large
numbers of live birds across regions, producers in the
South and East will not be able to exploit this advan-
tage until there is a larger market for processed chilled
or frozen poultry (see section on marketing). The rela-
tively high fixed costs in the North and the West may
also tend to restrict the participation of smaller
growers in industry expansion in this region. While the
integrated operations in the South and East tend to
enlist both small and large growers, growers in the
West and North may have to be larger firms with
greater financial resources to invest.
Table 7—Summary of fixed costs of production for
poultry in India, by region
Variable North West South A
1
South B
1
East
Rs/sq. ft.
House 72.92 100.00 67.13 52.83 57.50
Equipment45.43 88.61 51.53 13.15 11.11
Total 118.35 188.61 118.66 65.98 68.61
Rs/sq. ft./flock
Memo:
Interest cost
2
2.96 4.72 2.97 1.65 1.72
1
South A includes all respondents; South B excludes one, high-cost
respondent.
2
Assuming a 15-percent interest rate and six flocks per year.
Source: ERS field study, August 2001.
Figure 6
Fixed poultry production costs in India, by region
Source: ERS field survey, August 2001.
Rs/sq. ft
Equipment House
North West South A
1
South B
1
East
0
25
50
75
100
125
150
175
200
1
South A includes all respondents; South B excludes one
high-cost respondent.
Economic Research Service/USDA India’s Poultry Sector: Development and Prospects / WRS-04-03 ◆ 17
India’s Production Costs Relative to Other Countries
To assess the relative competitiveness of Indian
poultry production, Indian variable production cost
and farm price data can be compared with data for
other countries, including the United States, Brazil,
and several Asian countries (tables D-1 and D-2).
The Indian cost data comprise costs of day-old-
chicks (DOC), feed, mortality, medicines, labor, and
power reported on the basis of a kilogram of live-
weight production, a common industry approach for
computing variable costs. Data for other countries are
those reported by USDA’s Foreign Agricultural
Service in annual “attache reports” on the poultry
industry in each country. Although the cost
accounting methods may vary across countries, it is
likely that all the estimates include the key cost
items—DOCs, feed, and mortality—which generally
account for 80-85 percent of the variable costs of
poultry production. Thus, although accounting
methods may vary, the data should still be useful for
comparison purposes.
The comparisons suggest that, while Brazil is the
lowest cost producer, production costs in the
southern, western, and eastern regions of India are
very competitive with those in other countries,
including the United States. Poultry costs in these
Indian regions appear to be competitive with those in
Thailand, a major exporter of poultry meat, and
significantly lower than those in East Asia and other
parts of Southeast Asia.
Data that would permit more detailed comparisons
across countries are not available, so it is unclear how
India compares on key productivity measures and
major itemized costs. Given the dominant role of feed
costs in the total variable costs of poultry meat produc-
tion, it is likely that feed prices and feed use efficiency
are important factors in India’s apparent competitive-
ness. The two other relatively low-cost producers
among the countries compared, Brazil and the United
States, are, like India, large producers of soybeans and
corn. Significant local production of both corn and
soybean meal allow producers to benefit from rela-
tively low transport and handling costs, and to avoid
the costs of tariffs on imported feeds.
As the least developed among the countries
compared in tables D-1 and D-2, India also has the
least developed poultry sector, with a relatively small
share of production from operations that use the most
advanced technology. Indian poultry producers likely
benefit from lower labor costs but may also pay rela-
tively high real interest rates for operating and invest-
ment capital.
Table D-1—Broiler variable costs of production by
country
Country 1999 2000 2001
$/kg, liveweight
Argentina 0.93
Brazil0.59 0.47 0.38
Malaysia 0.74 0.72
Philippines 0.86 0.94
South Korea 0.91 0.85
Taiwan 1.03
Thailand 0.74 0.65 0.61
United States 0.54 0.56 0.56
India:
North 0.62
West 0.59
South 0.55
East 0.60
= Not available.
Sources: Foreign Agricultural Service, USDA, various attache
reports;
Poultry Yearbook,
Economic Research Service, USDA.
Table D-2—Broiler farm gate prices by country
Country 1999 2000 2001
$/kg, liveweight
Brazil0.44 0.50 0.48
Indonesia 0.94 0.79 0.74
Malaysia 0.83 0.83
Philippines 1.34 1.17 0.78
South Korea 1.02 1.05
Taiwan 1.18 1.08 1.03
Thailand 0.71 0.64 0.68
United States 0.82 0.76 0.87
India:
North 0.84
West 0.48
South 0.52
East 0.66
= Not available.
Sources: Foreign Agricultural Service, USDA, various attache
reports;
Poultry Yearbook,
Economic Research Service, USDA.
18 ◆ India’s Poultry Sector: Development and Prospects / WRS-04-03 Economic Research Service/USDA
Most poultry meat in India is marketed to consumers
in the form of live birds, with only a small share of
output now marketed as chilled, frozen, or further
processed products. The costs of moving live birds,
including transport, shrinkage, and mortality costs,
severely limit interregional movements. As a result,
Indian poultry markets are regional, rather than
national, in scope and there is limited potential for
low-cost producers to market their product in higher
cost regions. The limited information on costs and
market price behavior collected for this study suggests
that the presence of poultry integrators in a region has
a significant impact on the returns received by poultry
producers and the margins between producer and
consumer prices. For example, retail prices and
producer-retail margins were found to be significantly
higher in the northern region, where poultry integrators
are least active.
Live-Bird Preference
The Indian broiler sector operates almost completely as
a live-bird market, with poultry retailed as live birds and
slaughtered for customers in retail shops. This practice
is in accordance both with the lack of cold chain facili-
ties, which limits capacity to market chilled or frozen
products, and with consumer preference. Consumers
have more confidence in the quality of fresh poultry
meat that is slaughtered in their presence; frozen or
chilled meat may have problems that can only be
detected when it is thawed. Even when refrigeration is
available, consumers lack confidence in chilled or
frozen meat because of the unreliability of electrical
power. The preference for fresh meat also extends to the
belief that it is superior in taste and texture.
Poor sanitary conditions are common in India’s retail
poultry shops. In general, however, consumers and
merchants share a belief that there is minimal health
risk because the Indian style of cooking kills bacteria
that could otherwise lead to food poisoning or disease.
Most Indian meat preparations are well cooked, and
some locally used spices are reportedly effective in
killing foodborne bacteria. Aside from a recent
campaign to improve sanitary conditions in poultry
shops in New Delhi, there is no evidence that
consumers or public health officials are greatly
concerned with current practices. The move to license
and inspect poultry slaughter within Delhi appears to
have been motivated more by the urgings of the nascent
poultry processing industry than by any documented
public health concern associated with the quality of the
product or the disposal of slaughter waste.
The dominance of the live-bird market restricts the
movement of poultry because of the high transport,
mortality, and shrinkage costs associated with moving
live birds over India’s poor roads. In particular, the
live-bird preference severely limits movement of
poultry from low-cost producing areas, particularly in
southern and western India, to higher cost areas, such
as northern India. In a market where poultry
consumers are sensitive to price, this limitation can
slow the growth in both consumption and production
of poultry.
The consumer preference for live birds also restricts
the potential for poultry imports, since imports would
have to be frozen or chilled. Although there is some
demand for frozen or chilled poultry products by insti-
tutions (hotels, fast food restaurant chains) and, to a
lesser extent, high-end urban consumers, this small
segment of demand is currently met by the small
domestic processing sector.
Processed Poultry Demand
Processed poultry products, including chilled or frozen
poultry, as well as further processed items, currently
account for a small share of urban household
consumption and a negligible share of rural consump-
tion. Chilled whole birds and parts can be found in
markets and higher end shops in major cities and are
also consumed in institutional settings, including
restaurants and hotels. Frozen birds and parts are more
difficult to find at the retail level but can be found in
shops in major cities, and are also marketed by proces-
sors directly to hotels and restaurants. Frozen, further
processed items, such as heat-and-serve dishes, can be
found in high-end shops in the major cities.
It is difficult to determine the exact size of the chilled
bird market. The Ghazipur market near Delhi, the
largest poultry market in India, provides about 40
percent of the birds consumed in Delhi, and about 60
percent of those birds are dressed in a nearby facility.
Poultry Marketing and Prices