Tài liệu The Scope and Method of Economics pdf
Bạn đang xem bản rút gọn của tài liệu. Xem và tải ngay bản đầy đủ của tài liệu tại đây (18.38 MB, 464 trang )
PART
I
INTRODUCTION
TO
ECONOMICS
The Scope and
Method of Economics
The study of economics should
begin with a sense of wonder. Pause
for a moment and consider a typi-
cal day in your life. It might start
with a bagel made in a local bakery
with flour produced in Minnesota
from wheat grown in Kansas and
bacon from pigs raised in Ohio
packaged in plastic made in New
Jersey. You spill coffee from
Colombia on your shirt made in
Texas from textiles shipped from
South Carolina.
After class you drive with a
friend on an interstate highway
that is part of a system that took
20 years and billions of dollars to build. You stop for gasoline refined in Louisiana from Saudi
Arabian crude oil brought to the United States on a supertanker that took 3 years to build at a
shipyard in Maine.
Later you log onto the Web with a laptop computer assembled in Indonesia from parts
made in China and send an e-mail to your brother in Mexico City, and you call a buddy on a cell
phone made by a company in Finland. Your call is picked up by a microwave dish hidden in a
church steeple rented from the church by a cellular company that was just bought by a European
conglomerate.
You use or consume tens of thousands of things, both tangible and intangible, every day:
buildings, rock music, iPods, telephone services, staples, paper, toothpaste, tweezers, pizza, soap,
digital watches, fire protection, banks, electricity, eggs, insurance, football fields, computers,
buses, rugs, subways, health services, sidewalks, and so forth. Somebody made all these things.
Somebody organized men and women and materials to produce and distribute them. Thousands
of decisions went into their completion. Somehow they got to you.
In the United States, over 146 million people—almost half the total population—work at
hundreds of thousands of different jobs producing over $14 trillion worth of goods and services
every year. Some cannot find work; some choose not to work. Some are rich; others are poor.
The United States imports over $257 billion worth of automobiles and parts and about
$229 billion worth of petroleum and petroleum products each year; it exports around $62 billion
worth of agricultural products, including food. High-rise office buildings go up in central cities.
Condominiums and homes are built in the suburbs. In other places, homes are abandoned and
boarded up.
Some countries are wealthy. Others are impoverished. Some are growing. Some are not.
Some businesses are doing well. Others are going bankrupt.
At any moment in time, every society faces constraints imposed by nature and by previous
generations. Some societies are handsomely endowed by nature with fertile land, water, sunshine,
and natural resources. Others have deserts and few mineral resources. Some societies receive
much from previous generations—art, music, technical knowledge, beautiful buildings, and pro-
ductive factories. Others are left with overgrazed, eroded land, cities leveled by war, or polluted
natural environments. All societies face limits.
CHAPTER OUTLINE
Why Study
Economics? p. 2
To Learn a Way of
Thinking
To Understand Society
To Understand Global
Affairs
To Be an Informed Citizen
The Scope of
Economics p. 7
Microeconomics and
Macroeconomics
The Diverse Fields of
Economics
The Method of
Economics p. 10
Descriptive Economics and
Economic Theory
Theories and Models
Economic Policy
An Invitation p. 15
Appendix: How to
Read and Understand
Graphs p. 18
1
2 PART I Introduction to Economics
economics The
study
of
how individuals and societies
choose to use the scarce
resources that nature and
previous generations have
provided.
Economics is the study of how individuals and societies choose to use the scarce resources
that nature and previous generations have provided. The key word in this definition is
choose. Economics is a behavioral, or social, science. In large measure, it is the study of
how people make choices. The choices that people make, when added up, translate into
societal choices.
The purpose of this chapter and the next is to elaborate on this definition and to introduce
the subject matter of economics. What is produced? How is it produced? Who gets it? Why? Is the
result good or bad? Can it be improved?
Why Study Economics?
There are four main reasons to study economics: to learn a way of thinking, to understand soci-
ety, to understand global affairs, and to be an informed citizen.
To Learn a Way of Thinking
Probably the most important reason for studying economics is to learn a way of thinking.
Economics has three fundamental concepts that, once absorbed, can change the way you look at
everyday choices: opportunity cost, marginalism, and the working of efficient markets.
opportunity cost The
best alternative that we forgo,
or give up, when we make a
choice or a decision.
scarce
Limited.
Opportunity
Cost What happens in an economy is the outcome of thousands of individ-
ual decisions. People must decide how to divide their incomes among all the goods and services
available in the marketplace. They must decide whether to work, whether to go to school, and
how much to save. Businesses must decide what to produce, how much to produce, how much to
charge, and where to locate. It is not surprising that economic analysis focuses on the process of
decision making.
Nearly all decisions involve trade-offs. A key concept that recurs in analyzing the decision-
making process is the notion of opportunity cost. The full "cost" of making a specific choice
includes what we give up by not making the alternative choice. The best alternative that we forgo,
or give up, when we make a choice or a decision is called the opportunity cost of that decision.
When asked how much a movie costs, most people cite the ticket price. For an economist,
this is only part of the answer: to see a movie takes not only a ticket but also time. The opportu-
nity cost of going to a movie is the value of the other things you could have done with the same
money and time. If you decide to take time off from work, the opportunity cost of your leisure is
the pay that you would have earned had you worked. Part of the cost of a college education is the
income you could have earned by working full-time instead of going to school. If a firm pur-
chases a new piece of equipment for $3,000, it does so because it expects that equipment to gen-
erate more profit. There is an opportunity cost, however, because that $3,000 could have been
deposited in an interest-earning account. To a society, the opportunity cost of using resources to
launch astronauts on a space shuttle is the value of the private/civilian or other government
goods that could have been produced with the same resources.
Opportunity costs arise because resources are scarce. Scarce simply means limited. Consider
one of our most important resources—time. There are only 24 hours in a day, and we must live
our lives under this constraint. A farmer in rural Brazil must decide whether it is better to con-
tinue to farm or to go to the city and look for a job. A hockey player at the University of Vermont
must decide whether to play on the varsity team or spend more time studying.
marginalism The process
of analyzing the additional or
incremental costs or benefits
arising from a choice or
decision.
Marginalism A second key concept used in analyzing choices is the notion of
marginalism. In weighing the costs and benefits of a decision, it is important to weigh only the
costs and benefits that arise from the decision. Suppose, for example, that you live in New Orleans
and that you are weighing the costs and benefits of visiting your mother in Iowa. If business
required that you travel to Kansas City, the cost of visiting Mom would be only the additional, or
marginal, time and money cost of getting to Iowa from Kansas City.
CHAPTER 1 The Scope and Method of Economics 3
Consider the music business. To produce a typical CD, music labels spend approximately
$300,000 on recording the music and music video, developing marketing materials, and distrib-
uting the album. Once the label has made this investment, physically producing another copy of
the CD for sale typically costs about $2. When the music label is deciding whether to sign a new
artist and produce a CD, the $300,000 investment is important. Companies such as EMI and
Columbia Records spend a great deal of time thinking about whether a new CD by a newly dis-
covered artist will sell enough copies to make a profit. But once an artist is signed and the invest-
ment is made and the music label is trying to decide whether to manufacture the 100,001st copy
of a new CD, the key cost number is $2. Every new copy costs only $2, and as long as EMI can sell
that copy for more than $2, it is better off making the copy. The original investment made to cre-
ate the music is irrelevant—a sunk cost. Sunk costs are costs that cannot be avoided because
they have already been incurred.
Technically, we call the incremental cost of producing one more unit of a good or service the
marginal cost. One of the interesting changes in the music business is what has happened to the
marginal cost of producing another copy of a CD given the introduction of iTunes as an alterna-
tive to the physical CD. While it is not always easy to figure out what the marginal cost is (and we
will spend some time in this text honing your skills in this area), understanding the idea of mar-
ginalism when thinking about choices is critical.
There are numerous examples in which the concept of marginal cost is useful. For an air-
plane that is about to take off with empty seats, the marginal cost of an extra passenger is essen-
tially zero; the total cost of the trip is roughly unchanged by the addition of an extra passenger.
Thus, setting aside a few seats to be sold at big discounts through www.priceline.com or other
Web sites can be profitable even if the fare for those seats is far below the average cost per seat of
making the trip. As long as the airline succeeds in filling seats that would otherwise have been
empty, doing so is profitable.
sunk costs Costs
that
cannot be avoided because
they have already been
incurred.
Efficient
Markets—No
Free
Lunch
Suppose you are ready to check out of a busy
grocery store on the day before a storm and seven checkout registers are open with several
people in each line. Which line should you choose? Usually, the waiting time is approximately
the same no matter which register you choose (assuming you have more than 12 items). If one
line is much shorter than the others, people will quickly move into it until the lines are equal-
ized again.
As you will see later, the term profit in economics has a very precise meaning. Economists,
however, often loosely refer to "good deals" or risk-free ventures as profit opportunities. Using
the term loosely, a profit opportunity exists at the checkout lines when one line is shorter than
the others. In general, such profit opportunities are rare. At any time, many people are search-
ing for them; as a consequence, few exist. Markets like this, where any profit opportunities are
eliminated almost instantaneously, are said to be efficient markets. (We discuss markets, the
institutions through which buyers and sellers interact and engage in exchange, in detail in
Chapter 2.)
The common way of expressing the efficient markets concept is "there's no such thing as a
free lunch." How should you react when a stockbroker calls with a hot tip on the stock market?
With skepticism. Thousands of individuals each day are looking for hot tips in the market. If a
particular tip about a stock is valid, there will be an immediate rush to buy the stock, which will
quickly drive up its price. This view that very few profit opportunities exist can, of course, be
carried too far. There is a story about two people walking along, one an economist and one not.
The noneconomist sees a $20 bill on the sidewalk and says, "There's a $20 bill on the sidewalk."
The economist replies, "That is not possible. If there were, somebody would already have
picked it up."
There are clearly times when profit opportunities exist. Someone has to be first to get the
news, and some people have quicker insights than others. Nevertheless, news travels fast and
there are thousands of people with quick insights. The general view that large profit opportuni-
ties are rare is close to the mark.
efficient market A
market in which profit
opportunities are eliminated
almost instantaneously.
The study of economics teaches us a way of thinking and helps us make decisions.
4 PART I Introduction to Economics
To Understand Society
Industrial Revolution
The period in England during
the late eighteenth and early
nineteenth centuries in which
new manufacturing
technologies and improved
transportation gave rise to the
modern factory system and a
massive movement of the
population from the
countryside to the cities.
Another reason for studying economics is to understand society better. Past and present eco-
nomic decisions have an enormous influence on the character of life in a society. The current
state of the physical environment, the level of material well-being, and the nature and number of
jobs are all products of the economic system.
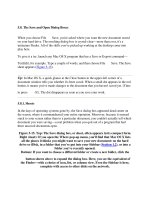
To get a sense of the ways in which economic decisions have shaped our environment, imag-
ine looking out a top-floor window of an office tower in any large city. The workday is about to
begin. All around you are other tall glass and steel buildings full of workers. In the distance, you
see the smoke of factories. Looking down, you see thousands of commuters pouring off trains
and buses and cars backed up on freeway exit ramps. You see trucks carrying goods from one
place to another. You also see the face of urban poverty: Just beyond the freeway is a large public
housing project and, beyond that, burned-out and boarded-up buildings.
What you see before you is the product of millions of economic decisions made over hundreds
of years. People at some point decided to spend time and money building those buildings and fac-
tories. Somebody cleared the land, laid the tracks, built the roads, and produced the cars and buses.
Economic decisions not only have shaped the physical environment but also have deter-
mined the character of society. At no time has the impact of economic change on a society been
more evident than in England during the late eighteenth and early nineteenth centuries, a
period that we now call the Industrial Revolution. Increases in the productivity of agricul-
ture, new manufacturing technologies, and development of more efficient forms of transporta-
tion led to a massive movement of the British population from the countryside to the city. At
the beginning of the eighteenth century, approximately 2 out of 3 people in Great Britain
worked in agriculture. By 1812, only 1 in 3 remained in agriculture; by 1900, the figure was
fewer than 1 in 10. People jammed into overcrowded cities and worked long hours in factories.
England had changed completely in two centuries—a period that in the run of history was
nothing more than the blink of an eye.
It is not surprising that the discipline of economics began to take shape during this period.
Social critics and philosophers looked around and knew that their philosophies must expand to
accommodate the changes. Adam Smith's Wealth of Nations appeared in 1776. It was followed by
the writings of David Ricardo, Karl Marx, Thomas Malthus, and others. Each tried to make sense
out of what was happening. Who was building the factories? Why? What determined the level of
wages paid to workers or the price of food? What would
happen
in the future, and what
should
happen? The people who asked these questions were the first economists.
Similar changes continue to affect the character of life in more recent times. In fact, many
argue that the late 1990s marked the beginning of a new Industrial Revolution. As we turned the
corner into the new millennium, the "e" revolution was clearly having an impact on virtually
every aspect of our lives: the way we buy and sell products, the way we get news, the way we plan
vacations, the way we communicate with each other, the way we teach and take classes, and on
and on. These changes have had and will clearly continue to have profound impacts on societies
across the globe, from Beijing to Calcutta to New York.
These changes have been driven by economics. Although the government was involved in the
early years of the World Wide Web, private firms that exist to make a profit (such as Facebook,
YouTube, Yahoo!, Microsoft, Google, Monster.com, Amazon.com, and E-Trade) created almost all
the new innovations and products. How does one make sense of all this? What will the effects of
these innovations be on the number of jobs, the character of those jobs, the family incomes, the
structure of our cities, and the political process both in the United States and in other countries?
During the last days of August 2005, Hurricane Katrina slammed into the coasts of Louisiana
and Mississippi, causing widespread devastation, killing thousands, and leaving hundreds of
thousands homeless. The economic impact of this catastrophic storm was huge. Thinking about
various markets involved helps frame the problem.
For example, the labor market was massively affected. By some estimates, over 400,000 jobs
were lost as the storm hit. Hotels, restaurants, small businesses, and oil refineries, to name just a
few, were destroyed. All the people who worked in those establishments instantaneously lost their
jobs and their incomes. The cleanup and rebuilding process took time to organize, and it eventu-
ally created a great deal of employment.
The storm created a major disruption in world oil markets. Loss of refinery capacity sent
gasoline prices up immediately, nearly 40 percent to over $4 per gallon in some locations. The
CHAPTER 1 The Scope and Method of Economics 5
price per gallon of crude oil rose to over $70 per barrel. Local governments found their tax bases
destroyed, with no resources to pay teachers and local officials. Hundreds of hospitals were
destroyed, and colleges and universities were forced to close their doors, causing tens of thou-
sands of students to change their plans.
While the horror of the storm hit all kinds of people, the worst hit were the very poor, who
could not get out of the way because they had no cars or other means of escape. The storm raised
fundamental issues of fairness, which we will be discussing for years to come.
The study of economics is an essential part of the study of society.
To Understand Global Affairs
A third reason for studying economics is to understand global affairs. News headlines are filled
with economic stories. International events often have enormous economic consequences. The
destruction of the World Trade Center towers in New York City in 2001 and the subsequent war
on terror in Afghanistan and elsewhere led to a huge decline in both tourism and business travel.
Several major airlines, including U.S. Airways and Swissair, went bankrupt. Hotel operators
worldwide suffered huge losses. The war in Iraq and a strike in Venezuela, a major oil exporter, in
2003 sent oil markets gyrating dramatically, initially increasing the cost of energy across the
globe. The rapid spread of HIV and AIDS across Africa will continue to have terrible economic
consequences for the continent and ultimately for the world.
Some claim that economic considerations dominate international relations. Certainly, politi-
cians place the economic well-being of their citizens near the top of their priority lists. It would be
surprising if that were not so. Thus, the economic consequences of things such as environmental
policy, free trade, and immigration play a huge role in international negotiations and policies.
Great Britain and the other countries of the European Union have struggled with the agreement
among most members to adopt a common currency, the euro. In 2005, France and the Netherlands
rejected a proposed European constitution that would have gone a long way toward a completely
open economy in Europe. The nations of the former Soviet Union are wrestling with a growing phe-
nomenon that clouds their efforts to "privatize" formerly state-owned industries: organized crime.
Another important issue in today's world is the widening gap between rich and poor nations.
In 2007, world population was over 6.5 billion. Of that number, over 2.4 billion lived in low-
income (less than $900 annually per capita) countries and just over 1 billion lived in high-income
(over $11,000 per capita per year) countries. The 37 percent of the world's population that lives
in the low-income countries receives less than 3.3 percent of the world's income. In dozens of
countries, per capita income is only a few hundred dollars a year. The 15 percent of the popula-
tion in high-income countries earn 75 percent of the world's income.
An understanding of economics is essential to an understanding of global affairs.
To Be an Informed Citizen
A knowledge of economics is essential to being an informed citizen. During the last 35 years, the
U.S. economy has been on a roller coaster. In 1973-1974, the Organization of Petroleum
Exporting Countries (OPEC) succeeded in raising the price of crude oil by 400 percent.
Simultaneously, a sequence of events in the world food market drove food prices up by 25 per-
cent. By mid-1974, prices in the United States were rising across the board at a very rapid rate.
Partially as a result of government policy to fight runaway inflation, the economy went into a
recession in 1975. (An inflation is an increase in the overall price level in the economy; a recession
is a period of decreasing output and rising unemployment.) The recession succeeded in slowing
price increases, but in the process, millions found themselves unemployed.
From 1979 through 1983, it happened all over again. Prices rose rapidly, the government
reacted with more policies designed to stop prices from rising, and the United States ended up
with an even worse recession in 1982. By the end of that year, 10.8 percent of the work force was
unemployed. Then, in mid-1990—after almost 8 years of strong economic performance—the
6 PART I Introduction to Economics
iPod and the World
It is impossible to understand the workings of
an economy without first understanding the
ways in which economies are connected across
borders. The United States was importing
goods and services at a rate of over $2 trillion
per year in 2007 and was exporting at a rate of
over $1.5 trillion per year.
For literally hundreds of years, the virtues of
free trade have been the subject of heated
debate. Opponents have argued that buying
foreign-produced goods costs Americans jobs and hurts American producers. Proponents
argue that there are gains from trade—that all countries can gain from specializing in the pro-
duction of the goods and services that they produce best.
But in today's global economy, it is often unclear what is an import and what is an export.
Consider the following column in The New York Times in 2007:
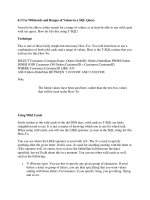
An iPod Has Global Value. Ask the (Many) Countries That Make It.
The New York Times
Who makes the Apple iPod? Here's a hint: It is not Apple. The company outsources the
entire manufacture of the device to a number of Asian enterprises, among them
Asustek, Inventec Appliances, and Foxconn.
But this list of companies isn't a satisfactory answer either: They only do final assem-
bly. What about the 451 parts that go into the iPod? Where are they made and by whom?
Three researchers at the University of California, Irvine—Greg Linden, Kenneth L.
Kraemer, and Jason Dedrick—applied some investigative cost accounting to this question,
using a report from Portelligent Inc. that examined all the parts that went into the iPod.
Their study, sponsored by the Sloan Foundation, offers a fascinating illustration of
the complexity of the global economy, and how difficult it is to understand that com-
plexity by using only conventional trade statistics.
The retail value of the 30-gigabyte video iPod that the authors examined was
$299. The most expensive component in it was the hard drive, which was manufac-
tured by Toshiba and costs about $73. The next most costly components were the
display module (about $20), the video/multimedia processor chip ($8), and the
controller chip ($5). They estimated that the final assembly, done in China, cost
only about $4 a unit.
The researchers estimated that $163 of the iPod's $299 retail value in the United
States was captured by American companies and workers, breaking it down to $75 for
distribution and retail costs, $80 to Apple, and $8 to various domestic component
makers. Japan contributed about $26 to the value added (mostly via the Toshiba disk
drive), while Korea contributed less than $1.
The real value of the iPod doesn't lie in its parts or even in putting those parts
together. The bulk of the iPod's value is in the conception and design of the iPod. That
is why Apple gets $80 for each of these video iPods it sells, which is by far the largest
piece of value added in the entire supply chain.
Those clever folks at Apple figured out how to combine 451 mostly generic parts
into a valuable product. They may not make the iPod, but they created it. In the end,
that's what really matters.
Source: HalR. Varian, Published: June 28, 2007, The New York Times, reprinted with permission.
CHAPTER 1 The Scope and Method of Economics 7
U.S. economy went into another recession. During the third and fourth quarters of 1990 and the
first quarter of 1991, gross domestic product (GDP, a measure of the total output of the U.S. econ-
omy) fell and unemployment again increased sharply. The election of Bill Clinton late in 1992
was no doubt in part influenced by the so-called "jobless recovery."
From the second quarter of 1991 through the early part of the new millennium, the U.S.
economy experienced the longest expansion in its history. More than 24 million new jobs were
created, pushing unemployment below 4 percent by the year 2000. The stock market boomed to
historic levels, and the biggest worry facing the American economy was that things were too good!
The presidential election of 2000 was close, to say the least, with the outcome not known
until early December. In mid-December, President-elect George W. Bush and his economic advis-
ers began to worry about the possibility of a recession occurring in 2001. The stock market was
below its highs for the year, corporate profits were not coming in as well as expected, and there
were some signs that demand for goods was slowing.
Indeed, following the election, the economy slipped into a recession and economic conditions
were made worse by the September 11, 2001, attacks on the World Trade Center and on the
Pentagon. The stock market, which suffered losses as early as 2000, fell for 3 consecutive years,
reducing people's wealth by trillions of dollars. Total employment dropped by nearly 2.7 million.
But by 2002, the economy began to grow again, slowly, and by 2005, nearly 3.5 million jobs had
been created.
The war in Iraq and the threat of international terrorism following the 9/11 attacks increased
military expenditures in the United States substantially. At the same time, tax cuts proposed by
President Bush and passed by Congress led to large deficits in the federal budget.
The housing market began to boom in 2001. Fueled by lower interest rates that made bor-
rowing less expensive, foreign demand, and a highly competitive mortgage market that made
mortgage credit available to virtually any applicant, house prices rose substantially around the
country. Housing starts, the number of new housing units begun each period, rose steadily to a
record high by 2005 of over 2 million annually. Sales of existing homes at the same time rose
above 7 million per year. In addition, as house values rose, home owners had higher wealth and
increased their spending. Much spending was driven by borrowing against the house. When you
add all the services surrounding house sales, the huge spending on new units, and the purchases
at stores such as Home Depot that go with new house sales, the economy was strongly stimulated
by the housing market until the middle of 2006, when housing began to slow.
One of the key factors that fueled the housing boom was the expansion of mortgage credit to
borrowers who in earlier years would have not have qualified. Some borrowers had bad credit
histories, low incomes, or other substantial debts. These mortgages came to be called subprime
loans. In addition, mortgage loans that carried low monthly payments for a few years that were
later followed by substantially higher payments became prevalent.
In the summer of 2007, the housing market stalled, prices began to fall, and the huge amount of
mortgage debt outstanding (over $10 trillion by 2007) experienced rising delinquency and default.
Losses were huge and sent financial markets, including the stock market, into a sharp decline. The
question at the start of 2008 was whether the sharp slowdown of the housing market combined with
the problems of the credit markets would lead the economy as a whole into a recession.
To be an informed citizen requires a basic understanding of economics.
The Scope of Economics
Most students taking economics for the first time are surprised by the breadth of what they study.
Some think that economics will teach them about the stock market or what to do with their
money. Others think that economics deals exclusively with problems such as inflation and unem-
ployment. In fact, it deals with all those subjects, but they are pieces of a much larger puzzle.
Economics has deep roots in and close ties to social philosophy. An issue of great importance
to philosophers, for example, is distributional justice. Why are some people rich and others poor?
And whatever the answer, is this fair? A number of nineteenth-century social philosophers wres-
ded with these questions, and out of their musings, economics as a separate discipline was born.
8 PART I Introduction to Economics
The easiest way to get a feel for the breadth and depth of what you will be studying is to
explore briefly the way economics is organized. First of all, there are two major divisions of eco-
nomics: microeconomics and macroeconomics.
microeconomics The
branch of economics that
examines the functioning of
individual industries and the
behavior of individual decision-
making units—that is, firms
and households.
macroeconomics The
branch of economics that
examines the economic
behavior of aggregates-
income, employment, output,
and so on—on a national scale.
Microeconomics and Macroeconomics
Microeconomics deals with the functioning of individual industries and the behavior of indi-
vidual economic decision-making units: firms and households. Firms' choices about what to pro-
duce and how much to charge and households' choices about what and how much to buy help to
explain why the economy produces the goods and services it does.
Another big question addressed by microeconomics is who gets the goods and services that
are produced. Wealthy households get more than poor households, and the forces that determine
this distribution of output are the province of microeconomics. Why does poverty exist? Who is
poor? Why do some jobs pay more than others?
Think again about what you consume in a day and then think back to that view over a big city.
Somebody decided to build those factories. Somebody decided to construct the roads, build the hous-
ing, produce the cars, and smoke the bacon. Why? What is going on in all those buildings? It is easy to
see that understanding individual microdecisions is very important to any understanding of society.
Macroeconomics looks at the economy as a whole. Instead of trying to understand what
determines the output of a single firm or industry or what the consumption patterns are of a sin-
gle household or group of households, macroeconomics examines the factors that determine
national output, or national product. Microeconomics is concerned with household income;
macroeconomics deals with national income.
Whereas microeconomics focuses on individual product prices and relative prices, macro-
economics looks at the overall price level and how quickly (or slowly) it is rising (or falling).
Microeconomics questions how many people will be hired (or fired) this year in a particular
industry or in a certain geographic area and focuses on the factors that determine how much
labor a firm or an industry will hire. Macroeconomics deals with aggregate employment and
unemployment: how many jobs exist in the economy as a whole and how many people who are
willing to work are not able to find work.
To summarize:
Microeconomics looks at the individual unit—the household, the firm, the industry. It sees
and examines the "trees." Macroeconomics looks at the whole, the aggregate. It sees and
analyzes the "forest."
Table 1.1 summarizes these divisions of economics and some of the subjects with which they
are concerned.
CHAPTER 1 The Scope and Method of Economics 9
The Diverse Fields of Economics
Individual economists focus their research and study in many diverse areas. Many of these specialized
fields are reflected in the advanced courses offered at most colleges and universities. Some are con-
cerned with economic history or the history of economic thought. Others focus on international eco-
nomics or growth in less developed countries. Still others study the economics of cities (urban
economics) or the relationship between economics and law. These fields are summarized in Table 1.2.
Economists also differ in the emphasis they place on theory. Some economists specialize in
developing new theories, whereas other economists spend their time testing the theories of oth-
ers. Some economists hope to expand the frontiers of knowledge, whereas other economists are
more interested in applying what is already known to the formulation of public policies.
10 PART I Introduction to Economics
positive economics An
approach to economics that
seeks to understand behavior
and the operation of systems
without making judgments. It
describes what exists and how
it works.
normative economics
An approach to economics
that analyzes outcomes of
economic behavior, evaluates
them as good or bad, and may
prescribe courses of action.
Also called policy economics.
descriptive
economics The
compilation of data that
describe phenomena and facts.
economic theory A
statement or set of related
statements about cause and
effect, action and reaction.
As you begin your study of economics, look through your school's course catalog and talk to
the faculty about their interests. You will discover that economics encompasses a broad range of
inquiry and is linked to many other disciplines.
Economics asks and attempts to answer two kinds of questions: positive and normative. Positive
economics attempts to understand behavior and the operation of economic systems without
making judgments about whether the outcomes are good or bad. It strives to describe what exists
and how it works. What determines the wage rate for unskilled workers? What would happen if
we abolished the corporate income tax? The answers to such questions are the subject of positive
economics.
In contrast, normative economics looks at the outcomes of economic behavior and
asks whether they are good or bad and whether they can be made better. Normative econom-
ics involves judgments and prescriptions for courses of action. Should the government subsi-
dize or regulate the cost of higher education? Should medical benefits to the elderly under
Medicare be available only to those with incomes below some threshold? Should the United
States allow importers to sell foreign-produced goods that compete with U.S produced prod-
ucts? Should we reduce or eliminate inheritance taxes? Normative economics is often called
policy economics.
Of course, most normative questions involve positive questions. To know whether the gov-
ernment should take a particular action, we must know first if it can and second what the conse-
quences are likely to be. (For example, if we lower import fees, will there be more competition
and lower prices?)
Some claim that positive, value-free economic analysis is impossible. They argue that ana-
lysts come to problems with biases that cannot help but influence their work. Furthermore, even
in choosing what questions to ask or what problems to analyze, economists are influenced by
political, ideological, and moral views.
Although this argument has some merit, it is nevertheless important to distinguish between
analyses that attempt to be positive and those that are intentionally and explicitly normative.
Economists who ask explicitly normative questions should be forced to specify their grounds for
judging one outcome superior to another.
Positive economics is often divided into descriptive economics and economic theory.
Descriptive economics is simply the compilation of data that describe phenomena and facts.
Examples of such data appear in the Statistical Abstract of the United States, a large volume of data
published by the Department of Commerce every year that describes many features of the U.S.
economy. Massive volumes of data can now be found on the World Wide Web. As an example,
look at www.bls.gov (Bureau of Labor Statistics).
Where do all these data come from? The Census Bureau collects an enormous amount of raw
data every year, as do the Bureau of Labor Statistics, the Bureau of Economic Analysis, and non-
government agencies such as the University of Michigan Survey Research Center. One important
study now published annually is the Survey of Consumer Expenditure, which asks individuals to
keep careful records of all their expenditures over a long period of time. Another is the National
Longitudinal Survey of Labor Force Behavior, conducted over many years by the Center for
Human Resource Development at The Ohio State University.
Economic theory attempts to generalize about data and interpret them. An economic
theory is a statement or set of related statements about cause and effect, action and reaction. One
of the first theories you will encounter in this text is the law of demand, which was most clearly
stated by Alfred Marshall in 1890: When the price of a product rises, people tend to buy less of it;
when the price of a product falls, people tend to buy more.
Theories do not always arise out of formal numerical data. All of us have been collecting
observations of people's behavior and their responses to economic stimuli for most of our
The Method of Economics
Descriptive Economics and Economic Theory
CHAPTER 1 The Scope and Method of Economics 11
lives. We may have observed our parents' reaction to a sudden increase—or decrease—in
income or to the loss of a job or the acquisition of a new one. We all have seen people standing
in line waiting for a bargain. Of course, our own actions and reactions are another important
source of data.
Theories and Models
In many disciplines, including physics, chemistry, meteorology, political science, and economics,
theorists build formal models of behavior. A model is a formal statement of a theory. It is usually
a mathematical statement of a presumed relationship between two or more variables.
A variable is a measure that can change from time to time or from observation to observa-
tion. Income is a variable—it has different values for different people and different values for the
same person at different times. The rental price of a movie on a DVD is a variable; it has different
values at different stores and at different times. There are countless other examples.
Because all models simplify reality by stripping part of it away, they are abstractions. Critics
of economics often point to abstraction as a weakness. Most economists, however, see abstraction
as a real strength.
The easiest way to see how abstraction can be helpful is to think of a map. A map is a repre-
sentation of reality that is simplified and abstract. A city or state appears on a piece of paper as a
series of lines and colors. The amount of reality that the mapmaker can strip away before the map
loses something essential depends on what the map will be used for. If you want to drive from
St. Louis to Phoenix, you need to know only the major interstate highways and roads. You lose
absolutely nothing and gain clarity by cutting out the local streets and roads. However, if you
need to get around Phoenix, you may need to see every street and alley.
Most maps are two-dimensional representations of a three-dimensional world; they show
where roads and highways go but do not show hills and valleys along the way. Trail maps for
hikers, however, have "contour lines" that represent changes in elevation. When you are in a car,
changes in elevation matter very little; they would make a map needlessly complex and more
difficult to read. However, if you are on foot carrying a 50-pound pack, a knowledge of eleva-
tion is crucial.
Like maps, economic models are abstractions that strip away detail to expose only those
aspects of behavior that are important to the question being asked. The principle that irrelevant
detail should be cut away is called the principle of Ockham's razor after the fourteenth-century
philosopher William of Ockham.
Be careful—although abstraction is a powerful tool for exposing and analyzing specific
aspects of behavior, it is possible to oversimplify. Economic models often strip away a good deal
of social and political reality to get at underlying concepts. When an economic theory is used to
help formulate actual government or institutional policy, political and social reality must often be
reintroduced if the policy is to have a chance of working.
The key here is that the appropriate amount of simplification and abstraction depends on
the use to which the model will be put. To return to the map example: you do not want to walk
around San Francisco with a map made for drivers—there are too many very steep hills.
All
Else
Equal:
Ceteris
Paribus
It is usually
true
that whatever you want to explain with a
model depends on more than one factor. Suppose, for example, that you want to explain the total
number of miles driven by automobile owners in the United States. The number of miles driven
will change from year to year or month to month; it is a variable. The issue, if we want to under-
stand and explain changes that occur, is what factors cause those changes.
Obviously, many things might affect total miles driven. First, more or fewer people may be
driving. This number, in turn, can be affected by changes in the driving age, by population
growth, or by changes in state laws. Other factors might include the price of gasoline, the house-
hold's income, the number and age of children in the household, the distance from home to
work, the location of shopping facilities, and the availability and quality of public transport.
When any of these variables change, the members of the household may drive more or less. If
changes in any of these variables affect large numbers of households across the country, the total
number of miles driven will change.
model A formal statement
of a theory, usually a
mathematical statement of a
presumed relationship between
two or more variables.
variable
A measure
that
can change from time to time
or from observation to
observation.
Ockham's razor The
principle that irrelevant detail
should be cut away.
12 PART I Introduction to Economics
ceteris paribus, or all else
equal A device
used
to
analyze the relationship
between two variables while
the values of other variables
are held unchanged.
Very often we need to isolate or separate these effects. For example, suppose we want to know
the impact on driving of a higher tax on gasoline. This change would raise the price of gasoline at
the pump but would not (at least in the short run) affect income, workplace location, number of
children, and so on.
To isolate the impact of one single factor, we use the device of ceteris paribus, or all else
equal. We ask: What is the impact of a change in gasoline price on driving behavior, ceteris
paribus, or assuming that nothing else changes? If gasoline prices rise by 10 percent, how much
less driving will there be, assuming no simultaneous change in anything else—that is, assuming
that income, number of children, population, laws, and so on, all remain constant? Using the
device of ceteris paribus is one part of the process of abstraction. In formulating economic theory,
the concept helps us simplify reality to focus on the relationships that interest us.
Expressing Models in
Words,
Graphs, and Equations Consider the following
statements: Lower airline ticket prices cause people to fly more frequently. Higher interest rates
slow the rate of home sales. When firms produce more output, employment increases. Higher
gasoline prices cause people to drive less and to buy more fuel-efficient cars.
Each of those statements expresses a relationship between two variables that can be quanti-
fied. In each case, there is a stimulus and a response, a cause and an effect. Quantitative relation-
ships can be expressed in a variety of ways. Sometimes words are sufficient to express the essence
of a theory, but often it is necessary to be more specific about the nature of a relationship or
about the size of a response. The most common method of expressing the quantitative relation-
ship between two variables is graphing that relationship on a two-dimensional plane. In fact, we
will use graphic analysis extensively in Chapter 2 and beyond. Because it is essential that you be
familiar with the basics of graphing, the Appendix to this chapter presents a careful review of
graphing techniques.
Quantitative relationships between variables can also be presented through equations. For
example, suppose we discovered that over time, U.S. households collectively spend, or consume,
90 percent of their income and save 10 percent of their income. We could then write:
C = .90 Y and S =
.10Y
post hoc, ergo propter hoc
Literally, "after this (in time),
therefore because of this." A
common error made in
thinking about causation If
Event A happens before
Event B, it is not necessarily
true that A caused B.
where C is consumption spending, Y is income, and S is saving. Writing explicit algebraic
expressions like these helps us understand the nature of the underlying process of decision
making. Understanding this process is what economics is all about.
Cautions and Pitfalls In formulating theories and models, it is especially important to
avoid two pitfalls: the post hoc fallacy and the fallacy of composition.
The Post Hoc Fallacy Theories often make statements or sets of statements about cause and
effect. It can be quite tempting to look at two events that happen in sequence and assume that the
first caused the second to happen. This is not always the case. This common error is called the post
hoc, ergo propter hoc (or "after this, therefore because of this") fallacy.
There are thousands of examples. The Colorado Rockies have won seven games in a row. Last
night you went to the game and they lost. You must have jinxed them. They lost because you went to
the game.
Stock market analysts indulge in what is perhaps the most striking example of the post hoc
fallacy in action. Every day the stock market goes up or down, and every day some analyst on
some national news program singles out one or two of the day's events as the cause of some
change in the market: "Today the Dow Jones industrial average rose 5 points on heavy trading;
analysts say that the increase was due to progress in talks between Israel and Syria." Research has
shown that daily changes in stock market averages are very largely random. Although major news
events clearly have a direct influence on certain stock prices, most daily changes cannot be linked
directly to specific news stories.
Very closely related to the post hoc fallacy is the often erroneous link between correlation
and causation. Two variables are said to be correlated if one variable changes when the other
variable changes. However, correlation does not imply causation. Cities that have high crime
rates also have many automobiles, so there is a very high degree of correlation between number
CHAPTER 1 The Scope and Method of Economics 13
of cars and crime rates. Can we argue, then, that cars cause crime? No. The reason for the cor-
relation may have nothing to do with cause and effect. Big cities have many people, many peo-
ple have many cars; therefore, big cities have many cars. Big cities also have high crime rates
for many reasons—crowding, poverty, anonymity, unequal distribution of wealth, and readily
available drugs, to mention only a few. However, the presence of cars is probably not one
of them.
This caution must also be viewed in reverse. Sometimes events that seem entirely uncon-
nected actually are connected. In 1978, Governor Michael Dukakis of Massachusetts ran for
reelection. Still quite popular, Dukakis was nevertheless defeated in the Democratic primary that
year by a razor-thin margin. The weekend before, the Boston Red Sox, in the thick of the division
championship race, had been badly beaten by the New York Yankees in four straight games. Some
very respectable political analysts believe that hundreds of thousands of Boston sports fans
vented their anger on the incumbent governor the following Tuesday.
The Fallacy of Composition To conclude that what is true for a part is necessarily true for
the whole is to fall into the fallacy of composition. Suppose that a large group of cattle ranch-
ers graze their cattle on the same range. To an individual rancher, more cattle and more grazing
mean a higher income. However, because its capacity is limited, the land can support only so
many cattle. If every cattle rancher increased the number of cattle sent out to graze, the land
would become overgrazed and barren; as a result, everyone's income would fall. In short, theories
that seem to work well when applied to individuals or households often break down when they
are applied to the whole.
Testing Theories and Models:
Empirical
Economics In
science,
a theory is
rejected when it fails to explain what is observed or when another theory better explains what is
observed. Prior to the sixteenth century, almost everyone believed that Earth was the center of
the universe and that the sun and stars rotated around it. The astronomer Ptolemy (A.D. 127 to
151) built a model that explained and predicted the movements of the heavenly bodies in a geo-
centric (Earth-centered) universe. Early in the sixteenth century, however, the Polish astronomer
Nicholas Copernicus found himself dissatisfied with the Ptolemaic model and proposed an
alternative theory or model, placing the sun at the center of the known universe and relegating
Earth to the status of one planet among many. The battle between the competing models was
waged, at least in part, with data based on observations—actual measurements of planetary
movements. The new model ultimately predicted much better than the old, and in time it came
to be accepted.
In the seventeenth century, building on the works of Copernicus and others, Sir Isaac Newton
constructed yet another body of theory that seemed to predict planetary motion with still more
accuracy. Newtonian physics became the accepted body of theory, relied on for almost 300 years.
Then, in the early twentieth century, Albert Einstein's theory of relativity replaced Newtonian
physics for particular types of problems because it was able to explain some problems that earlier
theories could not.
Economic theories are also confronted with new and often conflicting data from time to
time. The collection and use of data to test economic theories is called empirical economics.
Numerous large data sets are available to facilitate economic research. For example, econo-
mists studying the labor market can now test behavioral theories against the actual working expe-
riences of thousands of randomly selected people who have been surveyed continuously since the
1960s by economists at The Ohio State University. Macroeconomists continuously monitoring
and studying the behavior of the national economy pass thousands of items of data, collected by
both government agencies and private companies, back and forth over the Internet.
Scientific research often seeks to isolate and measure the responsiveness of one variable to a
change in another variable, ceteris paribus. Physical scientists such as physicists and geologists
can often impose the condition of ceteris paribus by conducting controlled experiments. They
can, for example, measure the effect of one chemical on another while literally holding all else
constant in an environment that they control completely. Social scientists, who study people,
rarely have this luxury.
Although controlled experiments are difficult in economics and other social sciences, they
are not impossible. During recent presidential and congressional elections, many candidates
fallacy of composition
The erroneous belief that what
is true for a part is necessarily
true for the whole.
empirical economics
The collection and use of data
to test economic theories.
14 PART I Introduction to Economics
efficiency In economics,
allocative efficiency. An
efficient economy is one that
produces what people want at
the least possible cost.
pointed to dramatic declines in crime rates in most American cities. Of course, incumbent can-
didates took credit, claiming that the decline was due to their policies. In fact, careful analysis
shows that the decline in crime was largely due to two factors essentially beyond the control of
political leaders: fewer people in the age groups that tend to commit crimes and a very strong
economy with low unemployment. How do researchers know this? They look at data over time
on crimes committed by people of various ages, they look at crime rates across states with differ-
ent economic conditions, and they look at the pattern of crime rates nationally over time under
different economic conditions. Even though economists cannot generally do controlled experi-
ments, fluctuations in economic conditions and factors such as birthrate patterns in a way set up
natural experiments.
Economic Policy
Economic theory helps us understand how the world works, but the formulation of economic
policy requires a second step. We must have objectives. What do we want to change? Why? What is
good and what is bad about the way the system is operating? Can we make it better?
Such questions force us to be specific about the grounds for judging one outcome superior to
another. What does it mean to be better? Four criteria are frequently applied in judging economic
outcomes:
1. Efficiency
2. Equity
3. Growth
4. Stability
Efficiency In
physics,
"efficiency"
refers to the ratio of useful energy delivered by a system to
the energy supplied to it. An efficient automobile engine, for example, is one that uses a small
amount of fuel per mile for a given level of power.
In
economics,
efficiency
means
allocative efficiency.
An efficient economy is one that pro-
duces what people want at the least possible cost. If the system allocates resources to the produc-
tion of goods and services that nobody wants, it is inefficient. If all members of a particular
society were vegetarians and somehow half of all that society's resources were used to produce
meat, the result would be inefficient. It is inefficient when steel beams lie in the rain and rust
because somebody fouled up a shipping schedule. If a firm could produce its product using
25 percent less labor and energy without sacrificing quality, it too is inefficient.
The clearest example of an efficient change is a voluntary exchange. If you and I each want
something that the other has and we agree to exchange, we are both better off and no one loses.
When a company reorganizes its production or adopts a new technology that enables it to pro-
duce more of its product with fewer resources, without sacrificing quality, it has made an effi-
cient change. At least potentially, the resources saved could be used to produce more of
something.
Inefficiencies can arise in numerous ways. Sometimes they are caused by government regula-
tions or tax laws that distort otherwise sound economic decisions. Suppose that land in Ohio is
best suited for corn production and that land in Kansas is best suited for wheat production. A law
that requires Kansas to produce only corn and Ohio to produce only wheat would be inefficient.
If firms that cause environmental damage are not held accountable for their actions, the incentive
to minimize those damages is lost and the result is inefficient.
Equity
While
efficiency
has a fairly precise definition that can be applied with some degree
of
rigor, equity (fairness) lies in the eye of the beholder. To many, fairness implies a more equal dis-
tribution of income and wealth. Fairness may imply alleviating poverty, but the extent to which
the poor should receive cash benefits from the government is the subject of enormous disagree-
ment. For thousands of years, philosophers have wrestled with the principles of justice that
should guide social decisions. They will probably wrestle with such questions for thousands of
years to come.
Despite the impossibility of defining equity or fairness universally, public policy makers
judge the fairness of economic outcomes all the time. Rent control laws were passed because
equity Fairness.
CHAPTER 1 The Scope and Method of Economics 15
some legislators thought that landlords treated low-income tenants unfairly. Certainly, most
social welfare programs are created in the name of equity.
Growth
As the result of technological change, the building of machinery, and the acqui-
sition of knowledge, societies learn to produce new goods and services and to produce old
ones better. In the early days of the U.S. economy, it took nearly half the population to pro-
duce the required food supply. Today less than 2.5 percent of the country's population works
in agriculture.
When we devise new and better ways of producing the goods and services we use now and
when we develop new goods and services, the total amount of production in the economy
increases. Economic growth is an increase in the total output of an economy. If output
grows faster than the population, output per capita rises and standards of living increase.
Presumably, when an economy grows, it produces more of what people want. Rural and agrar-
ian societies become modern industrial societies as a result of economic growth and rising per
capita output.
Some policies discourage economic growth, and others encourage it. Tax laws, for exam-
ple, can be designed to encourage the development and application of new production tech-
niques. Research and development in some societies are subsidized by the government.
Building roads, highways, bridges, and transport systems in developing countries may speed
up the process of economic growth. If businesses and wealthy people invest their wealth out-
side their country rather than in their country's industries, growth in their home country
may be slowed.
Stability Economic stability refers to the condition in which national
output
is growing
steadily, with low inflation and full employment of resources. During the 1950s and 1960s, the
U.S. economy experienced a long period of relatively steady growth, stable prices, and low unem-
ployment. Between 1951 and 1969, consumer prices never rose more than 5 percent in a single
year and in only 2 years did the number of unemployed exceed 6 percent of the labor force. From
the end of the Gulf War in 1991 to the beginning of 2001, the U.S. economy enjoyed price stabil-
ity and strong economic growth with rising employment. It was the longest expansion in
American history.
The decades of the 1970s and 1980s, however, were not as stable. The United States experi-
enced two periods of rapid price inflation (over 10 percent) and two periods of severe unem-
ployment. In 1982, for example, 12 million people (10.8 percent of the workforce) were looking
for work. The beginning of the 1990s was another period of instability, with a recession occur-
ring in 1990-1991. Around the world, economic fluctuations have been severe in recent years.
During the late 1990s, many economies in Asia fell into recessions with falling incomes and ris-
ing unemployment. The transition economies of Eastern Europe and the former Soviet Union
have experienced periods of decline as well as periods of rapidly rising prices since the fall of the
Berlin Wall in 1989.
The causes of instability and the ways in which governments have attempted to stabilize the
economy are the subject matter of macroeconomics.
economic growth An
increase in the total output of
an economy.
stability A condition in
which national output is
growing steadily, with low
inflation and full employment
of resources.
An Invitation
This chapter has prepared you for your study of economics. The first part of the chapter invited
you into an exciting discipline that deals with important issues and questions. You cannot begin
to understand how a society functions without knowing something about its economic history
and its economic system.
The second part of the chapter introduced the method of reasoning that economics requires
and some of the tools that economics uses. We believe that learning to think in this very powerful
way will help you better understand the world.
As you proceed, it is important that you keep track of what you have learned in earlier chap-
ters. This book has a plan; it proceeds step-by-step, each section building on the last. It would be
a good idea to read each chapter's table of contents at the start of each chapter and scan each
chapter before you read it to make sure you understand where it fits in the big picture.
16 PART I Introduction to Economics
SUMMARY
1. Economics is the study of how individuals and societies
choose to use the scarce resources that nature and previous
generations have provided.
WHY STUDY ECONOMICS? p. 2
2. There are many reasons to study economics, including (a) to
learn a way of thinking, (b) to understand society, (c) to
understand global affairs, and (d) to be an informed citizen.
3. The best alternative that we forgo when we make a choice or
a decision is the opportunity cost of that decision.
THE SCOPE OF ECONOMICS p. 7
4. Microeconomics deals with the functioning of individual
markets and industries and with the behavior of individual
decision-making units: business firms and households.
5. Macroeconomics looks at the economy as a whole. It deals
with the economic behavior of aggregates—national output,
national income, the overall price level, and the general rate
of inflation.
6. Economics is a broad and diverse discipline with many spe-
cial fields of inquiry. These include economic history, inter-
national economics, and urban economics.
THE METHOD OF ECONOMICS p. 10
7. Economics asks and attempts to answer two kinds of ques-
tions: positive and normative. Positive economics attempts
to understand behavior and the operation of economies
without making judgments about whether the outcomes
are good or bad. Normative economics looks at the results of
economic behavior and asks whether they are good or bad
and whether they can be improved.
8. Positive economics is often divided into two parts.
Descriptive economics involves the compilation of data that
accurately describe economic facts and events. Economic
theory attempts to generalize and explain what is observed.
It involves statements of cause and effect—of action and
reaction.
9. An economic model is a formal statement of an economic
theory. Models simplify and abstract from reality.
10. It is often useful to isolate the effects of one variable on
another while holding "all else constant." This is the device of
ceteris paribus.
11. Models and theories can be expressed in many ways. The
most common ways are in words, in graphs, and in equations.
12. Because one event happens before another, the second event
does not necessarily happen as a result of the first. To assume
that "after" implies "because" is to commit the fallacy of post
hoc, ergo propter hoc. The erroneous belief that what is true
for a part is necessarily true for the whole is the fallacy of
composition.
13. Empirical economics involves the collection and use of data to
test economic theories. In principle, the best model is the
one that yields the most accurate predictions.
14. To make policy, one must be careful to specify criteria for
making judgments. Four specific criteria are used most often
in economics: efficiency, equity, growth, and stability.
REVIEW TERMS AND CONCEPTS
ceteris paribus, or all else equal, p. 12
descriptive economics, p. 10
economic growth, p. 15
economic theory, p. 10
economics, p. 2
efficiency, p. 14
efficient market, p. 3
empirical economics, p. 13
equity, p. 14
fallacy of composition, p. 13
Industrial Revolution, p. 4
macroeconomics, p. 8
marginalism, p. 2
microeconomics, p. 8
model, p. 11
normative economics, p. 10
Ockham's razor, p. 11
opportunity cost, p. 2
positive economics, p. 10
post hoc, ergo propter hoc, p. 12
scarce, p. 2
stability, p. 15
sunk costs, p. 3
variable, p. 11
CHAPTER 1 The Scope and Method of Economics 17
Visit www myeconlab.com to complete the problems marked in orange online. You will receive
instant feedback on your answers, tutorial help, and access to additional practice problems.
One of the scarce resources that constrain our behavior is time.
Each of us has only 24 hours in a day. How do you go about
allocating your time in a given day among competing alterna-
tives? How do you go about weighing the alternatives? Once
you choose a most important use of time, why do you not
spend all your time on it? Use the notion of opportunity cost in
your answer.
In the summer of 2007, the housing market and the mortgage
market were both in decline. Housing prices in most U.S. cities
began to decline in mid-2006. With prices falling and the inven-
tory of unsold houses rising, the production of new homes fell
to around 1.5 million in 2007 from 2.3 million in 2005. With
new construction falling dramatically, it was expected that con-
struction employment would fall and that this would have the
potential of slowing the national economy and increasing the
general unemployment rate. Go to www.bls.gov and check out
the recent data on total employment and construction employ-
ment. Have they gone up or down from their levels in August
2007? What has happened to the unemployment rate? Go to
www.ofheo.gov and look at the housing price index. Have home
prices risen or fallen since August 2007? Finally, look at the lat-
est GDP release at www.bea.gov. Look at residential and nonres-
idential investment (Table 1.1.5) during the last 2 years. Do you
see a pattern? Does it explain the employment numbers?
Explain your answer.
Which of the following statements are examples of positive eco-
nomic analysis? Which are examples of normative analysis?
a. The inheritance tax should be repealed because it is unfair.
b. Allowing Chile to join NAFTA would cause wine prices in
the United States to drop.
c. The first priorities of the new regime in the Democratic
Republic of Congo (DRC, formerly Zaire) should be to
rebuild schools and highways and to provide basic
health care.
Selwyn signed up with an Internet provider for a fixed fee of
$19.95 per month. For this fee, he gets unlimited access to the
World Wide Web. During the average month in 2007, he was
logged onto the Web for 17 hours. What is the average cost of an
hour of Web time to Selwyn? What is the marginal cost of an
additional hour?
A question facing many U.S. states is whether to allow casino
gambling. States with casino gambling have seen a substantial
increase in tax revenue flowing to state government. This revenue
can be used to finance schools, repair roads, maintain social
programs, or reduce other taxes.
a. Recall that efficiency means producing what people want at
the least cost. Can you make an efficiency argument in favor
of allowing casinos to operate?
b. What nonmonetary costs might be associated with gam-
bling? Would these costs have an impact on the efficiency
argument you presented in part a?
c. Using the concept of equity, argue for or against the legaliza-
tion of casino gambling.
For each of the following situations, identify the full cost
(opportunity cost) involved:
a. A worker earning an hourly wage of $8.50 decides to cut
back to part-time to attend Houston Community College.
b. Sue decides to drive to Los Angeles from San Francisco to
visit her son, who attends UCLA.
c. Tom decides to go to a wild fraternity party and stays out all
night before his physics exam.
d. Annie spends $200 on a new dress.
e. The Confab Company spends $1 million to build a new
branch plant that will probably be in operation for at least
10 years.
f. Alex's father owns a small grocery store in town. Alex works
40 hours a week in the store but receives no compensation.
[Related
to the
ECONOMICS
IN
PRACTICE
on p. 6] Log
onto
www
census.gov. Click on "Foreign Trade," then on "Statistics," and
finally on "State Export Data." There you will find a list of the
products produced in your state and exported to countries
around the world. In looking over that list, are you surprised by
anything? Do you know of any firms that produce these items?
Search the Web to find a company that does. Do some research
and write a paragraph about your company: what it produces,
how many people it employs, and whatever else you can learn
about the firm. You might even call the company to obtain the
information.
1.
2.
PROBLEMS
18 PART I Introduction to Economics
APPENDIX
HOW TO READ AND UNDERSTAND GRAPHS
Economics is the most quantitative of the social sciences. If you
flip through the pages of this or any other economics text, you
will see countless tables and graphs. These serve a number of
purposes. First, they illustrate important economic relation-
ships. Second, they make difficult problems easier to understand
and analyze. Finally, they can show patterns and regularities that
may not be discernible in simple lists of numbers.
A graph is a two-dimensional representation of a set of
numbers, or data. There are many ways that numbers can be
illustrated by a graph.
TIME SERIES GRAPHS
It is often useful to see how a single measure or variable
changes over time. One way to present this information is to
plot the values of the variable on a graph, with each value
corresponding to a different time period. A graph of this kind
is called a time series graph. On a time series graph, time is
measured along the horizontal scale and the variable being
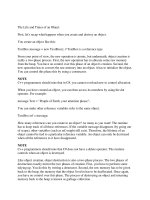
graphed is measured along the vertical scale. Figure 1A.1 is a
time series graph that presents the total disposable personal
income in the U.S. economy for each year between 1975 and
2006.
1
This graph is based on the data found in Table 1A.1.
By displaying these data graphically, we can see that (1) total
disposable personal income has increased steadily since 1975
and (2) during certain periods, income has increased at a
faster rate than during other periods.
1
The measure of income presented in Table 1A.1 and in Figure 1A.1 is disposable
personal income in billions of dollars. It is the total personal income received by all
households in the United States minus the taxes that they pay.
• FIGURE 1A.1 Total Disposable Personal Income in the United
States: 1975-2006 (in billions of dollars)
Source: See Table 1A 1.
Source: U S Department of Commerce, Bureau of Economic
Analysis.
CHAPTER 1 The Scope and Method of Economics 19
GRAPHING TWO VARIABLES ON A CARTESIAN
COORDINATE SYSTEM
More important than simple graphs of one variable are
graphs that contain information on two variables at the
same time. The most common method of graphing two vari-
ables is the Cartesian coordinate system. This system is
constructed by drawing two perpendicular lines: a horizon-
tal line, or X-axis, and a vertical line, or Y-axis. The axes
contain measurement scales that intersect at 0 (zero). This
point is called the origin. On the vertical scale, positive
numbers lie above the horizontal axis (that is, above the ori-
gin) and negative numbers lie below it. On the horizontal
scale, positive numbers lie to the right of the vertical axis (to
the right of the origin) and negative numbers lie to the left of
it. The point at which the graph intersects the Y-axis is called
the Y-intercept. The point at which the graph intersects the
X-axis is called the X-intercept.
When two variables are plotted on a single graph, each point
represents a pair of numbers. The first number is measured on
the X-axis, and the second number is measured on the Y-axis. For
example, the following points (X, Y) are plotted on the set of axes
drawn in Figure 1A.2: (4,2), (2, -1), (-3,4), (-3, -2). Most, but
not all, of the graphs in this book are plots of two variables where
both values are positive numbers [such as (4,2) in Figure 1A.2].
On these graphs, only the upper right quadrant of the coordinate
system (that is, the quadrant in which all X and Y values are posi-
tive) will be drawn.
^ FIGURE 1 A.2 A Cartesian Coordinate System
A Cartesian coordinate system is constructed by drawing two perpendic-
ular lines: a vertical axis (the V-axis) and a horizontal axis (the X-axis).
Each axis is a measuring scale.
PLOTTING INCOME AND CONSUMPTION DATA
FOR HOUSEHOLDS
Table 1A.2 presents data collected by the Bureau of Labor
Statistics (BLS). In a recent survey, 5,000 households were
asked to keep track of all their expenditures. This table shows
average income and average spending for those households,
ranked by income. For example, the average income for the
top fifth (20 percent) of the households was $147,737. The
average spending for the top 20 percent was $90,469.
Figure 1A.3 presents the numbers from Table 1A.2 graph-
ically using the Cartesian coordinate system. Along the hori-
zontal scale, the X-axis, we measure average income. Along the
vertical scale, the Y-axis, we measure average consumption
spending. Each of the five pairs of numbers from the table is
represented by a point on the graph. Because all numbers are
positive numbers, we need to show only the upper right quad-
rant of the coordinate system.
To help you read this graph, we have drawn a dotted line
connecting all the points where consumption and income
would be equal. This 45° line does not represent any data.
Instead, it represents the line along which all variables on the
X-axis correspond exactly to the variables on the Y-axis, for
example, [10,000, 10,000], [20,000, 20,000], and [37,000,
37,000]. The heavy blue line traces the data; the purpose of the
dotted line is to help you read the graph.
There are several things to look for when reading a
graph. The first thing you should notice is whether the line
slopes upward or downward as you move from left to right.
The blue line in Figure 1A.3 slopes upward, indicating that
there seems to be a positive relationship between income
and spending: The higher a household's income, the more
a household tends to consume. If we had graphed the per-
centage of each group receiving welfare payments along the
Y-axis, the line would presumably slope downward, indicat-
ing that welfare payments are lower at higher income levels.
The income level/welfare payment relationship is thus a
negative relationship.
Source: Consumer Expenditures in 2005, U S Bureau of Labor Statistics; Report 998,
Feb 2007
20 PART I Introduction to Economics
> FIGURE 1A.3
Household
Consumption and
Income
A graph is a simple two-dimen-
sional geometric representation
of data. This graph displays the
data from Table 1 A.2. Along the
horizontal scale (X-axis), we
measure household income.
Along the vertical scale (Y-axis),
we measure household con-
sumption. Note: At point A,
consumption equals $19,120
and income equals $9,676 At
point 6, consumption equals
$28,921 and income equals
$25,546
Source: See Table 1A.2.
> FIGURE 1A.4 A Curve
with (a) Positive Slope
and (b) Negative Slope
A positive slope indicates that
increases in X are associated with
increases in Y and that decreases
in X are associated with
decreases in Y. A negative slope
indicates the opposite—when X
increases, Y decreases; and when
X decreases, Y increases
and income that is very different from the one in Table 1A.2
and Figure 1A.3. First, each point in Figure 1A.6 represents a
different year; in Figure 1A.3, each point represented a dif-
ferent group of households at the same point in time (2005).
Second, the points in Figure 1A.6 represent aggregate con-
sumption and income for the whole nation measured in
billions of dollars; in Figure 1A.3, the points represented
average household income and consumption measured in
dollars.
It is interesting to compare these two graphs. All points on
the aggregate consumption curve in Figure 1A.6 lie below the
45° line, which means that aggregate consumption is always
less than aggregate income. However, the graph of average
household income and consumption in Figure 1 A.3 crosses the
45° line, implying that for some households, consumption is
larger than income.
CHAPTER 1 The Scope and Method of Economics 21
22 PART I Introduction to Economics
> FIGURE 1A.6 National
Income and
Consumption
It is important to think carefully
about what is represented by
points in the space defined by
the axes of a graph. In this
graph, we have graphed income
with consumption, as in
Figure 1A.3, but here each obser-
vation point is national income
and aggregate consumption in
different years, measured in
billions of dollars.
Source: See Table 1A 3
SUMMARY
A graph is a two-dimensional representation of a set of num-
bers, or data. A time series graph illustrates how a single vari-
able changes over time.
The most common method of graphing two variables on
one graph is the Cartesian coordinate system, which includes
an X (horizontal)-axis and a Y (vertical)-axis. The points at
which the two axes intersect is called the origin. The point at
which a graph intersects the Y-axis is called the Y-intercept.
The point at which a graph intersects the X-axis is called the
X-intercept.
The slope of a line or curve indicates whether the relation-
ship between the two variables graphed on a Cartesian coor-
dinate system is positive or negative and how much of a
response there is in Y (the variable on the vertical axis) when
X (the variable on the horizontal axis) changes. The slope of
a line between two points is the change in the quantity mea-
sured on the Y-axis divided by the change in the quantity
measured on the X-axis.
Cartesian coordinate system A
common method of graphing two variables
that makes use of two perpendicular lines
against which the variables are plotted, p. 19
graph A two-dimensional representation
of a set of numbers, or data. p. 18
negative relationship A
relationship between two variables, X and Y,
in which a decrease in X is associated with an
increase in Y and an increase in X is
associated with a decrease in Y. p. 19
origin On a Cartesian coordinate system,
the point at which the horizontal and
vertical axes intersect, p. 19
positive relationship A relationship
between two variables, X and Y, in which a
decrease in X is associated with a decrease in
Y, and an increase in X is associated with an
increase in Y. p. 19
slope A measurement that indicates
whether the relationship between variables is
positive or negative and how much of a
response there is in Y (the variable on the
vertical axis) when X (the variable on the
horizontal axis) changes, p. 20
time series graph A graph illustrating
how a variable changes over time. p. 18
X-axis On a Cartesian coordinate system,
the horizontal line against which a variable is
plotted, p. 19
X-intercept The point at which a graph
intersects the X-axis. p. 19
Y-axis On a Cartesian coordinate system,
the vertical line against which a variable is
plotted, p. 19
Y-intercept The point at which a graph
intersects the Y-axis. p. 19
2.
3.
CHAPTER 1 The Scope and Method of Economics 23
PROBLEMS
Graph each of the following sets of numbers. Draw a line
through the points and calculate the slope of each line.
For each of the graphs in Figure 1, determine whether the curve
has a positive or negative slope. Give an intuitive explanation for
what is happening with the slope of each curve.
For each of the following equations, graph the line and calculate
its slope.
a. P = 10 — 2q
D
(Put q
D
on the X-axis.)
b. P = 100 - 4q
D
(Put q
D
on the X-axis.)
c. P = 50 + 6q
s
(Put q
s
on the X-axis.)
d. I = 10,000 - 500r (Put J on the X-axis.)
The Economic
Problem: Scarcity
and Choice
Chapter 1 began with a very broad
definition of economics. Every
society, no matter how small or
large, no matter how simple or
complex, has a system or process
that works to transform the
resources that nature and previous
generations provide into useful
form. Economics is the study of
that process and its outcomes.
Figure 2.1 illustrates three
basic questions that must be
answered to understand the func-
tioning of the economic system:
• What gets produced?
• How is it produced?
• Who gets what is produced?
This chapter explores these questions in detail. In a sense, this entire chapter is the definition
of economics. It lays out the central problems addressed by the discipline and presents a frame-
work that will guide you through the rest of the book. The starting point is the presumption that
human wants are unlimited but resources are not. Limited or scarce resources force individuals and
societies to choose among competing uses of resources—alternative combinations of produced
goods and services—and among alternative final distributions of what is produced among
households.
These questions are positive or descriptive. That is, they ask how the system functions without
passing judgment about whether the result is good or bad. They must be answered first before we
ask more normative questions such as these:
• Is the outcome good or bad?
• Can it be improved?
The term resources is very broad. The sketch on the left side of Figure 2.1 shows several cate-
gories of resources. Some resources are the products of nature: land, wildlife, fertile soil, minerals,
timber, energy, and even the rain and wind. In addition, the resources available to an economy
include things such as buildings and equipment that have been produced in the past but are now
being used to produce other things. And perhaps the most important resource of a society is its
human workforce with people's talents, skills, and knowledge.
Things that are produced and then used in the production of other goods and services are
called capital resources, or simply
capital.
Buildings, equipment, desks, chairs, software, roads,
bridges, and highways are a part of the nations stock of capital.
The basic resources available to a society are often referred to as
factors
of
production,
or
simply
factors.
The three key factors of production are land, labor, and capital. The process that
transforms scarce resources into useful goods and services is called production. In many
soci-
eties, most of the production of goods and services is done by private firms. Private airlines in
2
CHAPTER OUTLINE
Scarcity, Choice, and
Opportunity Cost p. 26
Scarcity and Choice in a
One-Person Economy
Scarcity and Choice in an
Economy of Two or More
The Production Possibility
Frontier
The Economic Problem
Economic Systems p. 38
Command Economies
Laissez-Faire Economies:
The Free Market
Mixed Systems, Markets,
and Governments
Looking Ahead p. 41
capital Things
that
are
produced and then used in
the production of other
goods and services.
factors of production
(or factors) The
inputs
into the process of
production. Another term
for resources.
production The process
that transforms scarce
resources into useful goods
and services.
25