Tài liệu Báo cáo khoa học: "Performance Confidence Estimation for Automatic Summarization" ppt
Bạn đang xem bản rút gọn của tài liệu. Xem và tải ngay bản đầy đủ của tài liệu tại đây (88.88 KB, 8 trang )
Proceedings of the 12th Conference of the European Chapter of the ACL, pages 541–548,
Athens, Greece, 30 March – 3 April 2009.
c
2009 Association for Computational Linguistics
Performance Confidence Estimation for Automatic Summarization
Annie Louis
University of Pennsylvania
Ani Nenkova
University of Pennsylvania
Abstract
We address the task of automatically pre-
dicting if summarization system perfor-
mance will be good or bad based on fea-
tures derived directly from either single- or
multi-document inputs. Our labelled cor-
pus for the task is composed of data from
large scale evaluations completed over the
span of several years. The variation of data
between years allows for a comprehensive
analysis of the robustness of features, but
poses a challenge for building a combined
corpus which can be used for training and
testing. Still, we find that the problem can
be mitigated by appropriately normalizing
for differences within each year. We ex-
amine different formulations of the classi-
fication task which considerably influence
performance. The best results are 84%
prediction accuracy for single- and 74%
for multi-document summarization.
1 Introduction
The input to a summarization system significantly
affects the quality of the summary that can be pro-
duced for it, by either a person or an automatic
method. Some inputs are difficult and summaries
produced by any approach will tend to be poor,
while other inputs are easy and systems will ex-
hibit good performance. User satisfaction with the
summaries can be improved, for example by auto-
matically flagging summaries for which a system
expects to perform poorly. In such cases the user
can ignore the summary and avoid the frustration
of reading poor quality text.
(Brandow et al., 1995) describes an intelligent
summarizer system that could identify documents
which would be difficult to summarize based on
structural properties. Documents containing ques-
tion/answer sessions, speeches, tables and embed-
ded lists were identified based on patterns and
these features were used to determine whether an
acceptable summary can be produced. If not, the
inputs were flagged as unsuitable for automatic
summarization. In our work, we provide deeper
insight into how other characteristics of the text
itself and properties of document clusters can be
used to identify difficult inputs.
The task of predicting the confidence in system
performance for a given input is in fact relevant not
only for summarization, but in general for all ap-
plications aimed at facilitating information access.
In question answering for example, a system may
be configured not to answer questions for which
the confidence of producing a correct answer is
low, and in this way increase the overall accuracy
of the system whenever it does produce an answer
(Brill et al., 2002; Dredze and Czuba, 2007).
Similarly in machine translation, some sen-
tences might contain difficult to translate phrases,
that is, portions of the input are likely to lead
to garbled output if automatic translation is at-
tempted. Automatically identifying such phrases
has the potential of improving MT as shown by
an oracle study (Mohit and Hwa, 2007). More re-
cent work (Birch et al., 2008) has shown that prop-
erties of reordering, source and target language
complexity and relatedness can be used to pre-
dict translation quality. In information retrieval,
the problem of predicting system performance has
generated considerable interest and has led to no-
tably good results (Cronen-Townsend et al., 2002;
Yom-Tov et al., 2005; Carmel et al., 2006).
541
2 Task definition
In summarization, researchers have recognized
that some inputs might be more successfully han-
dled by a particular subsystem (McKeown et al.,
2001), but little work has been done to qualify the
general characteristics of inputs that lead to subop-
timal performance of systems. Only recently the
issue has drawn attention: (Nenkova and Louis,
2008) present an initial analysis of the factors that
influence system performance in content selection.
This study was based on results from the Doc-
ument Understanding Conference (DUC) evalua-
tions (Over et al., 2007) of multi-document sum-
marization of news. They showed that input, sys-
tem identity and length of the target summary were
all significant factors affecting summary quality.
Longer summaries were consistently better than
shorter ones for the same input, so improvements
can be easy in applications where varying target
size is possible. Indeed, varying summary size is
desirable in many situations (Kaisser et al., 2008).
The most predictive factor of summary quality
was input identity, prompting a closer investiga-
tion of input properties that are indicative of dete-
rioration in performance. For example, summaries
of articles describing different opinions about an
issue or of articles describing multiple distinct
events of the same type were of overall poor qual-
ity, while summaries of more focused inputs, deal-
ing with descriptions of a single event, subject or
person (biographical), were on average better.
A number of features were defined, capturing
aspects of how focused on a single topic a given
input is. Analysis of the predictive power of the
features was done using only one year of DUC
evaluations. Data from later evaluations was used
to train and test a logistic regression classifier for
prediction of expected system performance. The
task could be performed with accuracy of 61.45%,
significantly above chance levels.
The results also indicated that special care needs
to be taken when pooling data from different eval-
uations into a single dataset. Feature selection per-
formed on data from one year was not useful for
prediction on data from other years, and actually
led to worse performance than using all features.
Moreover, directly indicating which evaluation the
data came from was the most predictive feature
when testing on data from more than one year.
In the work described here, we show how the
approach for predicting performance confidence
can be improved considerably by paying special
attention to the way data from different years is
combined, as well as by adopting alternative task
formulations (pairwise comparisons of inputs in-
stead of binary class prediction), and utilizing
more representative examples for good and bad
performance. We also extend the analysis to sin-
gle document summarization, for which predict-
ing system performance turns out to be much more
accurate than for multi-document summarization.
We address three key questions.
What features are predictive of performance on
a given input? In Section 4, we discuss four
classes of features capturing properties of the in-
put, related to input size, information-theoretic
properties of the distribution of words in the input,
presence of descriptive (topic) words and similar-
ity between the documents in multi-document in-
puts. Rather than using a single year of evaluations
for the analysis, we report correlation with ex-
pected system performance for all years and tasks,
showing that in fact the power of these features
varies considerably across years (Section 5).
How to combine data from different years? The
available data spans several years of summariza-
tion evaluations. Between years, systems change,
as well as number of systems and average input
difficulty. All of these changes impact system per-
formance and make data from different years dif-
ficult to analyze when taken together. Still, one
would want to combine all of the available eval-
uations in order to have more data for developing
machine learning models. In Section 6 we demon-
strate that this indeed can be achieved, by normal-
izing within each year by the highest observed per-
formance and only then combining the data.
How to define input difficulty? There are several
possible definitions of “input difficulty” or “good
performance”. All the data can be split in two
binary classes of “good” and “bad” performance
respectively, or only representative examples in
which there is a clear difference in performance
can be used. In Section 7 we show that these alter-
natives can dramatically influence prediction ac-
curacy: using representative examples improves
accuracy by more than 10%. Formulating the task
as ranking of two inputs, predicting which one is
more difficult, also turns out to be helpful, offering
more data even within the same year of evaluation.
542
3 Data
We use the data from single- and multi-document
evaluations performed as part of the Document
Understanding Conferences (Over et al., 2007)
from 2001 to 2004.
1
Generic multi-document
summarization was evaluated in all of these years,
single document summaries were evaluated only
in 2001 and 2002. We use the 100-word sum-
maries from both tasks.
In the years 2002-2004, systems were eval-
uated respectively on 59, 37 and 100 (50
for generic summarization and 50 biographical)
multi-document inputs. There were 149 inputs for
single document summarization in 2001 and 283
inputs in 2002. Combining the datasets from the
different years yields a collection of 432 observa-
tions for single-document summarization, and 196
for multi-document summarization.
Input difficulty, or equivalently expected con-
fidence of system performance, was defined em-
pirically, based on actual content selection evalua-
tions of system summaries. More specifically, ex-
pected performance for each input was defined as
the average coverage score of all participating sys-
tems evaluated on that input. In this way, the per-
formance confidence is not specific to any given
system, but instead reflects what can be expected
from automatic summarizers in general.
The coverage score was manually computed by
NIST evaluators. It measures content selection by
estimating overlap between a human model and a
system summary. The scale for the coverage score
was different in 2001 compared to other years: 0
to 4 scale, switching to a 0 to 1 scale later.
4 Features
For our experiments we use the features proposed,
motivated and described in detail by (Nenkova and
Louis, 2008). Four broad classes of easily com-
putable features were used to capture aspects of
the input predictive of system performance.
Input size-related Number of sentences in the
input, number of tokens, vocabulary size, percent-
age of words used only once, type-token ratio.
Information-theoretic measures Entropy of
the input word distribution and KL divergence be-
tween the input and a large document collection.
1
Evaluations from later years did not include generic sum-
marization, but introduced new tasks such as topic-focused
and update summarization.
Log-likelihood ratio for words in the input
Number of topic signature words (Lin and Hovy,
2000; Conroy et al., 2006) and percentage of sig-
nature words in the vocabulary.
Document similarity in the input set These
features apply to multi-document summarization
only. Pairwise similarity of documents within an
input were computed using tf.idf weighted vector
representations of the documents, either using all
words or using only topic signature words. In both
settings, minimum, maximum and average cosine
similarity was computed, resulting in six similar-
ity features.
Multi-document summaries from DUC 2001
were used for feature selection. The 29 sets for
that year were divided according to the average
coverage score of the evaluated systems. Sets with
coverage below the average were deemed to be the
ones that will elicit poor performance and the rest
were considered examples of sets for which sys-
tems perform well. T-tests were used to select fea-
tures that were significantly different between the
two classes. Six features were selected: vocabu-
lary size, entropy, KL divergence, percentage of
topic signatures in the vocabulary, and average co-
sine and topic signature similarity.
5 Correlations with performance
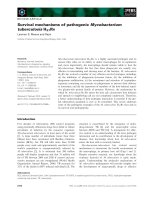
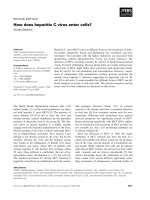
The Pearson correlations between features of the
input and average system performance for each
year is shown in Tables 1 and 2 for multi- and
single-document summarization respectively. The
last two columns show correlations for the com-
bined data from different evaluation years. For
the last column in both tables, the scores in each
year were first normalized by the highest score that
year. Features that were significantly correlated
with expected performance at confidence level of
0.95 are marked with (*). Overall, better perfor-
mance is associated with smaller inputs, lower en-
tropy, higher KL divergence and more signature
terms, as well as with higher document similarity
for multi-document summarization.
Several important observations can be made
from the correlation numbers in the two tables.
Cross-year variation There is a large variation in
the strength of correlation between performance
and various features. For example, KL diver-
gence is significantly correlated with performance
for most years, with correlation of 0.4618 for the
generic summaries in 2004, but the correlation was
543
features 2001 2002 2003 2004G 2004B All(UN) All(N)
tokens -0.2813 -0.2235 -0.3834* -0.4286* -0.1596 -0.2415* -0.2610*
sentences -0.2511 -0.1906 -0.3474* -0.4197* -0.1489 -0.2311* -0.2753*
vocabulary -0.3611* -0.3026* -0.3257* -0.4286* -0.2239 -0.2568* -0.3171*
per-once -0.0026 -0.0375 0.1925 0.2687 0.2081 0.2175* 0.1813*
type/token -0.0276 -0.0160 0.1324 0.0389 -0.1537 -0.0327 -0.0993
entropy -0.4256* -0.2936* -0.1865 -0.3776* -0.1954 -0.2283* -0.2761*
KL divergence 0.3663* 0.1809 0.3220* 0.4618* 0.2359 0.2296* 0.2879*
avg cosine 0.2244 0.2351 0.1409 0.1635 0.2602 0.1894* 0.2483*
min cosine 0.0308 0.2085 -0.5330* -0.1766 0.1839 -0.0337 -0.0494
max cosine 0.1337 0.0305 0.2499 0.1044 -0.0882 0.0918 0.1982*
num sign -0.1880 -0.0773 -0.1799 -0.0149 0.1412 -0.0248 0.0084
% sign. terms 0.3277 0.1645 0.1429 0.3174* 0.3071* 0.1952* 0.2609*
avg topic 0.2860 0.3678* 0.0826 0.0321 0.1215 0.1745* 0.2021*
min topic 0.0414 0.0673 -0.0167 -0.0025 -0.0405 -0.0177 -0.0469
max topic 0.2416 0.0489 0.1815 0.0134 0.0965 0.1252 0.2082*
Table 1: Correlations between input features and average system performance for multi-document inputs
of DUC 2001-2003, 2004G (generic task), 2004B (biographical task), All data (2002-2004) - UNnor-
malized and Normalized coverage scores. P-values smaller than 0.05 are marked by *.
not significant (0.1809) for 2002 data. Similarly,
the average similarity of topic signature vectors is
significant in 2002, but has correlations close to
zero in the following two years. This shows that
no feature exhibits robust predictive power, espe-
cially when there are relatively few datapoints. In
light of this finding, developing additional features
and combining data to obtain a larger collection of
samples are important for future progress.
Normalization Because of the variation from year
to year, normalizing performance scores is benefi-
cial and leads to higher correlation for almost all
features. On average, correlations increase by 0.05
for all features. Two of the features, maximum co-
sine similarity and max topic word similarity, be-
come significant only in the normalized data. As
we will see in the next section, prediction accu-
racy is also considerably improved when scores
are normalized before pooling the data from dif-
ferent years together.
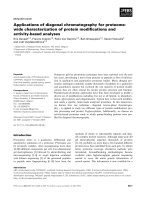
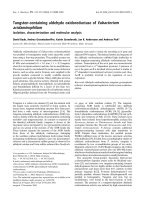
Single- vs. multi-document task The correla-
tions between performance and input features are
higher in single-document summarization than in
multi-document. For example, in the normalized
data KL divergence has correlation of 0.28 for
multi-document summarization but 0.40 for sin-
gle document. The number of signature terms
is highly correlated with performance in single-
document summarization (-0.25) but there is prac-
tically no correlation for multi-document sum-
maries. Consequently, we can expect that the
performance prediction will be more accurate for
single-document summarization.
features 2001 2002 All(N)
tokens -0.3784* -0.2434* -0.3819*
sentences -0.3999* -0.2262* -0.3705*
vocabulary -0.4410* -0.2706* -0.4196*
per-once -0.0718 0.0087 0.0496
type/token 0.1006 0.0952 0.1785
entropy -0.5326* -0.2329* -0.3789*
KL divergence 0.5332* 0.2676* 0.4035*
num sign -0.2212* -0.1127 -0.2519*
% sign 0.3278* 0.1573* 0.2042*
Table 2: Correlations between input features and
average system performance for single doc. inputs
of DUC’01, ’02, All (’01+’02) N-normalized. P-
values smaller than 0.05 are marked by *.
6 Classification experiments
In this section we explore how the alternative task
formulations influence success of predicting sys-
tem performance. Obviously, the two classes of
interest for the prediction will be “good perfor-
mance” and “poor performance”. But separat-
ing the real valued coverage scores for inputs into
these two classes can be done in different ways.
All the data can be used and the definition of
“good” or “bad” can be determined in relation to
the average performance on all inputs. Or only the
best and worst sets can be used as representative
examples. We explore the consequences of adopt-
ing either of these options.
For the first set of experiments, we divide all
inputs based on the mean value of the average sys-
tem scores as in (Nenkova and Louis, 2008). All
multi-document results reported in this paper are
based on the use of the six significant features dis-
cussed in Section 4. DUC 2002, 2003 and 2004
data was used for 10-fold cross validation. We ex-
544
perimented with three classifiers available in R—
logistic regression (LogR), decision tree (DTree)
and support vector machines (SVM). SVM and
decision tree classifiers are libraries under CRAN
packages e1071 and rpart.
2
Since our develop-
ment set was very small (only 29 inputs), we did
not perform any parameter tuning.
There is nearly equal number of inputs on either
side of the average system performance and the
random baseline performance in this case would
give 50% accuracy.
6.1 Multi-document task
The classification accuracy for the multi-
document inputs is reported in Table 3. The
partitioning into classes was done based on
the average performance (87 easy sets and 109
difficult sets).
As expected, normalization considerably im-
proves results. The absolute largest improvement
of 10% is for the logistic regression classifier. For
this classifier, prediction accuracy for the non-
normalized data is 54% while for the normalized
data, it is 64%. Logistic regression gives the best
overall classification accuracy on the normalized
data compared to SVM classifier that does best on
the unnormalized data (56% accuracy). Normal-
ization also improves precision and recall for the
SVM and logistic regression classifiers.
The differences in accuracies obtained by the
classifiers is also noticable and we discuss these
further in Section 7.
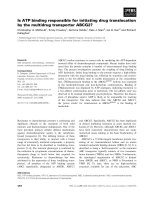
6.2 Single document task
We now turn to the task of predicting summa-
rization performance for single document inputs.
As we saw in section 5, the features are stronger
predictors for summarization performance in the
single-document task. In addition, there is more
data from evaluations of single document summa-
rizers. Stronger features and more training data
can both help achieve higher prediction accura-
cies. In this section, we separate out the two fac-
tors and demonstrate that indeed the features are
much more predictive for single document sum-
marization than for multidocument.
In order to understand the effect of having more
training data, we did not divide the single doc-
ument inputs into a separate development set to
use for feature selection. Instead, all the features
2
/>classifier accuracy P R F
DTree 66.744 66.846 67.382 67.113
LogR 67.907 67.089 69.806 68.421
SVM 69.069 66.277 80.317 72.625
Table 4: Single document input classification Pre-
cision (P), Recall (R),and F score (F) for difficult
inputs on DUC’01 and ’02 (total 432 examples)
divided into 2 classes based on the average cover-
age score (217 difficult and 215 easy inputs).
discussed in Section 4 except the six cosine and
topic signature similarity measures are used. The
coverage score ranges in DUC 2001 and 2002 are
different. They are normalized by the maximum
score within the year, then combined and parti-
tioned in two classes with respect to the average
coverage score. In this way, the 432 observations
are split into almost equal halves, 215 good perfor-
mance examples and 217 bad performance. Table
4 shows the accuracy, precision and recall of the
classifiers on single-document inputs.
From the results in Table 4 it is evident that
all three classifiers achieve accuracies higher than
those for multi-document summarization. The im-
provement is largest for decision tree classifica-
tion, nearly 15%. The SVM classifier has the high-
est accuracy for single document summarization
inputs, (69%), which is 7% absolute improvement
over the performance of the SVM classifier for
the multi-document task. The smallest improve-
ment of 4% is for the logistic regression classi-
fier which is the one with highest accuracy for the
multi-document task
Improved accuracy could be attributed to the
fact that almost double the amount of data is avail-
able for the single-document summarization ex-
periments. To test if this was the main reason for
improvement, we repeated the single-document
experiments using a random sample of 196 inputs,
the same amount of data as for the multi-document
case. Even with reduced data, single-document
inputs are more easily classifiable as difficult or
easy compared to multi-document, as shown in Ta-
bles 3 and 5. The SVM classifier is still the best
for single-document summarization and its accu-
racy is the same with reduced data as with all
data. With less data, the performance of the lo-
gistic regression and decision tree classifiers de-
grades more and is closer to the numbers for multi-
document inputs.
545
Classifier N/UN Acc Pdiff Rdiff Peasy Reasy Fdiff Feasy
DTree
UN 51.579 56.580 56.999 46.790 45.591 55.383 44.199
N 52.105 56.474 57.786 46.909 45.440 55.709 44.298
LogR
UN 54.211 56.877 71.273 50.135 34.074 62.145 39.159
N 63.684 63.974 79.536 63.714 45.980 69.815 51.652
SVM
UN 55.789 57.416 73.943 50.206 32.753 63.784 38.407
N 62.632 61.905 81.714 61.286 38.829 69.873 47.063
Table 3: Multi-document input classification results on UNnormalized and Normalized data from DUC
2002 to 2004. Both Normalized and UNormalized data contain 109 difficult and 87 easy inputs. Since
the split is not balanced, the accuracy of classification as well as the Precision (P), Recall (R) and F score
(F) are reported for both classes of easy and diff(icult) inputs.
classifier accuracy P R F
DTree 53.684 54.613 53.662 51.661
LogR 61.579 63.335 60.400 60.155
SVM 69.474 66.339 85.835 73.551
Table 5: Single-document-input classification Pre-
cision (P), Recall (R), and F score (F) for difficult
inputs on a random sample of 196 observations (99
difficult/97 easy) from DUC’01 and ’02.
7 Learning with representative examples
In the experiments in the previous section, we used
the average coverage score to split inputs into two
classes of expected performance. Poor perfor-
mance was assigned to the inputs for which the
average system coverage score was lower than the
average for all inputs. Good performance was as-
signed to those with higher than average cover-
age score. The best results for this formulation
of the prediction task is 64% accuracy for multi-
document classification (logistic regression classi-
fier; 196 datapoints) and 69% for single-document
(SVM classifier; 432 and 196 datapoints).
However, inputs with coverage scores close to
the average may not be representative of either
class. Moreover, inputs for which performance
was very similar would end up in different classes.
We can refine the dataset by using only those ob-
servations that are highly representative of the cat-
egory they belong to, removing inputs for which
system performance was close to the average. It
is desirable to be able to classify mediocre inputs
as a separate category. Further studies are neces-
sary to come up with better categorization of in-
puts rather than two strict classes of difficult and
easy. For now, we examine the strength of our fea-
tures in distinguishing the extreme types by train-
ing and testing only on inputs that are representa-
tive of these classes.
We test this hypothesis by starting with 196
multi-document inputs and performing the 10-fold
cross validation using only 80%, 60% and 50%
of the data, incrementally throwing away obser-
vations around the mean. For example, the 80%
model was learnt on 156 observations, taking the
extreme 78 observations on each side into the dif-
ficult and easy categories. For the single document
case, we performed the same tests starting with
a random sample of 196 observations as 100%
data.
3
All classifiers were trained and tested on
the same division of folds during cross validation
and compared using a paired t-test to determine
the significance of differences if any. Results are
shown in Table 6. In parentheses after the accu-
racy of a given classifier, we indicate the classifiers
that are significantly better than it.
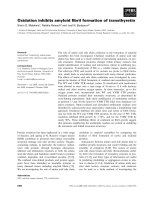
Classifiers trained and tested using only repre-
sentative examples perform more reliably. The
SVM classifier is the best one for the single-
document setting and in most cases significantly
outperforms logistic regression and decision tree
classifiers on accuracy and recall. In the multi-
document setting, SVM provides better overall re-
call than logistic regression. However, with re-
spect to accuracy, SVM and logistic regression
classifiers are indistinguishable. The decision tree
classifier performs worse.
For multi-document classification, the F score
drops initially when data is reduced to only 80%.
But when using only half of the data, accuracy
of prediction reaches 74%, amounting to 10% ab-
solute improvement compared to the scenario in
which all available data is used. In the single-
document case, accuracy for the SVM classifier
increases consistently, reaching accuracy of 84%.
8 Pairwise ranking approach
The task we addressed in previous sections was to
classify inputs into ones for which we expect good
3
We use the same amount of data as is available for multi-
document so that the results can be directly comparable.
546
Single document classification Multi-document classification
Data CL Acc P R F Acc P R F
100%
DTree
53.684 (S) 54.613 53.662 (S) 51.661 52.105 (S,L) 56.474 57.786 (S,L) 55.709
LogR
61.579 (S) 63.335 60.400 (S) 60.155 63.684 63.974 79.536 69.815
SVM
69.474 66.339 85.835 73.551 62.632 61.905 81.714 69.873
80%
DTree
62.000 (S) 62.917 (S) 67.089 (S) 62.969 53.333 57.517 55.004 (S) 51.817
LogR
68.000 68.829 69.324 (S) 67.686 58.667 60.401 59.298 (S) 57.988
SVM
71.333 70.009 86.551 75.577 62.000 61.492 71.075 63.905
60%
DTree
68.182 (S) 72.750 60.607 (S) 64.025 57.273 (S) 63.000 58.262 (S) 54.882
LogR
70.909 73.381 69.250 69.861 67.273 68.357 70.167 65.973
SVM
76.364 73.365 82.857 76.959 66.364 68.619 75.738 67.726
50%
DTree
70.000 (S) 69.238 67.905 (S) 66.299 65.000 60.381 (L) 70.809 64.479
LogR
76.000 (S) 76.083 72.500 (S) 72.919 74.000 72.905 70.381 (S) 70.965
SVM
84.000 83.476 89.000 84.379 72.000 67.667 79.143 71.963
Table 6: Performance of multiple classifiers on extreme observations from single and multi-document
data (100% data = 196 data points in both cases divided into 2 classes on the basis of average coverge
score). Reported precision (P), recall (R) and F score (F) are for difficult inputs. Experiments on ex-
tremes use equal number of examples from each class - baseline performance is 50%. Systems whose
performance is significantly better than the specified numbers are shown in brackets (S-SVM, D-Decision
Tree, L-Logistic Regression).
performance and ones for which poor system per-
formance is expected. In this section, we evaluate
a different approach to input difficulty classifica-
tion. Given a pair of inputs, can we identify the
one on which systems will perform better? This
ranking task is easier than requiring a strict deci-
sion on whether performance will be good or not.
Ranking approaches are widely used in text
planning and sentence ordering (Walker et al.,
2001; Karamanis, 2003) to select the text with best
structure among a set of possible candidates. Un-
der the summarization framework, (Barzilay and
Lapata, 2008) ranked different summaries for the
same input according to their coherence. Simi-
larly, ranking alternative document clusters on the
same topic to choose the best input will prove an
added advantage to summarizer systems. When
summarization is used as part of an information
access interface, the clustering of related docu-
ments that form the input to a system is done
automatically. Currently, the clustering of docu-
ments is completely independent of the need for
subsequent summarization of the resulting clus-
ters. Techniques for predicting summarizer per-
formance can be used to inform clustering so that
the clusters most suitable for summarization can
be chosen. Also, when sample inputs for which
summaries were deemed to be good are available,
these can be used as a standard with which new
inputs can be compared.
For the pairwise comparison task, the features
are the difference in feature values between the
two inputs A and B that form a pair. The dif-
ference in average system scores of inputs A and
B in the pair is used to determine the input for
which performance was better. Every pair could
give two training examples, one positive and one
negative depending on the direction in which the
differences are computed. We choose one exam-
ple from every pair, maintaining an equal number
of positive and negative instances.
The idea of using representative examples can
be applied for the pairwise formulation of the task
as well—the larger the difference in system perfor-
mance is, the better example the pair represents.
Very small score differences are not as indicative
of performance on one input being better than the
other. Hence the experiments were duplicated on
80%, 60% and 40% of the data where the retained
examples were the ones with biggest difference
between the system performance on the two sets
(as indicated by the average coverage score). The
range of score differences in each year are indi-
cated in the Table 7.
All scores are normalized by the maximum
score within the year. Therefore the smallest and
largest possible differences are 0 and 1 respec-
tively. The entries corresponding to the years
2002, 2003 and 2004 show the SVM classification
results when inputs were paired only with those
within the same year. Next inputs of all years were
paired with no restrictions. We report the classifi-
cation accuracies on a random sample of these ex-
amples equal in size to the number of datapoints
in the 2004 examples.
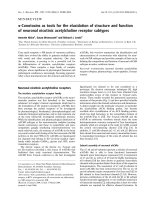
Using only representative examples leads to
547
Amt Data Min score diff Points Acc.
All
2002 0.00028 1710 65.79
2003 0.00037 666 73.94
2004 0.00023 4948 70.71
2002-2004 0.00005 4948 68.85
80%
2002 0.05037 1368 68.39
2003 0.08771 532 78.87
2004 0.05226 3958 73.36
2002-2004 0.02376 3958 70.68
60%
2002 0.10518 1026 73.04
2003 0.17431 400 82.50
2004 0.11244 2968 77.41
2002-2004 0.04844 2968 71.39
40%
2002 0.16662 684 76.03
2003 0.27083 266 87.31
2004 0.18258 1980 79.34
2002-2004 0.07489 1980 74.95
Maximum score difference 2002 (0.8768), 2003 (0.8969),
2004 (0.8482), 2002-2004 (0.8768)
Table 7: Accuracy of SVM classification of mul-
tidocument input pairs. When inputs are paired
irrespective of year (2002-2004), datapoints equal
in number to that in 2004 were chosen at random.
consistently better results than using all the data.
The best classification accuracy is 76%, 87% and
79% for comparisons within the same year and
74% for comparisons across years. It is important
to observe that when inputs are compared with-
out any regard to the year, the classifier perfor-
mance is worse than when both inputs in the pair
are taken from the same evaluation year, present-
ing additional evidence of the cross-year variation
discussed in Section 5. A possible explanation
is that system improvements in later years might
cause better scores to be obtained on inputs which
were difficult previously.
9 Conclusions
We presented a study of predicting expected sum-
marization performance on a given input. We
demonstrated that prediction of summarization
system performance can be done with high ac-
curacy. Normalization and use of representative
examples of difficult and easy inputs both prove
beneficial for the task. We also find that per-
formance predictions for single-document sum-
marization can be done more accurately than for
multi-document summarization. The best classi-
fier for single-document classification are SVMs,
and the best for multi-document—logistic regres-
sion and SVM. We also record good prediction
performance on pairwise comparisons which can
prove useful in a variety of situations.
References
R. Barzilay and M. Lapata. 2008. Modeling local co-
herence: An entity-based approach. CL, 34(1):1–34.
A. Birch, M. Osborne, and P. Koehn. 2008. Predicting
success in machine translation. In Proceedings of
EMNLP, pages 745–754.
R. Brandow, K. Mitze, and L. F. Rau. 1995. Automatic
condensation of electronic publications by sentence
selection. Inf. Process. Manage., 31(5):675–685.
E. Brill, S. Dumais, and M. Banko. 2002. An analysis
of the askmsr question-answering system. In Pro-
ceedings of EMNLP.
D. Carmel, E. Yom-Tov, A. Darlow, and D. Pelleg.
2006. What makes a query difficult? In Proceed-
ings of SIGIR, pages 390–397.
J. Conroy, J. Schlesinger, and D. O’Leary. 2006.
Topic-focused multi-documentsummarization using
an approximate oracle score. In Proceedings of
ACL.
S. Cronen-Townsend, Y. Zhou, and W. B. Croft. 2002.
Predicting query performance. In Proceedings of SI-
GIR, pages 299–306.
M. Dredze and K. Czuba. 2007. Learning to admit
you’re wrong: Statistical tools for evaluating web
qa. In NIPS Workshop on Machine Learning for Web
Search.
M. Kaisser, M. A. Hearst, and J. B. Lowe. 2008. Im-
proving search results quality by customizing sum-
mary lengths. In Proceedings of ACL: HLT, pages
701–709.
N. Karamanis. 2003. Entity Coherence for Descriptive
Text Structuring. Ph.D. thesis, University of Edin-
burgh.
C. Lin and E. Hovy. 2000. The automated acquisition
of topic signatures for text summarization. In Pro-
ceedings of COLING, pages 495–501.
K. McKeown, R. Barzilay, D. Evans, V. Hatzivas-
siloglou, B. Schiffman, and S. Teufel. 2001.
Columbia multi-document summarization: Ap-
proach and evaluation. In Proceedings of DUC.
B. Mohit and R. Hwa. 2007. Localization of difficult-
to-translate phrases. In Proceedings of ACL Work-
shop on Statistical Machine Translations.
A. Nenkova and A. Louis. 2008. Can you summa-
rize this? identifying correlates of input difficulty
for multi-document summarization. In Proceedings
of ACL: HLT, pages 825–833.
P. Over, H. Dang, and D. Harman. 2007. Duc in con-
text. Inf. Process. Manage., 43(6):1506–1520.
M. Walker, O. Rambow, and M. Rogati. 2001. Spot:
a trainable sentence planner. In Proceedings of
NAACL, pages 1–8.
E. Yom-Tov, S. Fine, D. Carmel, and A. Darlow.
2005. Learning to estimate query difficulty: includ-
ing applications to missing content detection and
distributed information retrieval. In Proceedings of
SIGIR, pages 512–519.
548