Electrophoresis
Bạn đang xem bản rút gọn của tài liệu. Xem và tải ngay bản đầy đủ của tài liệu tại đây (7.5 MB, 26 trang )
571
Chapter Outline
23.1 Introduction: The Human Genome Project
23.1A What Is Electrophoresis?
23.1B How Is Electrophoresis Performed?
23.2 General Principles of Electrophoresis
23.2A Factors Affecting Analyte Migration
23.2B Factors Affecting Band-Broadening
23.3 Gel Electrophoresis
23.3A What Is Gel Electrophoresis?
23.3B How Is Gel Electrophoresis Performed?
23.3C What Are Some Special Types of Gel Electrophoresis?
23.4 Capillary Electrophoresis
23.4A What Is Capillary Electrophoresis?
23.4B How Is Capillary Electrophoresis Performed?
23.4C What Are Some Special Types of Capillary Electrophoresis?
Chapter 23
Electrophoresis
23.1 INTRODUCTION: THE HUMAN
GENOME PROJECT
February 2001 saw one of the greatest achievements of
modern science. It was at this time that two scientific
papers appeared, one in the journal Science and the other
in Nature, reporting the sequence of human DNA (or the
“human genome”).
1,2
These papers were the result of a
major research effort known as the Human Genome
Project, which was formally begun in 1990 under the
sponsorship of the U.S. Department of Energy and the
National Institutes of Health.
3
Although it was anticipated to take 15 years to fin-
ish, this project was “completed” in about a decade. This
early completion was made possible by several advances
that occurred in techniques for sequencing DNA. One
common approach for sequencing DNA is the Sanger
method (see Figure 23.1). In the Sanger method, the sec-
tion of DNA to be examined (known as the “template”) is
mixed with a segment of DNA that binds to part of this
sequence (the “primer”). This mixture is placed into four
containers that have the nucleotides and enzymes
needed to build on the template. These containers also
have special labeled nucleotides that will stop the elonga-
tion of DNA after the addition of a C, G, A, or T to its
sequence. The DNA strands formed in each container are
later separated according to their size. By comparing the
length of these strands and by knowing which labeled
nucleotides are at the end of each strand, the sequence of
the DNA can be determined.
4
The Sanger method was originally developed as a
manual technique that took long periods of time to per-
form. Thus, one thing that had to be addressed early in
the Human Genome Project was the creation of faster,
automated systems for sequencing DNA.
5,6
Both tradi-
tional and newer systems for accomplishing this
sequencing utilize a separation method known as
electrophoresis. In this chapter we learn about elec-
trophoresis, look at its applications, and see how
improvements in this technique made the Human
Genome Project possible.
23.1A What Is Electrophoresis?
Electrophoresis is a technique in which solutes are sepa-
rated by their different rates of migration in an electric
field (see Figure 23.2).
7–10
To carry out this method, a
sample is first placed in a container or support that also
contains a background electrolyte (or “running buffer”).
When an electric field is later applied to this system, the
ions in the running buffer will flow from one electrode to
the other and provide the current needed to maintain the
applied voltage. At the same time, positively charged
ions in the sample will move toward the negative elec-
trode (the cathode), while negatively charged ions will
move toward the positive electrode (the anode). The
result is a separation of these ions based on their charge
and size. Because many biological compounds have
charges or ionizable groups (e.g., DNA and proteins),
electrophoresis is frequently utilized in biochemical and
96943_23_ch23_p571-596 1/8/10 2:54 PM Page 571
572 Chapter 23 • Electrophoresis
Primer
Sample of DNA
Add DNA and primer to
four reaction mixtures
for replication,
each mixture containing
a different elongation-
stopping nucleotide
Stops
at C
Stops
at T
Stops
at A
Stops
at G
Mixtures of elongated primer strands with
various lengths and stopped a
t different
nucleotides
Sequence of
original DNA
Separate primers strands by
size using electrophoresis
Stopped
at C
Stopped
at T
Stopped
at A
Stopped
at G
G
T
G
A
C
T
A
G
T
C
G
A
T
(a)
(
b
)
DNA replication
Separate and analyze primer strands
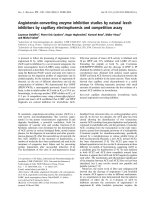
FIGURE 23.1 Sequencing of DNA by the Sanger method. This method is named after F. Sanger, one of the
scientists who originally reported this technique.
4
The final DNA sequence is determined in this method by
looking at the sequence of the primer strands and using the complementary nucleotides (C for G, A for T, G
for C, and T for A) to describe the sequence of the original DNA.
of moving boundaries between regions that contained dif-
ferent mixtures of proteins, as shown in Figure 23.3.
10,16
Today it is more common to use small samples to allow
analytes to be separated into narrow bands or zones, giving
a method known as zone electrophoresis.
8–10,16
An example of
zone electrophoresis is shown in Figure 23.1, where DNA is
sequenced by separating its strands of various lengths into
narrow bands on a gel.
There are many ways in which electrophoresis is
used for chemical analysis. These include the sequencing
of DNA, as well as the purification of proteins, peptides,
and other biomolecules. In clinical chemistry, elec-
trophoresis is an important tool for examining the pat-
terns of amino acids, serum proteins, enzymes, and
lipoproteins in the body. Electrophoresis is also used in
the analysis of organic and inorganic ions in foods, com-
mercial products, and environmental samples. In addi-
tion, electrophoresis is an essential component of medical
and pharmaceutical research for the characterization of
medical research. This approach can also be adapted for
work with small ions (like or ) or for large
charged particles (such as cells and viruses).
Even though it has been known for one hundred years
that substances like proteins and enzymes have a character-
istic rate of travel in an electric field,
11–13
electrophoresis did
not become a routine separation method until around the
1930s. One notable advance occurred in 1937 when a scien-
tist named Arne Tiselius (Figure 23.3) used electrophoresis
for the separation of serum proteins.
3,14
Tiselius conducted
this separation by employing a U-shaped tube in which he
placed his sample and running buffer. When he applied an
electric field, proteins in the sample began to separate as
they migrated toward the electrodes of opposite charge.
However, the use of a large sample volume gave a series of
broad and only partially resolved regions that contained
different mixtures of the original proteins.
15
The method employed by Tiselius is now known as
moving boundary electrophoresis, because it produced a series
NO
3
-
Cl
-
96943_23_ch23_p571-596 1/8/10 2:54 PM Page 572
Section 23.1 • Introduction: The Human Genome Project 573
؊
Apply electric field
SampleBackground
electrolyte
(Ϫ)(ϩ)
؉
؉
؉
؉
؊
؊
؊
؊
؉
؉
؉
؉
؊
؊
؊
FIGURE 23.2 Separation of positively and
negatively charged analytes in a sample
by electrophoresis.
proteins in normal and diseased cells and for looking for
new substances.
10
23.1B How Is Electrophoresis Performed?
Electrophoresis can be performed in a variety of formats
(see Figure 23.4). One format is to apply small amounts
of a sample to a support (usually a gel) and allow the
analytes in this sample to travel in a running buffer
through the support when an electric field is applied.
This approach is known as gel electrophoresis (a method
we will discuss in Section 23.3).
17–19
It is also possible to
separate the components of a sample by using a narrow
capillary that is filled with a running buffer and placed
into an electric field. This second format is called
capillary electrophoresis (discussed in Section 23.4).
17,19–22
Depending on the type of electrophoresis being
used, the resulting separation can be viewed in one of
two ways. In the case of gel electrophoresis, the separa-
tion is stopped before analytes have traveled off the sup-
port. The result is a series of bands where the migration
distance (d
m
) characterizes the extent to which each ana-
lyte has interacted with the electric field. This approach is
similar to that used to characterize the retention of ana-
lytes in thin-layer chromatography and paper chro-
matography (see Chapter 22). Because the migration
distance of an analyte through a gel for electrophoresis
will depend on the exact voltage and time used for the
separation, it is common to include standard samples on
the same support as the sample to help in analyte identi-
fication. The intensity of the analyte band is then used to
measure the amount of this substance in the sample.
In capillary electrophoresis all analytes travel the
same distance, from the point of injection to the oppo-
site end where a detector is located. The analytes will
differ, however, in the time it takes them to travel this
distance, in a manner similar to what occurs in the
chromatographic methods of gas chromatography (GC)
and high-performance liquid chromatography (HPLC).
In this situation the migration time (t
m
) for each ana-
lyte is measured and recorded.
7
The resulting plot of
detector response versus migration time is called an
Sample with a mixture
of
p
roteins
(
1–3
)
Proteins 1–3
Protein 1
Protein 1 ϩ 2
Protein 3
Protein 2 ϩ 3
Buffer
Before applying
electric field
During application
of electric field
FIGURE 23.3 Arne W. K. Tiselius (1902–1971), and an example of a protein separation performed by
moving boundary electrophoresis. Tiselius was a Swedish scientist who won the 1948 Nobel Prize in chemistry
for his early work in the field of electrophoresis. Tiselius began this research while working as a graduate
student at the University of Uppsala in Sweden. He received his doctorate degree in 1930 and later returned
in 1937 to the University of Uppsala as a professor of biochemistry. It is here that he explored the use of
moving boundary electrophoresis to separate chemically similar proteins in blood.
3,15
Electrophoresis is still
used today by clinical chemists when they examine the pattern of major and minor proteins in blood, urine,
and other samples from the body.
96943_23_ch23_p571-596 1/8/10 2:54 PM Page 573
574 Chapter 23 • Electrophoresis
Migration distance
Sample Standards
(b)
Electrophoresis gel/support
Electropherogram
Migration time
Detector
(ϩ
)
(Ϫ)
(Ϫ)
(ϩ)
(a)
FIGURE 23.4 Examples of the results produced by (a) gel electrophoresis, and (b) capillary electrophoresis.
electropherogram. The migration times in this plot can
be used to help in analyte identification, while the peak
heights or areas are used to determine the amount of
each analyte. An internal standard is usually injected
along with the sample to correct for variations during
injection or small fluctuations in the experimental con-
ditions during the separation.
23.2 GENERAL PRINCIPLES
OF ELECTROPHORESIS
The separation of analytes by electrophoresis has two key
requirements. The first requirement is there must be a dif-
ference in how analytes will interact with the separation
system. In electrophoresis this requirement means the
analytes must have different migration times or migra-
tion distances. The second requirement is that the bands
or peaks for the analytes must be sufficiently narrow to
allow them to be resolved.
23.2A Factors Affecting Analyte Migration
Electrophoretic Mobility. Electrophoresis is similar to
chromatography in that both involve the separation of com-
pounds by differential migration. Chromatography brings
about differential migration through chemical interactions
between analytes with the stationary phase and mobile
phase. In electrophoresis, differential migration is produced
by the movement of analytes in an electric field, where their
rate of migration will depend on their size and charge.
The overall rate of travel of a charged solute in elec-
trophoresis will depend on two opposing forces (see
Figure 23.5). The first of these forces (F
+
) is the attraction
of a charged solute toward the electrode of opposite
charge. This force depends on the strength of the applied
electric field (E, units of volts per distance) and the charge
on the solute (z). The second force acting on the solute is
resistance to its movement, as created by the surrounding
medium. The force of this resistance (F
–
) depends on the
“size” of the solute (as described by its solvated radius r),
the viscosity of the medium , and the solute’s velocity
of migration (v, in units of distance per time).
When an electric field is applied, a solute will accel-
erate toward the electrode of opposite charge until the
forces F
+
and F
–
become equal in size (although opposite
in direction).
10,21
At this point a steady-state situation is
produced in which the solute begins to move at a con-
stant velocity. This velocity can be found by setting the
expressions for F
+
and F
–
equal to each other and rear-
ranging the resulting equation in terms of v.
(23.1)6prhv = E z
or
v =
E z
6prh
(h)
(Ϫ)(ϩ)
Attraction of solute to
electrode
(F
ϩ
ϭ E z)
Resistance to solute
movement
(F
Ϫ
ϭ 6rv)
؉
FIGURE 23.5 Forces that determine
electrophoretic mobility.
96943_23_ch23_p571-596 1/8/10 2:54 PM Page 574
Section 23.2 • General Principles of Electrophoresis 575
To see how this velocity will be affected by only the
strength of the electric field, we can combine the other
terms in Equation 23.1 to give a single constant ,
(23.2)
where . This new combination of terms is
known as the electrophoretic mobility, which is repre-
sented by the symbol .
7,9
The value of is often
expressed in units of or and is con-
stant for a given analyte under a particular set of temper-
ature and solvent conditions. The value of also
depends on the apparent size and charge of the solute, as
represented by the ratio z/r in Equation 23.1. This last fea-
ture means that any two solutes with different charge-to-
size ratios can, in theory, be separated by electrophoresis.
m
cm
2
>kV
#
minm
2
>V
#
s
mm
m = z>(6 p r h)
v = mE
(m)
If we lower the applied voltage from 20 kV to 10 kV
(a twofold change), the migration times will increase and
the migration velocities for these proteins will decrease
(also by twofold), but their electrophoretic mobilities will
remain exactly the same. This situation occurs because
the electrophoretic mobility is independent of voltage
and electric field strength, while migration times and
velocities are not. Thus, if there is a decrease in V and E,
Equation 23.3 indicates there must be a proportional
decrease in v and t
m
to keep constant.
m
EXERCISE 23.1 Determining the Electrophoretic
Mobility for an Analyte
The apparent electrophoretic mobility for an analyte in
capillary electrophoresis can be found by rewriting
Equation 23.2 in the form shown.
(23.3)
In this equation, V is the voltage applied to the elec-
trophoretic system over a length L, and L
d
is the distance
traveled from the point of application to the detector by
the analyte in migration time t
m
.
A sample of several proteins is applied to a neutral-
coated capillary with a total length of 25.0 cm and a distance
to the detector of 22.0 cm. Two of the proteins in the sample
give migration times of 15.3 min and 16.2 min when using
an applied voltage of 20.0 kV. What are the migration veloc-
ities and electrophoretic mobilities of these proteins under
these conditions? What will their electrophoretic mobilities
and migration times be at an applied voltage of 10.0 kV?
SOLUTION
The electrophoretic mobility of the first protein can be
found by substituting the known values for L
d
(22.0 cm), t
m
(15.3 min), V (20.0 kV), and L (25.0 cm) into Equation 23.3.
A similar calculation for the second protein gives an elec-
trophoretic mobility of . The lower
electrophoretic mobility of the second protein makes
sense because it takes longer for this protein to migrate
through the system. The migration velocities for these
proteins can be found by simply dividing their distance
of travel by their migration times , which
gives (22.0 cm/15.3 min) = 1.44 cm/min and (22 cm/
16.2 min) = 1.36 cm/min for proteins 1 and 2.
(v = L
d
>t
m
)
1.70 cm
2
>kV
#
min
Protein 1: m =
(22.0 cm>15.3 min)
(20.0 kV>25.0 cm)
= 1.80 cm
2
>kV
#
min
m =
v
E
=
(L
d
>t
m
)
(V>L)
Secondary Interactions. To obtain good separations
in electrophoresis it is often necessary to adjust the con-
ditions of this method to change the electrophoretic
mobility of a solute. We can accomplish this goal by
using secondary reactions that alter the charge or appar-
ent size of the solute. If an analyte is a weak acid or
weak base, for example, its net charge can be varied by
changing the pH. In the case of a weak monoprotic acid,
the main species at a pH well below the pK
a
will be the
neutral form of the acid (HA), while the dominant
species at a pH much greater than the pK
a
will be the
negatively charged conjugate base . At an interme-
diate pH, we will have a mixture of these two forms and
the average charge for all of these species will be some-
where between “0” and “–1.” As a result, the overall
observed electrophoretic mobility for such a compound
(as well as for other weak acids and weak bases) can be
adjusted by varying the pH.
It is also possible to use side reactions to change the
effective size or charge of the analyte. This effect occurs
in a method known as sodium dodecyl sulfate polyacry-
lamide gel electrophoresis (SDS-PAGE), which is a tech-
nique for separating proteins according to their size (see
Section 23.4C). This analysis begins by first denaturing
the proteins and coating them with sodium dodecyl sul-
fate, a negatively charged surfactant. The coating
process can be thought of as a type of complexation reac-
tion. The negative coating not only alters the overall
charge but helps convert a protein into a rod-shaped
structure, which alters its size and shape.
18,19
Another approach for altering the apparent elec-
trophoretic mobility of an analyte is to use a solubility
equilibrium. As an example, we could include a second
phase within the running buffer into which the analyte
can partition as it moves through the system (such as
through the use of micelles, a method we will examine
in Section 23.4C). Because the analyte in such a system
will usually have different mobilities when it is present
in the running buffer or in the second phase, the parti-
tioning of an analyte between these regions leads to a
change in the analyte’s rate of travel through the elec-
trophoretic system. Physical interactions can also affect
analyte migration. For instance, DNA sequencing by gel
electrophoresis uses a porous support to separate DNA
strands of different lengths. The same strategy is used in
SDS-PAGE for protein separations.
(A
-
)
96943_23_ch23_p571-596 1/8/10 2:54 PM Page 575
576 Chapter 23 • Electrophoresis
Electroosmosis. Up until now we have examined
only the direct movement of an analyte in an electric
field. It is also possible for the running buffer to move
in such a field. This phenomenon can occur if there are
any fixed charges present in the system, such as on the
interior surface of an electrophoretic system or on a
support within this system (see Figure 23.6). The pres-
ence of these fixed charges attracts ions of opposite
charge from the running buffer and creates an electrical
double layer at the surface of the support. In the pres-
ence of an electric field, this double layer acts like a pis-
ton that causes a net movement of the buffer toward the
electrode of opposite charge versus the fixed ionic
groups. This process is known as electroosmosis and
results in a net flow of the buffer and its contents
through the system.
7
The extent to which electroosmosis affects the buffer
and analytes in electrophoresis is described by using a
term known as the electroosmotic mobility (or ).
7
This
term has the same units as the electrophoretic mobility .
The value of depends on such factors as the size of the
electric field, the type of running buffer that is being
employed, and the type of charge that is present on the
support. This relationship is described by Equation 23.4,
(23.4)
where E is the electric field, and are the dielectric con-
stant and viscosity of the running buffer, and is the zeta
potential (which represents the charge on the support).
Depending on the direction of buffer flow, electroos-
mosis can work either with or against the inherent migra-
tion of an analyte through the electrophoretic system. The
z
he
m
eo
=
A
e
zE
B
>h
m
eo
m
m
eo
overall observed electrophoretic mobility for an
analyte will be equal to the sum of its own electrophoretic
mobility and the mobility of the running buffer due to
electrosmotic flow .
(23.5)
In gel electrophoresis, electroosmotic flow is often small
compared to the inherent rate of analyte migration. This
is not usually true in capillary electrophoresis, where the
support has a relatively large charge and high surface
area compared to the volume of running buffer (see
Section 23.3).
23.2B Factors Affecting Band-Broadening
The same terms used to describe efficiency in chromatogra-
phy (e.g., the number of theoretical plates N and the height
equivalent of a theoretical plate H) can be used to describe
band-broadening in electrophoresis. Two particularly
important band-broadening processes in electrophoresis
are (1) longitudinal diffusion and (2) Joule heating.
Longitudinal Diffusion. You may recall from Chapter 20
that longitudinal diffusion occurs when a solute diffuses
away from the center of its band along the direction of
travel, causing this band to broaden over time and to
become less concentrated. One factor that affects the extent
of this band-broadening is the “size” of the diffusing solute,
or its solvated radius. Because larger analytes have slower
diffusion, they will be less affected by longitudinal diffusion
than smaller substances. The rate of this diffusion will also
decrease as we increase the viscosity of the running buffer
or lower the temperature of the system.
m
Net
= m + m
eo
(m
eo
)
(m)
(m
Net
)
(Ϫ)(ϩ)
Electroosmosis
Fixed charges
on support wall
Ions in
double layer
Other ions in
running buffer
؉
؉
؊؊؊؊؊؊؊؊
؉
؉
؊
؊
؊
؊
؊
؊
؊
؊
؊
؉
؉
؉؉
؉
؉
؉
؉
؉
؉
؉
؊
؊
؊
FIGURE 23.6 The production and effects of electroosmosis. This particular example
shows a support that has a negatively charged interior. Such a situation is often
encountered when working with a support that is an uncoated silica capillary. The
interior wall of this capillary has silanol groups at its surface, which can act as weak
acids and form a conjugate base with a negative charge. The extent of electroosmosis
in this case will depend on the pH of the running buffer, because this will affect the
relative amount of the silanol groups that are present in their neutral acid form or
charged conjugate base form.
96943_23_ch23_p571-596 1/8/10 2:54 PM Page 576
Section 23.3 • Gel Electrophoresis 577
The extent of longitudinal diffusion will depend on
the amount of time that is allowed for this process to
occur.
10
This time, in turn, will be affected in elec-
trophoresis by the size of the electric field, because lower
electric fields result in smaller migration velocities and
longer migration times.
22
Electroosmosis will also affect
the time needed for an electrophoretic separation and dif-
fusion. If electroosmosis moves in a direction opposite to
that desired for the separation of analytes, the effective
rate of travel for these analytes is decreased and the time
allowed for longitudinal diffusion is increased. If elec-
troosmosis instead occurs in the same direction as analyte
migration, longitudinal diffusion is decreased.
One way we can minimize the effects of longitudi-
nal diffusion in electrophoresis is to have an analyte
move through a porous support. If the pores of this sup-
port are sufficiently small, they will inhibit the move-
ment of analytes due to diffusion and help provide
narrower bands. If the pore size becomes too small, a
size-based separation will also be created. Although this
last feature is not always desirable, in some cases it can
be an advantage, such as in the sequencing of DNA by
gel electrophoresis.
Joule Heating. The most important band-broadening
process in electrophoresis is often Joule heating.
21-23
This
process is caused by heating that occurs whenever an
electric field is applied to the system. According to Ohm’s
law (see Chapter 14), placing a voltage V across a medium
with a resistance of R requires that a current of I be pres-
ent to maintain this voltage across the medium.
10
(23.6)
As current flows through the system, heat is gener-
ated. This heat production depends on the voltage, cur-
rent, and time t the current passes through the system, as
shown below.
(23.7)
As heat is produced, the temperature of the elec-
trophoretic system will begin to rise. This rise in tempera-
ture will increase longitudinal diffusion and lead to
increased band-broadening. In addition, if the heat is not
distributed uniformly throughout the electrophoretic sys-
tem, the temperature will not be the same throughout the
system. An uneven temperature will lead to regions with
different densities (causing mixing) and different rates of
diffusion, which results in even more band-broadening.
Other problems created by an increase in temperature
include possible degradation of the analytes or compo-
nents of the system and the evaporation of solvent from
the running buffer, the latter of which can alter the pH
and composition of the buffer. All of these factors lead to a
loss of reproducibility and efficiency in the system.
One way Joule heating can be decreased is by using a
lower voltage for the separation. A lower voltage, how-
ever, will lower the migration velocities of analytes and
give longer separation times. An alternative approach is to
Heat = V
#
I
#
t
Ohm’s law:
V = I
#
R
use more efficient cooling for the system, which would
allow higher voltages to be used and provide shorter sepa-
ration times. Another possibility is to add a support to the
electrophoretic system that minimizes the effects of Joule
heating due to uneven heat distribution and density gradi-
ents in the running buffer. Examples of these approaches
will be given later when we examine the methods of gel
electrophoresis and capillary electrophoresis.
Another factor that affects Joule heating is the ionic
strength of the running buffer. A lower ionic strength for
this buffer will lower heat production, because at low
ionic strengths there are fewer ions in this buffer. This
lower ionic strength creates a greater resistance R to cur-
rent flow at any given voltage because fewer ions are
available to carry the current. We can see from Ohm’s law
in Equation 23.6 that as R increases a smaller current is
needed at voltage V. This smaller current, in turn, will
create lower heat production, as shown by Equation 23.7.
Other Factors. Eddy diffusion (a process we discussed
in Chapter 20 for chromatography) is another factor that
can sometimes lead to band-broadening in electrophore-
sis. This type of band-broadening can occur if a support
is used to minimize the effects of Joule heating, a situa-
tion that creates multiple flow paths for analytes through
the support. If the support interacts with analytes, band-
broadening due to these secondary interactions will be
introduced as well; this extra band-broadening also
occurs when secondary interactions are used to adjust
analyte mobility, such as complexation reactions or parti-
tioning into a micelle. These latter effects are similar to
those described in Chapter 20 for stationary phase mass
transfer in chromatography. Broadening of the peaks
before or after separation can be another issue when deal-
ing with highly efficient systems, such as those used in
capillary electrophoresis.
Wick flow is another source of band-broadening that
occurs in gel electrophoresis.
19
In such a system, the gel is
kept in contact with the electrodes and buffer reservoirs
through the use of wicks. Because this support is often
open to air, the presence of any Joule heating will lead to
some evaporation of solvent in the running buffer from
the support. As this solvent is lost, it is replenished by the
flow of more solvent through the wicks and from the
buffer reservoirs. This flow leads to a net movement of
buffer from each reservoir towards the center of the sup-
port. The rate of this flow depends on the rate of solvent
evaporation, so it will increase with the use of a high volt-
age or high current. The extent of this flow varies across
the support, with the fastest rates occurring furthest from
the center of the support.
23.3 GEL ELECTROPHORESIS
23.3A What Is Gel Electrophoresis?
One of the most common types of electrophoresis is the
method of gel electrophoresis. This technique is an elec-
trophoretic method that is performed by applying a sample
96943_23_ch23_p571-596 1/8/10 2:54 PM Page 577
578 Chapter 23 • Electrophoresis
to a gel support that is then placed into an electric field.
17–20
Typical separations obtained by gel electrophoresis were
shown previously in Figures 23.1 and 23.4. In this type of
system, several samples are usually applied to the gel and
allowed to migrate along the length of the support in the
presence of an applied electric field. The separation is
stopped before analytes have left the end of the gel, with
the location and intensities then being determined.
It is important to remember in gel electrophoresis
that the velocity of an analyte’s movement will be related
to the distance it has traveled in the given separation time
(as represented by the migration distance). The farther
this distance is from the point of sample application, the
higher the migration velocity is for the analyte and the
larger its electrophoretic mobility. This migration dis-
tance will, in turn, be related to the size and charge of the
analyte and can be used in identifying such a substance.
23.3B How Is Gel Electrophoresis Performed?
Equipment and Supports. Some typical systems for
carrying out gel electrophoresis are shown in Figure 23.7.
These systems may have a support that is held in either a
vertical or horizontal position. This support contains a
running buffer with ions that carry a current through the
support when an electric field is applied. To replenish this
buffer and its components as they move through the sup-
port or evaporate, the ends of the support are placed in
contact with two reservoirs that contain the same buffer
solution and the electrodes. Once samples have been
placed on the support, the electrodes are connected to a
power supply and used to apply a voltage across the sup-
port. This electric field is passed through the system for a
given amount of time, causing the sample components to
migrate. After the electric field has been turned off, the gel
is removed and examined to locate the analyte bands.
The type of support we use in such a system will
depend on our analytes and samples.
17,19
Cellulose
acetate, filter paper, and starch are useful supports for
work with relatively small molecules, like amino acids and
nucleotides. Electrophoresis involving large molecules can
be carried out on agarose, a support that we discussed in
Chapter 22. The resulting approach is known as “agarose
electrophoresis.” In addition to its low nonspecific binding
for many biological compounds, agarose has a low inher-
ent charge. Agarose also has relatively wide pores that
allow it to be employed in work with large molecules, such
as during the sequencing of DNA.
The most common support used in gel electrophoresis
is polyacrylamide. This combination is often referred
to as polyacrylamide gel electrophoresis, or PA G E .
17–19
Polyacrylamide is a synthetic, transparent polymer that is
prepared as shown in Figure 23.8. It can be made with a
variety of pore sizes that are smaller than those in agarose
and of a size more suitable for the separation of proteins and
peptide mixtures. Like agarose, polyacrylamide has low
nonspecific binding for many biological compounds and
does not have any inherent charged groups in its structure.
Sample Application. The samples in gel electrophore-
sis are applied to small “wells” that are made in the gel
during its preparation (see Figures 23.4 and 23.7). A sam-
ple volume of 10–100 µL is then placed into one of these
wells by using a micropipette. These sample volumes
help provide a sufficient amount of analyte for later
detection and collection, but they also create a danger of
introducing band-broadening by creating a large sample
band at the beginning of the separation.
A common approach to create narrow sample bands
is to employ two types of gels in the system: a “stacking
gel” and a “running gel.”
19
The running gel is the support
used for the electrophoretic separation of substances in the
sample. In a vertical gel electrophoresis system, this gel is
formed first and is located throughout the middle and
lower section of the system (see right-hand portion of
Figure 23.7). The stacking gel has a lower degree of cross-
linking (giving it larger pores) and is located on top of the
running gel. The stacking gel is also the section of the sup-
port in which the sample wells are located. After a sample
has been placed in the wells and an electric field has been
applied, analytes will travel quickly through the stacking
gel until they reach its boundary with the running gel.
Vertical gel electrophoresis systemHorizontal gel electrophoresis system
FIGURE 23.7 Horizontal (image on the left) and vertical (image on the right) gel electrophoresis
systems. (Reproduced with permission from Thermo Fisher Scientific)
96943_23_ch23_p571-596 1/8/10 2:54 PM Page 578
Section 23.3 • Gel Electrophoresis 579
N
H
N
H
H
2
C
Ammonium Persulfate/TEMED
Bisacrylamide
Polyacrylamide
Acrylamide
NH
2
H
2
C
NH
NH
O
O
CONH
2
CONH
2
CONH
2
CONH
2
CONH
2
CONH
2
CONH
2
CONH
2
OO
ϩ
O
FIGURE 23.8 Preparation of a polyacrylamide gel. In this
reaction, acrylamide is used as the monomer and
bisacrylamide is used as a cross-linking agent. The reaction of
these two agents is begun by adding ammonium persulfate,
where persulfate forms sulfate radicals that
cause the acrylamide and bisacrylamide to combine. N,N,N ,
N -Tetramethylethylenediamine (TEMED) is added to this
mixture as a reagent that stabilizes the sulfate radicals. The
size of the pores that are formed in the polyacrylamide gel
will be related to how much bisacrylamide is used vs.
acrylamide. As the amount of bisacrylamide is increased, more
cross-linking occurs and smaller pores are formed in the gel.
As less bisacrylamide is used, larger pores are formed, but the
gel also becomes less rigid.
¿
¿
(SO
4
-
)(S
2
O
8
2-
)
These substances will then travel much more slowly,
allowing other parts of the sample to catch up and to form
a narrower, more concentrated band at the top of the run-
ning gel. The result is a system that can use larger sample
volumes without introducing significant band-broadening
into the final electrophoretic separation.
Detection Methods. There are several ways analytes
can be detected in gel electrophoresis. Analyte bands can
be examined directly on the gel or they can be transferred
to a different support for detection. Direct detection can
sometimes be performed visually (when dealing with
intensely colored proteins like hemoglobin) or by using
absorbance measurements and a scanning device known
as a densitometer.
9,20
The most common approach for detection in gel elec-
trophoresis is to treat the support with a stain or reagent
that makes it easier to see the analyte bands. Examples of
stains that are used for proteins are Amido black,
Coomassie Brilliant Blue, and Ponceau S. These stains are
all highly conjugated dyes with large molar absorptivities
(see Chapter 18). Silver nitrate is used in a method known
as silver staining to detect low concentration proteins. DNA
bands can be detected by using ethidium bromide (see
Chapter 2). When separating enzymes, the natural cat-
alytic ability of these substances can be employed for their
detection, as occurs when using the fluorescent compound
NAD(P)H to detect enzymes that generate this substance
in their reactions.
19,20
Another possible approach for detection in gel elec-
trophoresis is to transfer a portion of the analyte bands to
a second support (such as nitrocelluose), where they are
reacted with a labeled agent. This approach is known as
“blotting.”
19
There are several blotting methods. One
such method is a Southern blot (named after its discov-
erer Edwin Southern, a British biologist).
24
A Southern
blot is used to detect specific sequences of DNA by hav-
ing these sequences bind to an added, known sequence of
DNA that is labeled with a radioactive tag or with a
label that can undergo chemiluminescence. A Northern
blot (which was developed after the Southern blot) is
similar, but is instead used to detect specific sequences of
RNA by using a labeled DNA probe.
25
Another type of blotting method is a Western
blot.
26,27
A Western blot is used to detect specific proteins
on an electrophoresis support. In this technique, proteins
are first separated on a support by electrophoresis and
then blotted onto a second support like nitrocellulose or
nylon. The second support is then treated with labeled
antibodies that can specifically bind the proteins of inter-
est. After the antibodies and proteins have been allowed
to form complexes, any extra antibodies are washed
away and the remaining bound antibodies are detected
through their labels, indicating whether there is any of
the protein of interest present. This method is used to
screen blood for the HIV virus by looking for the pres-
ence of proteins from this virus in samples.
There also has been growing interest in the use of
instrumental methods for analyzing bands on elec-
trophoresis supports. For instance, mass spectrometry is
becoming a popular method for determining the molecu-
lar mass of a protein in a particular band. Such an analy-
sis is accomplished by removing a portion of the band
from the gel (or sometimes by looking at the gel directly)
and examining this band by matrix-assisted laser
desorption/ionization time-of-flight mass spectrometry
(MALDI-TOF MS) (see Box 23.1). This approach makes it
possible to identify a particular analyte (such as a pro-
tein) by its molecular mass even when there are many
similar analytes in a sample.
23.3C What Are Some Special Types of
Gel Electrophoresis?
Sodium Dodecyl Sulfate Polyacrylamide Gel
Electrophoresis. Whenever a porous support is pres-
ent in an electrophoretic system, it is possible that large
analytes may be separated based on their size as well as
their electrophoretic mobilities. This size separation
occurs in a manner similar to that which occurs in size-
exclusion chromatography and can be used to determine
the molecular weight of biomolecules. This type of
analysis is accomplished for proteins in a technique
known as sodium dodecyl sulfate polyacrylamide gel
electrophoresis, or SDS-PAGE (see Figure 23.10).
18,19
(
32
P)
96943_23_ch23_p571-596 1/8/10 2:54 PM Page 579
580 Chapter 23 • Electrophoresis
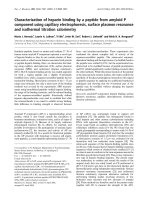
In SDS-PAGE, the proteins in a sample are first dena-
tured and their disulfide bonds broken through the use of a
reducing agent. This pretreatment converts the proteins
into a set of single-stranded polypeptides. These polypep-
tides are then treated with sodium dodecyl sulfate (SDS), a
surfactant with a nonpolar tail and a negatively charged
sulfate group. The nonpolar end of this surfactant coats
each protein, forming roughly linear rods that have an exte-
rior layer of negative charge. The result for a mixture of
proteins is a series of rods with different lengths but similar
charge-to-mass ratios. Next, these protein rods are passed
through a porous polyacrylamide gel in the presence of an
electric field. The negative charges on these rods (from the
SDS coating) cause them to all move toward the positive
electrode, while the pores of the gel allow small rods to
travel more quickly to this electrode than large rods.
At the end of an SDS-PAGE run, the positions of
protein bands from a sample are compared to those
obtained for known protein standards applied to the
same gel. This comparison is made either qualitatively or
by preparing a calibration curve. The calibration curve is
typically prepared by plotting the log of the molecular
weight (MW) for the protein standards versus their
migration distance (d
m
) or retardation factor (R
f
). The retar-
dation factor for an analyte band in SDS-PAGE is calcu-
lated by using the ratio of a protein’s migration distance
over the migration distance for a small marker com-
pound (d
s
), where . The resulting plot of
log(MW) versus d
m
or R
f
gives a curved response with an
intermediate linear region for proteins with sizes that are
neither totally excluded from the pores nor able to access
all pores in the support.
R
f
= d
m
>d
s
BOX 23.1
Matrix-Assisted Laser Desorption/Ionization Time-of-Flight Mass Spectrometry
Matrix-assisted laser desorption/ionization time-of-flight mass
spectrometry (MALDI-TOF MS) is a type of mass spectrometry in
which a special matrix capable of absorbing light from a laser is
used for chemical ionization. The term “MALDI” was first used in
1985 to describe the use of a laser to cause ionization of the
amino acid alanine in the presence of tryptophan (the “matrix” in
this case).
28
In 1988 it was shown almost simultaneously by two
research groups, one in Germany and one in Japan, that MALDI-
TOF MS could also be employed in work with large biomolecules,
such as proteins.
29,30
The value of this method was recognized in
2002 when members of both these groups shared the Nobel
Prize in chemistry for the development of this technique.
Figure 23.9 shows the typical way in which a sample is
analyzed by MALDI-TOF MS. First, the sample is mixed with a
matrix that can readily absorb UV light. This mixture is then
placed on a holder in the MALDI-TOF instrument, where pulses
of a UV laser are aimed at the sample and matrix. As the matrix
absorbs some of this light, it transfers its energy to molecules in
the sample, causing these to form ions. These ions are then
passed through an electric field into a time-of-flight mass ana-
lyzer, where ions of different mass-to-charge ratios will travel at
different velocities. The number of ions arriving at the other
end is measured at various times, allowing a mass spectrum to
be obtained for analytes in the sample.
31
MALDI-TOF MS is a soft ionization approach that results
in a large amount of molecular ions and few, if any, fragment
ions for most analytes. This method also has a low background
signal, a high mass accuracy, and can be used over a wide
range of masses. These properties make MALDI-TOF MS valu-
able in the study and identification of proteins after they have
been separated by techniques like SDS-PAGE or 2-dimensional
(2-D) electrophoresis (see Section 23.3). MALDI-TOF MS can
also be used to look at peptides, polysaccharides, nucleic acids,
and some synthetic polymers.
31,32
Sample ions
(to mass spectrometer)
Sample in matrix that
absorbs UV light
Pulsed N
2
laser beam
(337 nm)
؉
؉
؉
؉
؉
؉
؉
؉
Drift tube
Detector
Electric field
Laser
Ionization
chamber
FIGURE 23.9 The analysis of a sample by MALDI-TOF MS. The
individual steps in this analysis are described in the text.
96943_23_ch23_p571-596 1/8/10 2:54 PM Page 580
Section 23.3 • Gel Electrophoresis 581
mobility will become zero, causing the analyte to stop
migrating.
1
The result is a series of tight bands, where
each band appears at the point where pH = pI for a
given zwitterion.
The reason isoelectric focusing produces tight
bands for these analytes is that even if a zwitterion
momentarily diffuses out of the region where the pH is
equal to its pI, the system will tend to “focus” the zwitte-
rion back into this region (see Figure 23.11). This focusing
occurs because of the way the pH gradient is aligned
with the electric field. High pH’s occur toward the nega-
tive electrode, so as solutes diffuse out of their band and
Denature proteins and
reduce disulfide bonds
Coat proteins with SDS
Protein separation
Sample pretreatment
(a)
(b)
(ϩ)
Sample 1
(Ϫ)
Sample 2Standard
High MW
Low MW
Protein migration
؊
؊
؊
؊
؊؊
؊
؊
؊
؊
؊
؊
؊
؊
؊
؊
؊
؊
FIGURE 23.10 Preparation of proteins and their separation by sodium dodecyl
sulfate polyacrylamide gel electrophoresis (SDS-PAGE).
EXERCISE 23.2 Using SDS-PAGE for Estimating
the Molecular Mass of a Protein
The proteins in the standard in Figure 23.10 have molecu-
lar weights (from top-to-bottom) of 200, 116, 97, 66, 45, 31,
23, and 14 kDa. What are the molecular weights of the
proteins in sample 1?
SOLUTION
The first band in sample 1 is at approximately the same loca-
tion as the 66 kDa band in the standard sample. The second
band in sample 1 appears between the 45 kDa and 31 kDa
bands in the standard, giving this second protein a mass of
roughly 38 kDa. A similar analysis for the second sample
gives proteins with estimated masses of 31 and 97 kDa.
Isoelectric Focusing. Another type of electrophore-
sis that often employs supports is isoelectric focusing
(IEF).
10
IEF is a method used to separate zwitterions
(substances with both acidic and basic groups, as dis-
cussed in Chapter 8). Zwitterions are separated in IEF
based on their isoelectric points by having these com-
pounds migrate in an electric field across a pH gradi-
ent. In this pH gradient, each zwitterion will migrate
until it reaches a region where the pH is equal to its
isoelectric point. At this point, the zwitterion will no
longer have any net charge and its electrophoretic
(ϩ)(ϩ)
؉؊
؊
؉
؉؊
؉؊
(Ϫ)(Ϫ)
Low
High
pH
pH Ͻ pI
pH Ͼ pI
pH ϭ pI
FIGURE 23.11 Isoelectric focusing.
96943_23_ch23_p571-596 1/8/10 2:54 PM Page 581
582 Chapter 23 • Electrophoresis
toward this region they will take on a more negative
charge and be attracted back to the positive electrode. At
the same time, zwitterions that move toward the positive
electrode and region of lower pH will acquire a more pos-
itive charge and be attracted back toward the negative
electrode. It is this focusing property that makes it possi-
ble for IEF to separate zwitterions with only very small
differences in their pI values.
To obtain a separation in IEF, it is necessary to have
a stable pH gradient. This pH gradient is produced by
placing in the electric field a mixture of small reagent
zwitterions known as ampholytes. These are usually
polyprotic amino carboxylic acids with a range of pK
a
values.
6
When these ampholytes are placed in an electric
field, they will travel through the system and align in the
order of their pK
a
values. The result is a pH gradient that
can be used directly or by cross-linking the ampholytes to
a support to keep them stationary in the system.
IEF is a valuable tool for separating proteins or
other compounds that contain both positive and negative
charges. These include some drugs, as well as bacteria,
viruses, and cells. Applications of this method range
from biotechnology and biochemistry to forensic analysis
and paternity testing. IEF is particularly useful in provid-
ing high-resolution separations between different forms
of enzymes or cell products. For instance, it is possible
with this method to separate proteins with differences in
pI values as small as 0.02 pH units.
2-Dimensional Electrophoresis. Another way gel
electrophoresis can be utilized is in two-dimensional (or
2-D) electrophoresis, which is a high-resolution tech-
nique used to look at complex protein mixtures.
19,33
In
this method, two different types of electrophoresis are
conducted on a single sample. The first of these separa-
tions is usually based on a isoelectric point, as accom-
plished by using isoelectric focusing. The second
separation method (SDS-PAGE) is according to size.
A typical 2-D electrophoresis method is illustrated
in Figure 23.12. First, a small band of sample is applied
to the top of a support for use in isoelectric focusing.
The support used in this case is typically agarose or a
polyacrylamide gel with large pores. After this first
separation has been finished, some proteins will have
been separated based on their pI values, but there may
still be many proteins with similar isoelectric points
and overlapping bands. A further separation is
obtained by turning this first gel on its side and placing
it at the top of a second support (a polyacrylamide gel)
for use in SDS-PAGE. This process gives a separation
according to size, in which each band from the first sep-
aration has its own lane on the SDS-PAGE gel. The
result is a series of peaks that are now separated in two
dimensions (one based on pI and the other on size)
across the gel. The fact that two different characteristics
of each protein are used in their separation makes it
possible to resolve a much larger number of proteins
than is possible by either IEF or SDS-PAGE alone.
After a 2-D separation has been finished, the protein
bands can be detected using the methods discussed in
Section 23.3B. Staining with Coomassie blue or silver
nitrate is often used in the location and measurement of
these bands. Analysis by mass spectrometry is another
option. Other issues to consider are the interpretation
and analysis of the many protein bands that can occur in
a single sample. This analysis requires the use of comput-
ers to help image and catalog the location of each band
and to correlate this information with that obtained by
other methods, such as mass spectrometry.
23.4 CAPILLARY ELECTROPHORESIS
23.4A What Is Capillary Electrophoresis?
Another type of electrophoresis is the method of
capillary electrophoresis (CE). CE is a technique that
separates analytes by electrophoresis and that is carried
out in a capillary. This method was first reported in the
late 1970s and early 1980s and is sometimes known as
“capillary zone electrophoresis.”
23,34
CE in its current
form is typically conducted in capillaries with inner
diameters of 20–100 µm and lengths of 20–100 cm.
7
The
use of these narrow-bore tubes provides efficient removal
of Joule heating by allowing this heat to be quickly dissi-
pated to the surrounding environment.
8,17,23
This
removal of heat helps to decrease band-broadening and
provides much more efficient and faster separations than
gel electrophoresis (see Figure 23.13).
One reason capillary electrophoresis is more efficient
than gel electrophoresis is that Joule heating is greatly
reduced as a source of band-broadening. Also, capillary
electrophoresis is often used with no gel or support pres-
ent, which eliminates eddy diffusion and secondary inter-
actions with the support (other than the capillary wall).
The result is that longitudinal diffusion now becomes the
main source of band-broadening. Under these conditions,
(ϩ)(ϩ)
(Ϫ)(Ϫ)
Second separation
SDS-Page
First separation
Isoelectric focusing
Low pH/pI
High pH/pI
Separate
by pI
Low MW
High MW
Separate
by MW
FIGURE 23.12 Two-dimensional gel electrophoresis, using a
combination of isoelectric focusing and SDS-PAGE as an example.
96943_23_ch23_p571-596 1/8/10 2:54 PM Page 582
Section 23.4 • Capillary Electrophoresis 583
Time (min)
0222015
C
G
H
E
D
A,B
I
F
K
L
J
105
Response
FIGURE 23.13 An early example of capillary electrophoresis, used
here use for the separation of dansylated amino acids (represented
by peaks A–L). (Reproduced with permission from J.W. Jorgenson
and K.D. Lukacs, “Capillary Zone Electrophoresis,” Science, 222
(1983) 266–272.)
the number of theoretical plates (N) expected for this sys-
tem is given by the following equations,
(23.8)
where D is the diffusion coefficient of the analyte, is the
electrophoretic mobility of the analyte, E is the electric
field strength, L is the total length of the capillary, L
d
is
the distance from the point of injection to the detector,
and V is the applied voltage (where E = V/L).
8
Equation 23.8 shows that the value of N (represent-
ing the efficiency of the CE system) will increase as we use
higher electric fields and voltages. This result makes sense
because higher electric fields will cause the analyte to
migrate faster and spend less time in the capillary. These
shorter migration times will decrease band-broadening
because less time is allowed for longitudinal diffusion.
The result is a fast separation with a high efficiency and
narrow peaks.
m
N =
mEL
d
2D
or N =
mVL
d
2DL
20.0 kV and at 30.0 kV? What factors may cause lower
values for N to be obtained?
SOLUTION
We can use Equation 23.8 along with the conditions given
in Exercise 23.1 and the electrophoretic mobility calcu-
lated earlier for protein 1 to get the expected value for N
at 20.0 kV.
If we increase the applied voltage from 20.0 to 30.0 kV
(or by 1.5-fold), Equation 23.8 indicates we will see a
proportional increase of 1.5-fold in N from to
. Factors that might give lower plate
numbers include the presence of adsorption between
the protein and capillary wall, extra-column band-
broadening, or an increase in Joule heating as the volt-
age is increased.
1.9 : 10
6
plates
1.3 * 10
6
= 1.3 * 10
6
theoretical plates
N =
A
1.80 cm
2
>kV
#
min
B
#
20.0 kV
#
22.0 cm
2
#
A
2.0 * 10
- 7
cm
2
>s
B
#
(60 s>min)
#
25.0 cm
EXERCISE 23.3 The Effect of Electric Field
Strength on Efficiency in
Capillary Electrophoresis
The protein 1 in Exercise 23.1 has a diffusion coefficient
of approximately in its running buffer.
If longitudinal diffusion is the only significant band-
broadening process present during the separation of
this protein by capillary electrophoresis, what is the
maximum number of theoretical plates that would be
expected for this protein’s peak at an applied voltage of
2.0 * 10
- 7
cm
2
>s
Besides providing efficient separations, we have
seen that the use of high electric fields in capillary elec-
trophoresis also reduces the time needed for a separa-
tion. This relationship can be shown by rewriting
Equation 23.3 to give the expected migration time for an
analyte in terms of the electric field, the electrophoretic
mobility of the analyte, and the length of the capillary.
(23.9)
For instance, Equation 23.9 indicates that the migration
time for the protein in Exercise 23.3 will decrease by
1.5-fold (from 15.3 to 10.2 min) if we increase the
applied voltage from 20.0 to 30.0 kV. The result is a sit-
uation in which we can improve both the efficiency and
speed of a separation by increasing the voltage. This
feature has made capillary electrophoresis popular for
the analysis of complex samples, such as those used in
DNA sequencing. Unfortunately, there is a limit to how
high the voltage can be increased before Joule heating
again becomes important. Most CE systems are capable
of using voltages of up to 25–30 kV, but significant
Joule heating can appear at lower voltages.
23.4B How Is Capillary Electrophoresis
Performed?
Equipment and Supports. Besides being faster and
more efficient than gel electrophoresis, capillary elec-
trophoresis is easier to perform as part of an instrumen-
tal system. An example of a CE system is shown in
Figure 23.14.
8,21
Along with the capillary, this system
includes a power supply and electrodes for applying the
electric field, two containers that create a contact
t
m
=
L
d
L
mV
=
L
d
mE
96943_23_ch23_p571-596 1/8/10 2:54 PM Page 583
584 Chapter 23 • Electrophoresis
between these electrodes and the solution within the
capillary, an on-line detector, and a means for injecting
samples onto the capillary. Because these instruments
can use voltages of up to 25–30 kV, they include safety
features that protect the user from the high-voltage
region and that can turn off this voltage when the system
is opened for maintenance or the insertion of samples
and reagents.
The capillary in a CE system is typically made of fused
silica. This capillary can be used directly or it can be modi-
fied to place various coatings on its interior surface. An
uncoated silica capillary can lead to a significant amount of
flow due to electroosmosis when working at a neutral or
basic pH, due to deprotonation of the silica’s surface silanol
groups. One useful feature of this electroosmosis is it tends
to cause all analytes, regardless of their charge, to travel in
the same direction through the CE capillary. This effect
means that a sample containing many types of ions can be
injected at one end of the capillary (at the positive elec-
trode), with electroosmosis then carrying these through to
the other end (to the negative electrode) and past an on-line
detector. This format is called the “normal polarity mode” of
CE.
8
It is important to remember in this situation that a sep-
aration of ions will still occur, but that the observed mobility
will now be equal to the sum of an analyte’s inherent elec-
trophoretic mobility plus the mobility created by electroos-
mosis (see Equation 23.5). This effect on observed mobility
will, in turn, affect the observed migration time and the effi-
ciency and resolution obtained for the separation.
Although many analytes will travel in the same
direction as electroosmotic flow through a CE system, it
is possible for some to have migration rates faster than
electroosmosis, which will carry them in the opposite
direction. The analysis of these ions in a silica capillary is
performed by injecting them at the end by the negative
electrode and allowing them to migrate toward the posi-
tive electrode and against electroosmotic flow. This
method is known as the “reversed polarity mode” of CE.
8
In addition, electroosmotic flow can be altered by chang-
ing the pH (which changes the degree of deprotonation
and charge on silica), or by placing a coating on the sur-
face of the support. In this second case, a neutral coating
helps to reduce electroosmosis while a positively charged
coating will reverse the direction of this flow toward the
positive rather than negative electrode.
Injection Techniques. There are two features of capillary
electrophoresis that place special demands on how samples
can be injected. First, the small volume of a CE capillary
must be considered. A typical 50 µm I.D. 25 cm long cap-
illary for CE will contain only of running buffer.
Another factor to consider is the high efficiency of capillary
electrophoresis. Both of these factors restrict the sample vol-
umes that can be injected without introducing significant
band-broadening (< 10 nL for a volume capillary).
8
There are two techniques that make it possible to
inject these small sample volumes onto a CE system. The
first technique is hydrodynamic injection, which uses a dif-
ference in pressure to deliver a sample to the capillary.
This method can be carried out by placing one end of the
capillary into the sample in an enclosed chamber and
applying a pressure to this chamber for a fixed period of
time, where the amount of injected sample will depend on
the size of the pressure difference and the amount of time
that this pressure is applied. Once the sample has entered
the capillary, the separation is begun after the capillary
0.5 mL
0.5 mL
*
Net migration
Data acquisition
(and control)
Detector
High voltage
power suppl
y
Capillary
Inlet
reservior
or sample
Outlet
reservior
(Ϫ) Electrode(ϩ) Electrode
FIGURE 23.14 General design of a capillary electrophoresis system, and a commercial instrument for
capillary electrophoresis. (The picture on the right is courtesy of Beckman Instruments.)
96943_23_ch23_p571-596 1/8/10 2:54 PM Page 584
Section 23.4 • Capillary Electrophoresis 585
Conditions after sample stacking
Initial conditions
Separation buffer
(higher ionic strength
and conductivity)
Sample
(low ionic strength
and conductivity)
Sample and buffer
interface
(Ϫ)(ϩ)
(Ϫ)(ϩ)
؉
؉
؉
؉
؉
؉
؉
؉
FIGURE 23.15 Principle of sample self-stacking.
has been put back into contact with the running buffer
and electrodes. A second technique that allows the injec-
tion of small sample volumes is electrokinetic injection. This
method again begins by placing the capillary into the
sample, but an electrode is also now in contact with the
sample. When an electric field is applied across the capil-
lary, electroosmostic flow and the electrophoretic mobility
of the analytes cause them to enter the capillary. The
amount of each analyte that is injected in this method will
depend on the analyte’s electrophoretic mobility, the elec-
tric field, and the time over which this field is applied.
8
There are various methods for concentrating sam-
ples and providing narrow analyte bands in CE. One
such method is sample stacking (see Figure 23.15).
21
Sample stacking occurs when the ionic strength (and
therefore the conductivity) of the sample is less than that
of the running buffer. When an electric field is applied to
such a system, analytes will migrate quickly through the
sample matrix until they come to the boundary between
the sample and running buffer. Because the running
buffer has a higher ionic strength than the sample, the
rate of analyte migration decreases at this boundary. This
decrease in migration rate causes the analytes to concen-
trate into a narrower band as they enter the running
buffer. The overall effect is similar to what occurs when
using stacking gels in traditional electrophoresis.
Detection Methods. Examples of detection methods
that are used for capillary electrophoresis are shown in
Table 23.1. Many of these methods are also used in liquid
chromatography (see Chapter 22).
8,21
An important dif-
ference between detection in LC and CE is the need in
CE for methods that can work with very small sample
sizes. This need is a result of the small injection volumes
that are required in capillary electrophoresis to avoid
excessive band-broadening. Selective monitoring meth-
ods that work well for this purpose are electrochemical
and fluorescence detection. Ultraviolet-visible (UV-vis)
absorbance, conductance, and mass spectrometry detec-
tion are also often employed in CE.
Another difference between detection in LC and
CE concerns how their signals vary with analyte reten-
tion or migration. In LC, all analytes pass at the same
flow rate (that of the mobile phase) through the detec-
tor and spend the same amount of time in this device.
This effect makes it possible to directly compare the
peak areas of two analytes with different retention
times. However, in capillary electrophoresis analytes
with different migration times also spend different
amounts of time in the detector. A correction must be
made for this difference if we wish to compare the
areas of two analytes in the same CE run. We can make
this adjustment by using a corrected peak area (A
c
),
which is equal to the ratio of the measured peak area
(A) for an analyte divided by its migration time.
(23.10)A
c
= A>t
m
TABLE 23.1 Properties of Common Capillary Electrophoresis Detectors*
Detector Name Compounds Detected Detection Limits
General detectors
Ultraviolet-visible (UV/vis) absorbance detector Compounds with chromophores
10
- 13
–10
- 16
mol
Selective detectors
Fluorescence detector Fluorescent compounds
10
- 15
–10
- 17
mol
Laser-induced fluorescence detector Fluorescent compounds
10
- 18
–10
- 20
mol
Conductivity detector Ionic compounds
10
- 15
–10
- 16
mol
Electrochemical detector Electrochemically active compounds
10
- 18
–10
- 19
mol
Structure-specific detectors
Mass spectrometry Compounds forming gas-phase ions
10
- 16
–10
- 17
mol
*These data are for commercial instruments.
96943_23_ch23_p571-596 1/8/10 2:54 PM Page 585
586 Chapter 23 • Electrophoresis
This correction allows areas for different analytes to be
compared, as well as areas that are obtained for the same
analyte under different electrophoretic conditions.
Along with the various detection methods we dis-
cussed for liquid chromatography in Chapter 22, another
detection approach that is used in capillary electrophoresis
is laser-induced fluorescence (LIF).
6,8,21
This method
employs a laser to excite a fluorescent compound, allowing
the detection of this agent through its subsequent emission
of light. There are several advantages to using a laser as the
excitation source. First, the laser is monochromatic and has
a high intensity, which allows for the selective and strong
excitation of a compound with an excitation spectrum that
overlaps with the emission wavelength of the laser. Also,
the laser beam can be focused as a very narrow beam. This
feature is extremely valuable in work with the small-bore
capillaries found in capillary electrophoresis. One limita-
tion of LIF detection is it does require an analyte that is nat-
urally fluorescent or that can be converted into a fluorescent
derivative. This second option makes use of a fluorescent
tag like fluorescein or rhodamine (see Chapter 18).
LIF detection with CE was used in the automated
DNA sequencing systems that made early completion of
the Human Genome Project possible. This detection
involved the use of several fluorescent dyes, one for each of
the four terminating nucleotides present during the Sanger
reaction. These labeled DNA strands were then separated
based on their lengths by capillary electrophoresis (see
Figure 23.16). It was possible to further increase the speed
of this analysis by using a single laser beam to simultane-
ously examine a whole array of capillaries, each sequencing
a different segment of DNA. The utilization of multiple
EXERCISE 23.4 Correcting Peak Areas for
Analyte Migration Times
Proteins 1 and 2 in Exercise 23.1 have measured areas of
1290 and 1360 units at 20.0 kV when examined by an
absorbance detector. If it is known that these two proteins
have a similar response to the detector, what is the cor-
rected area and relative amount of each protein in the
given sample?
SOLUTION
The migration times for these proteins (given in
Exercise 23.1) are 15.3 min and 16.2 min. Placing these
data into Equation 23.10 along with the measured peak
areas gives the following results.
If these proteins have a similar response to the detector,
then we can say from these corrected areas that there is
approximately the same amount of both proteins in the
sample. If we had used the uncorrected areas for this cal-
culation, we would have incorrectly concluded that pro-
tein 2 was present at a greater level.
Protein 2:
A
c,2
=
A
1360
B
>
A
16.2 min
B
= 84.0
Protein 1:
A
c,1
=
A
1290
B
>
A
15.3 min
B
= 84.3
Relative migration time (scan no.)
4800 5000 5200 5400
403020 5010
AAAAAAAAAAT T T T T T T T TT TGGGGGGGGGGGGGGG C CCCCCCCCCCC CC
5600
Relative signal
Detected Sequence
FIGURE 23.16 DNA sequencing by a capillary electrophoresis system. The top panel shows the original electrophoretic data, and the
bottom panel shows the same data after they have been processed to determine the nucleotide sequence of the DNA segment being
examined (as given by the symbols A, C, T, and G). (Based on data from J. Bashkin, in Capillary Electrophoresis of Nucleic Acids, K.R.
Mitchelson and J. Cheng, Eds., Humana Press, Totowa, NJ, 2001, Chapter 7.)
96943_23_ch23_p571-596 1/8/10 2:54 PM Page 586
Section 23.4 • Capillary Electrophoresis 587
capillaries in a single CE system is known as capillary array
electrophoresis (CAE).
6,7,35
Such a system can examine many
DNA sequences at the same time, which increases sample
throughput and lowers the cost per analysis.
23.4C What Are Some Special Types of Capillary
Electrophoresis?
The main capillary electrophoresis method that has been
discussed up to this point is zone electrophoresis, in which
differences in the charge/size ratio of analytes is the only
means employed for their separation. It is possible to
include other chemical and physical interactions in a CE
system to give additional types of separations. Examples
include CE methods that separate analytes based on their
size, isoelectric points, or interactions with additives in the
running buffer. The use of CE in microanalytical systems
has also been a topic of great interest (see Box 23.2).
Capillary Sieving Electrophoresis. One useful fea-
ture of gel electrophoresis is the ability of some sup-
ports to separate analytes based on size, as occurs for
proteins in SDS-PAGE. The same effect can be obtained
in capillary electrophoresis by including an agent in
the CE system that “sieves” the analytes, or
separates them based on size. This approach is known
BOX 23.2
Analytical Chemistry on a Chip
The development of silicon microchips created a revolution in
the computer and electronic industries. The result over the past
few decades has been a continuous decrease in the size of elec-
tronic devices and an increase in their capabilities. A similar
change is occurring in analytical chemistry. This change began
in 1979, when methods developed for the creation of
microchips where used to make a gas chromatographic system
on a silicon wafer.
36
In 1990 it was proposed that all of the
components of a chemical analysis could even be placed onto a
miniaturized system. The resulting device is now known as a
“lab-on-a-chip” or a micro total-analysis system .
37
Capillary electrophoresis was one of the first analytical
methods that was adapted for use on a microchip.
38
An exam-
ple of such a device is given in Figure 23.17. There are now
many reports that have used microchips for CE.
39–41
One fea-
ture that makes CE and microchips a good match is the need in
CE for narrow channels to avoid the effects of Joule heating. In
(mTAS)
addition, the elimination of Joule heating allows CE to work
with short separation channels and high electric fields, as is
used in Figure 23.17. The creation of an electric field to sepa-
rate analytes and to generate electroosmotic flow for CE is rel-
atively easy to obtain with a microchip by including electrodes
as part of this device. The availability of detection schemes like
LIF that are capable of working with small detection volumes is
also valuable when placing a CE system on a microchip.
38–41
CE is not the only analytical method that has been carried
out on microchips. Other methods have included liquid chro-
matography, gel electrophoresis, biosensing, water analysis, flow
injection analysis, and solid-phase extraction. There are several
potential advantages of using microchips with these techniques.
One is the small sample requirements of these devices. The abil-
ity to make these systems fully portable or disposable are addi-
tional advantages. The possibility of making microchips on a
large scale and at a low cost are other attractive features.
39–41
Time [ms]
0.0 0.5 1.0 1.5
Response
Inject
Separation
channel
Injection
valve
Sample
Sample
waste
Buffer
Waste
2 mm
RB
DCF
FIGURE 23.17 Design of a microchip-based system for performing electrophoresis and the use of this
device in the fast separation of the dyes rhodamine B (RB) and dichlorofluorescein (DCF). (Reproduced
with permission from S.C. Jacobson, C.T. Culbertson, J.E. Daler, and J.M. Ramsey, Analytical Chemistry, 70
(1998) 3476–3480.)
96943_23_ch23_p571-596 1/8/10 2:54 PM Page 587
588 Chapter 23 • Electrophoresis
as capillary sieving electrophoresis (CSE).
7
A compar-
ison of the results of CSE and a size separation by gel
electrophoresis (e.g., by SDS-PAGE) is given in
Figure 23.18.
There are several ways we can perform capillary
sieving electrophoresis. The first way is to place a porous
gel in the capillary, like the polyacrylamide gels
employed in SDS-PAGE. This method is called capillary
gel electrophoresis (CGE).
7
One problem with these gels is
they are not always stable in the high electric fields used
in capillary electrophoresis and must frequently be
replaced. A second approach, and the one now used in
DNA sequencing by CE, is to add to the running buffer a
large polymer that can entangle with analytes and alter
their rate of migration. This approach provides a system
with better reproducibility and stability than those using
gels, because the polymer is continuously renewed as
the running buffer passes through the capillary.
Electrokinetic Chromatography. Ordinary capillary
electrophoresis works well for separating cations and
anions, but it cannot be used to separate neutral sub-
stances from each other. Instead, these substances migrate
as a single peak that travels with the electroosmotic flow. It
is possible to employ CE with such compounds if we place
in the running buffer a charged agent that can interact with
these substances. This approach is called electrokinetic
chromatography. One common way of carrying out this
method is to employ micelles as additives, giving a subset
of electrokinetic chromatography known as micellar
electrokinetic chromatography (MEKC).
7,21,42,43
A micelle is a particle formed by the aggregation of a
large number of surfactant molecules, such as sodium
dodecyl sulfate (SDS). We saw earlier that SDS has a long
nonpolar tail attached to a negatively charged sulfate
group. When the concentration of a surfactant like SDS
reaches a certain threshold level (known as the “critical
micelle concentration”), some of the surfactant molecules
come together to form micelles. If these micelles form in a
polar solvent like water, the nonpolar tails of the surfactant
will be on the inside of the aggregate (giving a nonpolar
interior), while the charged groups at the other end will be
on the outside by the solvent (see Figure 23.19).
When micelles based on SDS are placed into the running
buffer of a CE system, they will be attracted toward the posi-
tive electrode. If a sample with several neutral compounds is
now injected into this system, some of these neutral sub-
stances may enter the micelles and interact with their nonpo-
lar interior. This interaction involves a partitioning process
similar to that found in liquid–liquid extractions and some
types of liquid chromatography (see Chapters 20 and 22), in
which the micelles act as the “stationary phase.” Although
these neutral compounds normally travel with the electroos-
motic flow through the capillary, while they are in the micelles
they migrate with the micelles in the opposite direction. The
result is a separation of neutral compounds based on the
degree to which they enter the micelles. Micelles can also alter
the migration times for charged substances through partition-
ing and charge interactions between the analytes and micelles.
Other Methods. There are many other types of CE that
have been explored for use in chemical analysis and sepa-
rations. For example, isoelectric focusing can be carried
out in a capillary, creating the method of capillary isoelectric
focusing (CIEF).
7,21
This technique involves the production
of a pH gradient across the capillary for the separation of
5.40
4.62
4.88
5.14
4.36
Ϫ4.10
1.60 1.89 2.18 2.47
25,669
59,217
2.76 3.05
log(MW)
Normalized migration time (min)
200 kDa
66 kDa
97 kDa
116 kDa
14 kDa
21 kDa
31 kDa
45 kDa
246 108
Time (min)
FIGURE 23.18 Comparison of capillary electrophoresis and traditional SDS-PAGE in the separation and analysis
of proteins. The figure on the left shows an electropherogram obtained for a series of proteins with molecular
masses ranging from 14 to 200 kDa. The inset shows an SDS-PAGE gel for the same proteins. The calibration
curve on the right shows how the migration times for these proteins in CE are related to their molecular masses.
(Adapted with permission from Bio-Rad Laboratories.)
8
96943_23_ch23_p571-596 1/8/10 2:54 PM Page 588
Section 23.4 • Capillary Electrophoresis 589
zwitterions. One way CIEF can be conducted is shown in
Figure 23.20. In this example, the electrodes are in contact
with two different electrolyte solutions: (1) the
“catholyte,” which is a basic solution located by the cath-
ode, and (2) the “anolyte,” which is an acidic solution
located by the anode. The capillary contains a mixture of
ampholytes that will create a pH gradient when an elec-
tric field is applied between these electrodes. A coated
capillary is also used in this case to minimize or eliminate
electroosmotic flow. When a sample (generally a mixture
of proteins) is injected onto this system, its zwitterions
will migrate until they reach a region where the pH is
equal to their pI. Once these bands have formed, they are
pushed through the capillary and past the detector by
applying pressure to the system.
Another type of capillary electrophoresis occurs
when biologically related agents are placed as additives
in the running buffer. As analytes travel through this
buffer, their overall mobility will be affected by their
binding to these agents (see Figure 23.21). The result is a
method known as affinity capillary electrophoresis
(ACE).
7,21,44,45
One common use of ACE is in the separa-
tion of chiral analytes through the use of binding agents
like cyclodextrins or proteins (see Chapters 8 and 22).
This method can also be used in clinical and pharmaceu-
tical assays and for the study of biological interactions.
(Ϫ)(ϩ)
Net migration of
neutral analytes
ElectroosmosisMicelle migration
؊
؊
؊
؊
؊
؊
؊
؊
؊
؊
؊
؊
؊
؊
؊
؊
؊
؊
؊
؊
؊
؊
؊
؊
؊
؊
؊
؊
؊
؊
؊
؊
FIGURE 23.19 Micellar electrokinetic chromatography. The circles represent
analytes from the injected sample. A negatively charged surfactant such as
sodium dodecyl sulfate is used in this example, as represented by the circles that
contain negative charges and nonpolar tails.
(a)
Anolyte
solution
Catholyte
solution
(Ϫ) Electrode(ϩ) Electrode
Sample with
protein mixture
Detector
(b)
Focused
protein bands
Solution with
mixture of
amphyloytes
(Ϫ) Electrode(ϩ) Electrode
Pressure
Detector
FIGURE 23.20 Capillary isoelectric focusing. The diagram in (a) shows the initial
configuration of this system before an electric field is applied. The diagram in (b)
shows the separation of proteins from the original sample after the electric field has
been applied. These protein bands are later passed through the capillary and past the
detector by applying pressure to the system.
96943_23_ch23_p571-596 1/8/10 2:54 PM Page 589
590 Chapter 23 • Electrophoresis
(Ϫ)(ϩ)
Net migration
of analytes
ElectroosmosisLigand migration
FIGURE 23.21 Affinity capillary electrophoresis. The circles represent analytes
from the injected sample. The half-circles represent a binding agent for one or
more of these analytes that has been added to the running buffer.
Key Words
Capillary electrophoresis 582
Capillary sieving
electrophoresis 588
Electroosmosis 576
Electropherogram 574
Electrophoresis 571
Electrophoretic mobility 575
Gel electrophoresis 577
Isoelectric focusing 581
Joule heating 577
Laser-induced
fluorescence 586
Micellar electrokinetic
chromatography 588
Migration distance 573
Migration time 573
Northern blot 579
SDS-PAGE 579
Southern blot 579
Two-dimensional
electrophoresis 582
Western blot 579
Other Terms
Affinity capillary
electrophoresis 589
Ampholytes 582
Capillary array
electrophoresis 587
Capillary gel
electrophoresis 588
Capillary isoelectric
focusing 588
Densitometer 579
Electrokinetic injection 585
Electrokinetic
chromatography 588
Electroosmotic mobility 576
Hydrodynamic injection 584
MALDI-TOF MS 579
Micelle 588
Micro total-analysis
system 587
Moving boundary
electrophoresis 572
PAGE 578
Polyacrylamide 578
Retardation factor 580
Sample stacking 585
Silver staining 579
Sodium dodecyl sulfate 580
Wick flow 577
Zone electrophoresis 572
WHAT IS ELECTROPHORESIS?
1. Define “electrophoresis” and explain how this method is
used to separate chemicals.
2. What is “zone electrophoresis”? How does this technique
differ from “moving boundary electrophoresis”? Which of
these methods is more common in modern laboratories?
HOW IS ELECTROPHORESIS PERFORMED?
3. Define each of the following terms and explain how they are
used in electrophoresis.
(a) Migration distance
(b) Migration time
(c) Electropherogram
4. Chloride is found to migrate a distance of 35 cm in a capillary
electrophoresis system with a migration time of 5.63 min.
What is the migration velocity of chloride under these condi-
tions? At the same velocity, what distance would chloride
have traveled in 2.5 min?
5. A protein is found to migrate a distance of 3.2 cm in 30 min
when 100 V is applied to a 10 cm long polyacrymide gel. What
is the migration velocity of this protein? If an applied voltage
of 200 V is used instead, how long will it take the same protein
to migrate a distance the entire length of the 10 cm gel?
FACTORS AFFECTING ANALYTE MIGRATION
6. Explain why a charged substance will tend to move at a
constant velocity through an electric field. What forces are
involved in this process?
7. What is “electrophoretic mobility”? How is this term related
to the movement of a substance in an electric field? What
are some general factors that affect the size of the elec-
trophoretic mobility for an analyte?
8. A peptide is found to have a migration time of 8.31 min at
an applied voltage of 10.0 kV and on a capillary elec-
trophoresis system with a total length of 25.0 cm. The detec-
tor is located at 21.5 cm from the point of sample injection
and conditions are used so that electroosmotic flow is negli-
gible. What is the migration velocity of the peptide? What is
its electrophoretic mobility?
9. How would the migration velocity and migration time for
the peptide in the previous problem change if the voltage
Questions
96943_23_ch23_p571-596 1/8/10 2:54 PM Page 590
• Questions 591
was changed to 15.0 kV? What change, if any, would occur
in the electrophoretic mobility?
10. What are some examples of secondary interactions that can
affect analyte migration in electrophoresis?
11. Dicamba is a herbicide commonly used on broadleaf weeds.
Its major metabolite is dichlorosalicylic acid (DCSA). Both
compounds are weak acids. Dicamba has a single weak-acid
group, which is a carboxylic acid group with a pK
a
of 1.94.
DCSA has two weak-acid groups: a carboxylic acid group
with a pK
a
of 2.08 and a phenol group with a pK
a
of 8.60. A
separation of these compounds at pH 7.4 by capillary elec-
trophoresis (CE) gives a migration time of 2.05 min for
dicamba and 2.35 min for DSCA. The same compounds had
migration times of 2.06 min and 4.1 min at pH 10.0.
46
Explain why there is a large shift in the migration time for
DCSA over this pH range but no significant shift in the
migration time for dicamba.
12. Two chiral forms of a drug have identical electrophoretic
mobilities in a CE system. However, it is possible to sepa-
rate these forms when -cyclodextrin (a complexing agent
we discussed in Chapter 7) is placed as an additive into the
running buffer. Based on your knowledge of chemical reac-
tions, explain why the presence of -cyclodextrin might
lead to such a separation.
13. What is “electroosmosis”? What causes electroosmosis to
occur? How does electroosmosis affect the movement of
analytes in an electrophoresis system?
14. What is the “electroosmotic mobility”? What factors affect
this mobility?
15. A neutral compound injected onto a capillary elec-
trophoresis system has a migration time of 1.52 min
through a 50 cm long capillary at 30.0 kV, with the detector
being located 30.0 cm from the point of injection. If it is
assumed that the observed electrophoretic mobility for
this compound is equal to the electroosmotic mobility,
what is the value of µ
eo
under these conditions?
16. The electroosmotic mobility for a particular separation is
found to be . A 25 cm long capillary is
used for this separation at an applied voltage of 20.0 kV,
with the detector being located 20 cm from the point of
injection. What is the expected migration time for a neutral
analyte in this system (i.e., an analyte that travels through
the system only due to electroosmotic flow)?
FACTORS AFFECTING BAND-BROADENING
17. Use the same equations as given in Chapter 20 for chro-
matography to calculate the following values. (Note: You
can assume Gaussian peaks are present.)
(a) The plate number of a peak in capillary electrophoresis
that has a migration time of 7.30 min and baseline width
of 0.12 min
(b) The plate height of the system in Part (a) for a capillary
with a total length of 35.0 cm
(c) The plate number of a band in gel electrophoresis with a
migration distance of 4.2 cm and baseline width of 2.1 mm
18. Use the equations given in Chapter 20 to calculate the fol-
lowing values.
(a) The resolution of two peaks in capillary electrophoresis
with migration times of 10.1 min and 10.4 min with
baseline widths of 0.15 min and 0.16 min, respectively
(b) The resolution of two bands in gel electrophoresis with
migration distances of 2.3 cm and 2.6 cm with an aver-
age baseline width of 1.5 mm
8.3 * 10
- 10
m
2
>V
#
s
b
b
19. How does longitudinal diffusion affect band-broadening in
electrophoresis? How is this type of band-broadening related
to the time of the separation and the size of the analytes? Why
can a porous support help minimize the effects of this process?
20. What is “Joule heating”? What causes this heating? Why does
Joule heating result in band-broadening in electrophoresis?
21. What are some approaches that can be used to minimize the
effects of Joule heating in electrophoresis?
22. One useful tool in optimizing a separation for capillary elec-
trophoresis is an “Ohm’s law plot.” This graph is prepared
by plotting the measured current of the electrophoretic sys-
tem at various applied voltages.
21
(a) Based on Equation 23.6, what information will be pro-
vided by the slope of this plot?
(b) Deviations from linearity are often seen at high voltages
in an Ohm’s law plot. What do you think is usually the
source of these deviations?
23. Under what conditions will eddy diffusion be present dur-
ing electrophoresis?
24. What is “wick flow”? How does wick flow create band-
broadening? In what types of electrophoresis can wick flow
be important?
WHAT IS GEL ELECTROPHORESIS?
25. What is “gel electrophoresis”? How is this technique used
for analyte identification and measurement?
26. A biochemist looking for a particular protein in a cell sam-
ple obtains the following results when using gel elec-
trophoresis and a Western blot to compare this sample with
standards containing the same protein. What is the approxi-
mate amount of this protein in the unknown cell sample?
Amount of Protein (ng) Relative Band Area
0.0 50
5.0 560
10.0 1120
20.0 2040
Unknown sample 980
27. Figure 23.22 shows a typical result that is obtained for the
analysis of a human serum sample by gel electrophoresis.
Explain how this information might be used by a physician
to detect both qualitative and quantitative changes in serum
proteins for their patients.
HOW IS GEL ELECTROPHORESIS PERFORMED?
28. Draw a diagram of a typical gel electrophoresis system and
label its main components. Explain the difference between
horizontal and vertical gel electrophoresis systems.
29. List some supports that can be used in gel electrophoresis.
What type of support is often used with DNA? What type is
often used with proteins?
30. Describe how samples are usually applied to a support in
gel electrophoresis. Explain the purpose of a “stacking gel”
versus a “running gel.”
31. Describe how each of the following items can be used for
detection in gel electrophoresis.
(a) Densitometer
(b) Coomassie Brilliant Blue
96943_23_ch23_p571-596 1/8/10 2:54 PM Page 591
592 Chapter 23 • Electrophoresis
(c) Silver staining
(d) Blotting
32. What is the difference between a Southern blot and a
Northern blot? What is the difference between a Southern blot
and a Western blot? How is each of these methods performed?
33. What is MALDI-TOF MS (matrix-assisted time-of-flight
mass spectrometry)? Explain how this method can be used
for identifying the contents of bands in gel electrophoresis.
WHAT ARE SOME SPECIAL TYPES OF GEL ELECTROPHORESIS?
34. Explain how SDS-PAGE (sodium dodecyl sulfate polyacry-
lamide gel electrophoresis), is performed. Describe why
SDS-PAGE can provide information on the molecular mass
of a protein.
35. The molecular mass of a protein is to be estimated by SDS-
PAGE. The following migration distances are obtained for pro-
teins of known mass on the gel: 200 kDa, 0.33 cm; 116.3 kDa,
0.57 cm; 66.3 kDa, 0.91 cm; 36.5 kDa, 1.63 cm; 21.5 kDa, 1.96 cm;
14.4 kDa, 2.24 cm. The unknown protein has a migration dis-
tance of 1.25 cm on the same gel. What is the approximate
molecular weight of this protein?
36. A biochemist uses the same conditions as in the last problem
to look for proteins with approximate masses of 18.5 kDa,
40.2 kDa, and 91.8 kDa. What are the expected migration dis-
tances for these proteins in this gel?
37. What is “isoelectric focusing”? Describe how this method
separates analytes.
38. What is an “ampholyte”? How is an ampholyte used in iso-
electric focusing?
39. What is “2-D electrophoresis”? What types of electrophore-
sis are often used in this method? What advantages are
there in the use of 2-D electrophoresis for complex samples?
WHAT IS CAPILLARY ELECTROPHORESIS?
40. What is meant by the term “capillary electrophoresis”?
How does this method differ from gel electrophoresis?
41. The amount of a nitrate in an unknown sample is to be
quantitated by capillary electrophoresis. Another anion is
added to all samples and standards as an internal standard
(IS) prior to injection. The following results are obtained.
What is the amount of the nitrate in the unknown sample?
FIGURE 23.22 Pattern obtained by staining of
serum proteins that have been separated by gel
electrophoresis. The bottom plot shows the protein
bands on this gel after staining and the top tracing
shows the intensity of these bands, as determined by
using a densitometer. The labels on the bands refer
to the types of proteins that are present in a given
region or zone. The general location of these bands
can be used to identify proteins in an unknown
sample, while their intensity can be used to indicate
the relative amount of each protein that is present.
(Based on data from J.M. Anderson and G.A. Tetrault,
“Electrophoresis.” In Laboratory Instrumentation, 4th
ed., M.C. Haven, G.A. Tetrault, and J.R. Schenken, Eds.,
Van Nostrand Reinhold, New York, 1995, Chapter 12.)
Staining pattern of gel
Migration distance
Densitometer scan of stained gel
Signal intensity
␣
2

␣
1
␥
Albumin
Globulins
Concentration of
Nitrate (mg/L)
Peak
Height
Concentration of
Internal
Standard (mg/L)
Peak
Height
0.0 0.2 2.5 9.8
5.0 18.8 2.5 10.2
10.0 43.1 2.5 11.5
15.0 55.2 2.5 10.1
Unknown sample 15.1 2.5 9.7
42. Capillary electrophoresis and laser-induced fluorescence
detection were used to determine the amount of a fluorescein-
labeled peptide in a biological sample. A fixed amount of non-
conjugated fluorescein was added to each sample as an
internal standard. The following results were obtained in this
method for a series of standards.
Concentration of
Peptide (nM)
Peak Area —
Peptide
Peak Area —
Fluorescein
0.0 109 546
15.0 2185 598
25.0 3174 532
50.0 7046 601
The unknown sample gave measured peak areas of 4098
and 556 for the labeled peptide and fluorescein. What was
the concentration of this peptide in the unknown sample?
43. What helps give capillary electrophoresis high efficiency?
What processes are normally the most important in CE in
determining the band-broadening of this method?
44. A small anion with a diffusion coefficient of
and an electrophoretic mobility of is to be
analyzed at 20.0 kV by a capillary electrophoresis system. The
system has a total length of 40.0 cm and the detector is
located 33.0 cm from the point of injection. In the absence of
electroosmotic flow, what is the maximum number of theo-
retical plates that can be obtained for this anion (i.e., assum-
ing longitudinal diffusion is the only band-broadening
process)? What will the migration time of the analyte be
under these conditions?
1.58 cm
2
>kV
#
min
3.0 * 10
- 5
cm
2
>s
96943_23_ch23_p571-596 1/8/10 2:54 PM Page 592
• Questions 593
45. A chemist wishes to use the plate number measured for a
CE to estimate the diffusion coefficient for a new drug. This
drug is injected onto a 42.5 cm long neutral coated capillary,
which has no binding for the drug and produces negligible
electroosmotic flow. The detector is located 38.0 cm from the
point of injection. The drug has a measured migration time
of 14.8 min and a baseline width of 26 s, when a voltage of
15.0 kV is applied across the capillary.
(a) What is the number of theoretical plates for the peak
due to the drug, if it is known that this peak has a
Gaussian shape?
(b) What is the diffusion coefficient for the drug (in units of
cm
2
/s)? What assumptions did you make in reaching
your answer?
HOW IS CAPILLARY ELECTROPHORESIS PERFORMED?
46. What are the main components of a capillary electrophore-
sis system? How does this system differ from the equipment
used in gel electrophoresis?
47. Why does the use of an uncoated silica capillary lead to
electroosmotic flow in capillary electrophoresis? What is the
direction of this flow? How does electroosmosis affect the
apparent migration of analytes through the CE system?
48. What is the “normal polarity” mode of CE? What is the
“reversed polarity” mode? In what general situations are
these two modes utilized?
49. Explain why it is necessary in capillary electrophoresis to use
small injection volumes. What are some difficulties in work-
ing with these small volumes? What are some advantages?
50. What is “hydrodynamic injection”? What is “electrokinetic
injection”? How does each of these methods work?
51. What is “sample stacking”? Describe one way sample stack-
ing can be accomplished in capillary electrophoresis.
52. List some general and some selective detectors that are used
in capillary electrophoresis. How does this list compare to
that given in Chapter 22 for liquid chromatography?
53. Two isoforms of a protein are found to elute with migration
times of 20.3 min and 24.5 min from a capillary elec-
trophoresis system. These protein peaks have measured
areas of 3430 and 1235 units, respectively. What is the rela-
tive amount of each protein in the sample?
54. A drug is found to have a peak area of 11,250 units and it
migrates through a 50.0 cm long capillary in the presence of
an applied voltage of 15.0 kV. The detector is located at a
distance of 45.0 cm from the point of injection. What will the
expected area be for this sample if it is injected onto the
same system, but now using an applied voltage of 20.0 kV?
55. What is “laser-induced fluorescence”? Explain why this
technique is useful in capillary electrophoresis.
WHAT ARE SOME SPECIAL TYPES OF CAPILLARY
ELECTROPHORESIS?
56. What is “capillary sieving electrophoresis”? What are two
ways in which this method can be performed?
57. A protein is injected onto the same system used in
Figure 23.18. What is the molecular weight of this protein if
it has a normalized migration time of 2.65?
58. Define each of the following terms.
(a) Electrokinetic chromatography
(b) MEKC
(c) Micelle
(d) Critical micelle concentration
59. What is “capillary isoelectric focusing”? Describe one way
this method can be performed.
60. What is “affinity capillary electrophoresis”? What are some
applications of this method?
CHALLENGE PROBLEMS
61. Compare the capillary electrophoresis system in Figure 23.14
with the electrochemical cells that are discussed in Chapter 10.
(a) What similarities can you find in these two types of sys-
tems? Based on this comparison, which part of the elec-
trochemical cell would be equivalent to the capillary in
a CE system? Which part of an electrochemical cell do
you think would be equivalent to the gel or support in a
gel electrophoresis system?
(b) Describe how current is carried from the power supply
and throughout an electrophoresis system. What is the
role of the running buffer in this regard? What are the
roles of the electrodes?
(c) One tool we used in Chapter 6 for solving chemical
problems was to use the method of charge balance,
which says that the number of positive and negative
charges in a system must be equal. And yet, in elec-
trophoresis we use an electric field to separate analytes
with positive and negative charges. Why do you think
this separation is possible? (Hint: Consider your
answers to Parts (a) and (b).)
62. The effect of electroosmotic flow on the overall observed elec-
trophoretic mobility and migration velocity (t
m
) for an
analyte in electrophoresis is given by the following equations,
(23.11)
(23.12)
where all terms are the same as described earlier in this
chapter.
21,23
(a) A cation has an electrophoretic mobility of
on a CE system containing a 30.0 cm
long coated, neutral capillary with a detector located
25.0 cm from the point of injection. What migration time
and migration velocity would be expected for this
cation when using an applied voltage of 15.0 kV?
(b) What migration time and velocity would be obtained
for the same cation as in Part (a) if a switch was made
from the neutral capillary to a negatively charged capil-
lary of an identical size, but that gives an electroosmotic
mobility of ?
(c) Repeat the calculations in Parts (a) and (b) now using an
anion that has an electrophoretic mobility of
. Compare your results with those
obtained for the cation. What does this comparison tell
you about the role electroosmotic flow plays in the
analysis of cations and anions in CE?
63. The effect of electroosmotic flow on the efficiency and reso-
lution of a separation in electrophoresis is given by the
equations shown,
23
(23.13)
(23.14)R
s
= 0.177 (m
1
- m
2
)
A
V
D(m
avg
+ m
osm
)
N =
(m + m
osm
)V
2D
- 2.50 cm
2
>kV
#
min
4.10 cm
2
>kV
#
min
2.50 cm
2
>kV
#
min
t
m
=
L
d
L
(m+ m
osm
)V
=
L
d
m
Net
E
v = m
Net
E =
(m+ m
osm
)V
L
(m
Net
)
96943_23_ch23_p571-596 1/8/10 2:54 PM Page 593
594 Chapter 23 • Electrophoresis
where and are the electrophoretic mobilities of the first
and second eluting solutes, is the average electrophoretic
mobility of solutes 1 and 2, and D is their diffusion coefficient.
(a) The same protein as in Exercise 23.1 is examined on a CE
system with a 25.0 cm long negatively charged capillary
(22.0 cm to the detector) at 20.0 kV. This new capillary
has an electroosmotic mobility of . If
the protein still has an inherent electrophoretic mobility
of and a diffusion coefficient of
, how many theoretical plates are pos-
sible for this system? How does this result compare with
that in Exercise 23.1?
(b) Make a plot showing what resolution would be expected
at various values for µ
osm
in the case where the applied
voltage is 10.0 kV and two analyte peaks have elec-
trophoretic mobilities of 1.70 and ,
with an average diffusion coefficient of
. At what values of will the largest reso-
lutions be obtained? What values of will give the
smallest resolutions?
64. The amount of sample applied to a capillary by hydrody-
namic injection can be determined by the following form of
the Hagen–Poiseuille equation,
(23.15)
where P is the pressure applied across the capillary during
injection, d is the inner diameter of the capillary, t is the time
over which the pressure is applied, is the viscosity of the
applied solution, and L is the total length of the capillary.
8
(a) What volume of sample would be applied to a
capillary if a pressure of 0.5 psi is
applied for 1 s to a solution with a viscosity of 0.01 poise?
(b) How much sample would be applied under the same
conditions but using a 1 s pulse on a
capillary?
65. The amount of an analyte that is applied to a capillary by
electrokinetic injection is described by Equation 23.16,
(23.16)
where Q is the quantity of analyte injected, is the elec-
trophoretic mobility of the analyte, is the mobility due
to electroosmosis, V is the applied voltage, A is the cross-
sectional area of the capillary, C is the analyte concentration
in the original sample, t is the time over which the electric
field is applied for injection, and L is the distance over
which the voltage is applied.
8
(a) Based on Equation 23.16, which types of analytes will have
the largest injected quantities in electrokinetic injection:
those that move with electroosmotic flow or against it?
(b) How does the value of Q change with the size of elec-
troosmotic flow? Are small values or large values for
µ
osm
desirable in this method?
66. Compare and contrast the following analytical methods in
terms of the way in which they separate analytes.
(a) Electrokinetic chromatography and reversed-phase
chromatography
(b) Capillary electrophoresis and ion-exchange
chromatography
(c) SDS-PAGE and capillary gel electrophoresis
(d) Affinity capillary electrophoresis and affinity
chromatography
m
osm
m
Q =
(m + m
osm
)VA C t
L
20 cm long
25 mm ID *
50 mm ID * 20 cm long
h
¢
Sample volume =
¢P d
4
pt
128h L
m
osm
m
osm
versus m
avg
2.0 * 10
- 7
cm
2
>s
1.72 cm
2
>kV
#
min
2.0 * 10
- 7
cm
2
>s
1.70 cm
2
>kV
#
min
3.0 cm
2
>kV
#
min
m
avg
m
2
m
1
TOPICS FOR REPORTS AND DISCUSSION
67. Obtain more information on the Human Genome Project.
Discuss the challenges this project presented to analytical
chemists. What changes in DNA sequencing methods were
made to make this project possible?
68. Now that human DNA has been sequenced, scientists have
begun to examine the vast number of proteins that are
encoded by this DNA. This research has lead to an area
known as “proteomics.” Obtain more information on pro-
teomics and the challenges that are presented by this field to
chemical analysis. Describe some analytical methods that
are being used in this field.
69. Contact or visit a local hospital or biochemical laboratory.
Report on how electrophoresis is used in these laboratories.
70. Compare and contrast the advantages and disadvantages
for each of the following pairs of methods
(a) Gel electrophoresis versus capillary electrophoresis
(b) Gel electrophoresis versus HPLC
(c) Capillary electrophoresis versus HPLC
71. Use the Internet to obtain material safety data sheet (MSDS)
information for the various chemicals that are shown in
Figure 23.8 for the preparation of a polyacrylamide gel.
Identify any chemical or physical hazards that are associ-
ated with these reagents.
72. Work with Northern and Southern blots in gel electrophore-
sis often involves the use of phosphorus-32 as a radiola-
bel. Obtain further information on any special requirements,
training or facilities that are needed for dealing with this
agent. In addition, find out why phosphorus-32 is used as a
label for these applications. Write a report discussing your
findings.
73. There are several additional types of electrophoresis
besides those that were discussed in this chapter. A few
examples are listed below.
10,17
Write a report on one of
these methods. Include of description of how the method
separates analytes, its applications, and its advantages
and disadvantages.
(a) Isotachophoresis
(b) Pulsed-field electrophoresis
(c) Dielectrophoresis
(d) Immunoelectrophoresis
74. The need for small sample sizes originally created several
challenges in the design of CE instruments. This same fea-
ture has made capillary electrophoresis attractive for the
analysis of samples for which only small volumes are avail-
able. For instance, it has been shown that CE can be used to
analyze the content of single cells. Obtain a recent research
article or review on this topic. Write a report that discusses
how CE was used to analyze single cells in the subject paper.
75. Some early examples of capillary electrophoresis can be found
in Referemces 23 and 34. Look up these articles and examine
how electrophoresis was performed in them. How do the
methods described in these papers compare to those that are
now commonly used in CE, as described in this chapter?
76. Capillary electrochromatography is a method in which the
movement of an analyte through a stationary phase is
achieved through the use of electroosmotic flow rather than
by only a difference in pressure.
7,47,48
Obtain more informa-
tion on this method. Report on how this method works and
on some of its recent applications. Discuss how this method
is related to both traditional liquid chromatography and
capillary electrophoresis, even though it is usually classified
as a chromatographic method.
(
32
P)
96943_23_ch23_p571-596 1/8/10 2:54 PM Page 594
• References 595
77. Four chemicals that can be used as matrices in MALDI-
TOF MS are nicotinic acid, sinapinic acid, -cyano-4-
hydroxycinnamic acid, and 2,5-dihydroxybenzoic acid.
Obtain more information on one or more of these chemi-
cals and learn about how they are used in MALDI-TOF
MS. What chemical or physical properties make these
chemicals used in this method? What are some analytes
that can be examined with these matrices?
a
78. Find a recent research article that describes or uses a “lab-
on-a-chip” or device. Describe this device and the
application for which it was employed. What advantages or
disadvantages were reported for this device versus more
traditional methods for chemical analysis?
mTAS
1. J. C. Venter et al., “The Sequence of the Human Genome,”
Science, 291 (2001) 1304–1351.
2. E. S Lander et al., “Initial Sequencing and Analysis of the
Human Genome,” Nature, 409 (2001) 890–921.
3. The New Encyclopaedia Britannica, 15th ed., Encyclopaedia
Britannica, Inc., Chicago, IL, 2002.
4. F. Sanger, “The Early Days of DNA Sequences,” Nature
Medicine, 7 (2001) 267–268.
5. “A History of the Human Genome Project,” Science, 291
(2001) 1195.
6. N. J. Dovichi and J. Zhang, “How Capillary Electrophoresis
Sequenced the Human Genome,” Angewandte Chemie
International Edition, 39 (2000) 4463–4468.
7. M L. Riekkola, J. A. Jonsson, and R. M. Smith,
“Terminology for Analytical Capillary Electromigration
Techniques (IUPAC Recommendations 2003),” Pure and
Applied Chemistry, 76 (2004) 443–451.
8. T. Blanc, D. E. Schaufelberger, and N. A. Guzman,
“Capillary Electrophoresis.” In Analytical Instrumentation
Handbook, 2nd ed., G. W. Ewing, Ed., Marcel Dekker, New
York, 1997, Chapter 25.
9. J. Inczedy, T. Lengyel, and A. M. Ure, Compendium of Analytical
Nomenclature, 3rd ed., Blackwell Science, Malden, MA, 1997.
10. B. L. Karger, L. R. Snyder, and C. Hovath, An Introduction to
Separation Science, Wiley, New York, 1973, Chapter 17.
11. W.B. Hardy, “On the Coagulation of Proteid by Electricity,”
Journal of Physiology, 26 (1899) 288–304.
12. W. B. Hardy, “Colloidal Solution. The Globulins,” Journal of
Physiology, 33 (1905) 251–337.
13. L. Michaelis, “Elektrische Uberfuhrung von Fermenten,”
Biochemische Zeitschrift, 16 (1909) 81–86.
14. A. W. K. Tiselius, “A New Apparatus for Electrophoretic
Analysis of Colloidal Mixtures,” Transactions of the Faraday
Society, 33 (1937) 524–531.
15. Nobel Lectures, Chemistry 1942–1962, Elsevier, Amsterdam,
the Netherlands, 1964.
16. J. W. Jorgenson, “Electrophoresis,” Analytical Chemistry, 58
(1986) 743A–760A.
17. J. C. Giddings, Unified Separation Science, Wiley, New York,
1991, Chapter 8.
18. L. Stryer, Biochemistry, Freeman, New York, 1988, Chapter 3.
19. D. S. Hage, “Chromatography and Electrophoresis,” In
Contemporary Practice in Clinical Chemistry, W. Clarke and D. R.
Dufour, Eds., AACC Press, Washington, DC, 2006, Chapter 7.
20. J. M. Anderson and G. A. Tetrault, “Electrophoresis,” In
Laboratory Instrumentation, 4th ed., M. C. Haven, G. A.
Tetrault, and J. R. Schenken, Eds., Van Nostrand Reinhold,
New York, 1995, Chapter 12.
21. J. P. Landers, Handbook of Capillary Electrophoresis, CRC Press,
Boca Raton, FL, 1992.
22. P. Camilleri, Ed., Capillary Electrophoresis, CRC Press, Boca
Raton, FL, 1997.
23. J. W. Jorgenson and K. D. Lukacs, “Zone Electrophoresis in
Open-Tubular Glass Capillaries,” Analytical Chemistry, 53
(1981) 1298–1302.
24. E. M. Southern, “Detection of Specific Sequences among
DNA Fragments Separated by Gel Electrophoresis,” Journal
of Molecular Biology, 98 (1975) 503–517.
25. J. C. Alwine, D. J. Kemp, and G. R. Stark, “Method for
Detection of Specific RNAs in Agarose Gels by Transfer to
Diazobenzyloxymethyl-Paper and Hybridization with
DNA Probes,” Proceedings of the National Academy of Science
USA, 74 (1977) 5350–5354.
26. J. Renart, J. Reiser, and G. R. Stark, “Transfer of Proteins
from Gels to Diazobenzyloxymethyl-Paper and Detection
with Antisera: A Method for Studying Antibody Specificity
and Antigen Structure,” Proceedings of the National Academy
of Science USA, 76 (1979) 3116–3120.
27. W. N. Burnette, “Western Blotting: Electrophoretic Transfer
of Proteins from Sodium Dodecyl Sulfate-Polyacrylamide
Gels to Unmodified Nitrocellulose and Radiographic
Detection with Antibody and Radioiodinated Protein A,”
Analytical Biochemistry, 112 (1981) 195–203.
28. M. Karas, D. Bachmann, and F. Hillenkamp, “Influence of
the Wavelength in High-Irradiance Ultraviolet Laser
Desorption Mass Spectrometry of Organic Molecules,”
Analytical Chemistry, 57 (1985) 2935–2939.
29. M. Karas and F. Hillenkamp, “Laser Desorption Ionization
of Proteins with Molecular Masses Exceeding 10,000
Daltons,” Analytical Chemistry, 60 (1988) 2299–2301.
30. K. Tanaka, H. Waki, Y. Ido, S. Akita, Y. Yoshida, and T. Yoshida,
“Protein and Polymer Analyses up to m/z 100 000 by Laser
Ionization Time-of-Flight Mass Spectrometry,” Rapid
Communications in Mass Spectrometry, 2 (1988) 151–153.
31. F. Hillenkamp and J. Peter-Katalinic, Eds., MALDI MS: A
Practical Guide to Instrumentation, Methods and Applications,
Wiley, New York, 2007, 31.
32. M. J. Stump, R. C. Fleming, W H. Gong, A. J. Jaber, J. J.
Jones, C. W. Surber, and C. L. Wilkins, “Matrix-Assisted
Laser Desorption Mass Spectrometry,” Applied Spectroscopy
Reviews, 37 (2002) 275–303.
33. D. E. Garfin, “Two-Dimensional Gel Electrophoresis: An
Overview,” Trends in Analytical Chemistry, 22 (2003) 263–272.
34. F. E. P. Mikkers, F. M. Everaerts, and Th. P. E. M. Verheggen,
“High-Performance Zone Electrophoresis,” Journal of
Chromatography, 169 (1979) 11–20.
35. K. R. Mitchelson and J. Cheng, Eds., Capillary Electrophoresis of
Nucleic Acids, Humana Press, Totowa, NJ, 2001.
36. S. C. Terry, G. H. Jerman, and J. B. Angell, “A Gas
Chromatographic Air Analyzer Fabricated on a Silicon Wafer,”
IEEE Transactions on Electron Devices, 12 (1979) 1880–1886.
References
96943_23_ch23_p571-596 1/8/10 2:54 PM Page 595