coca cola financial analysis individual assignment
Bạn đang xem bản rút gọn của tài liệu. Xem và tải ngay bản đầy đủ của tài liệu tại đây (5.9 MB, 40 trang )
lOMoARcPSD|12332183
COCA-COLA FINANCIAL ANALYSIS - INDIVIDUAL
ASSIGNMENT
Corporate Finance (FPT University)
StuDocu is not sponsored or endorsed by any college or university
Downloaded by Pham Huu Khiem ()
lOMoARcPSD|12332183
LECTURER: AN HAI VO
FINANCIAL
ANALYSIS
FIN202 // PREPARED BY AN DOAN
Downloaded by Pham Huu Khiem ()
Inc.
lOMoARcPSD|12332183
ABSTRACT AND SUMMARY
Supervised by:
Mr. An Hai Vo, Master of Science
In this research documentary, I will examine the annual financial performance
from the years 2018 and back of one of the biggest corporations in the world
which is the Coca-Cola Company. The research will consider the various ratios
used in analyzing a financial situation of a business like liquidity ratios, activity
ratios, debt ratios, and profitability ratios, and then apply them to determine
whether Coca-Cola Company is performing well or not. The sources of data
collections method were used from Yahoo Finance, Investing.com, Financial
Modeling Prep, and the instruction of Mr. An Hai Vo, my Finance Corporate
subject's lecturer to better know and understand the company's financial
health history, give out my own recommendation and conclusion about CocaCola financial potential specializing 2018 - 2020 period.
All information in this article is unique, with references attached below. As a
sophomore in economics, the analysis below certainly has a lot of flaws. Looking
forward to your comments.
INDIVIDUAL ASSIGNMENT
Financial Statement Analysis of Coca-Cola
Company ( 2018 - 2020 )
Gia An Doan Nguyen
Downloaded by Pham Huu Khiem ()
lOMoARcPSD|12332183
FINANCIAL ANALYSIS OF
TABLE OF CONTENTS
COCA-COLA CO.
I. BUSINESS OVERVIEW
Company Profile
1
Mission and Vision
3
About Competitors
4
Operation Segment
9
II. FINANCIAL STATEMENT
Income Statement
12
Balance Sheet
14
Cash Flow Statement
99
III. FINANCIAL RATIO
Liquidity Ratio
18
Efficiency Ratio
19
Leverage Ratio
Profitability Ratio
Market Value Ratio
22
24
25
25
IV. PEER-GROUP ANALYSIS
Asset Management
25
Fund Management
27
Profitability
30
V. CONCLUSION
Recommendation
Conclusion
PERIOD: FROM 2018 TO 2020
Downloaded by Pham Huu Khiem ()
12
14
lOMoARcPSD|12332183
FINANCIAL ANALYSIS |
PAGE | 01
2018 - 2020
COCA-COLA CORPORATION
COMPANY
OVERVIEW
PROFILE
Founded and headquartered in Atlanta, Georgia,
the Coca-Cola Group currently operates with its
branded products in 200 countries around the
world. The Coca-Cola brand is the top-selling
beverage brand that owns, licenses, and markets
more than 500 diversified brands (Bottled Water,
Soft Drinks, and Juices). Coca-Cola Co. owns four
of
the
top
5
global
nonalcoholic
sparkling
beverage brands: Coca-Cola, Diet Coke, Fanta, and
Sprite.
MISSION AND VISION
The company's mission and vision are reflected by
social activities in the countries and markets
where Coca-Cola is present. There are three main
values including becoming a favorite brand, topchosen
brand;
sustainable
development
is
a
beverage brand that aims to find innovative and
sustainable solutions; and for a better future life,
Coca-Cola will continue to invest to improve the
lives of everyone - from corporate system to
communities.
Downloaded by Pham Huu Khiem ()
lOMoARcPSD|12332183
GLOBAL GEOMETRY
YEAR 2018
FINANCIAL ANALYSIS |
PAGE | 02
37M
COMPETITORS
Nowadays, the non-alcoholic beverage segment of the commercial
beverage industry is highly competitive, consisting of a variety of
brands in Coca-Colas' target markets. PepsiCo, Inc., one of the main
competitors worth noting. Including other significant: RedBull,
DPSG, Keurig Dr Pepper, Mondelēz International, Inc., Kraft Foods
Group, Inc., Soylent, and Tetra Park, etc. Coca-Cola also competes
with many regional and local companies.
Downloaded by Pham Huu Khiem ()
lOMoARcPSD|12332183
FINANCIAL ANALYSIS |
PAGE | 03
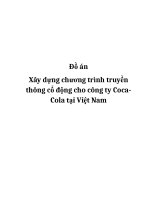
OPERATING SEGMENT
As the basic foundation for internal financial reporting, the operating
structure effective from Dec 31, 2015, includes the following:
Eurasia and Africa
The Asia Pacific
Europe
Bottling Investments
Latin America
Corporate
North America
Bottling Investments
19%
Eurasia and Africa
6%
Europe
16.8%
The Asia Pacific
12.8%
Latin America
10.6%
North America
34.7%
Revenue Distribution of the Coca Cola Company in 2020 by operating segment
Souce Statista com
-
:
.
In 2020, one-third of The Coca-Cola Company’s total revenue (35%)
was specifically generated in North America, becoming their most
lucrative by far. General description finance in this report presented
in North America - financial indexes listed on NYSE (New York Stock
Exchange).
IND
. IVIDUAL ASSIGNMENT
Downloaded by Pham Huu Khiem ()
AN DOAN
lOMoARcPSD|12332183
FINANCIAL
STATEMENT
ANALYSIS
Date: 20 Oct 2021
Downloaded by Pham Huu Khiem ()
PAGE 4
lOMoARcPSD|12332183
INCOME
STATEMENT
2018 - 2020 ( From Investing.com)
FINANCIAL ANALYSIS
Downloaded by Pham Huu Khiem ()
PAGE 05
lOMoARcPSD|12332183
Downloaded by Pham Huu Khiem ()
lOMoARcPSD|12332183
CHART 1.1: STATISTICS 2018 - 2020
Firstly, suddenly hit by the effect of
INCOME
STATEMENT
the national lockdown in COVID-19,
cost reductions are being made in
direct and indirect categories
expenses and by reorganization.
Over recent fiscal years, the ColaCola Company's total revenue has
fluctuated globally, nearly $40
billion. As the US-China Trade War
tariff imposition caused massive
disruption to businesses and rattled
global finance. Net operating
revenue fell 6% to $7.1 billion in the
last three quarters of 2018 and fell
10% to $31.9 billion in 2018.
Coca-Cola planned to eliminate
2,200 jobs. The reductions include 6
operating units severance,
canceling 200 brands or half of its
portfolio. This cutoff point lead
2019's selling, general and
administrative expenses at $12,2
billion to a downward trend and
reached the lowest point in 2020
among 3 years, at just $9.7 billion.
FINANCIAL ANALYSIS
Downloaded by Pham Huu Khiem ()
PAGE 07
lOMoARcPSD|12332183
FINANCIAL ANALYSIS
PAGE | 08
GENERAL FINANCIAL HEALTH
SOURCE: CNN BUSINESS
Nonetheless,
as
the
2018
-
2020
annual
report,
the
beverage giant spent roughly two-thirds of its revenue ($23
- $28 billion) on its COGS and other spending results.
Whilst, net revenue, and its global volumes upper 24%
before stuck with a downward trend from 2019 to 2020.
Moreover, Coca-Cola Company’s revenues ascended from
$31.86 billion in 2018 to a top of $37.3 billion in 2019 and
slightly fall again to $33.01 billion in 2020. The Net Income
in this period fluctuates with increasing $2.5 billion from
2018-2019 and a decrease in 2020 at a lower level ($7,7
billion).
Thus, from the difference between net income and net loss,
estimate that the company's global volumes are stuck with
a downward trend that cannot control business health
including
ineffective
investment
and
is
affected
extraordinary expenses items (COVID-19 pandemic).
Downloaded by Pham Huu Khiem ()
by
lOMoARcPSD|12332183
BALANCE SHEET
2018 - 2020 ( From Investing.com)
FINANCIAL ANALYSIS
Downloaded by Pham Huu Khiem ()
PAGE 09
lOMoARcPSD|12332183
Downloaded by Pham Huu Khiem ()
lOMoARcPSD|12332183
C HA R T 1 . 2
TOTAL ASSET
In general, Coca-Cola's total assets tend to slightly rise within 3
years from 2018-2020, ranging from $83 - $87 billion, the highest
value in 2020 is approximately $87,3 billion. Even though, the
accompanying figures get saw a fall in the current asset amount.
Specifically, total items cash, cash equivalent & short-term
investment follows a downward trend, hitting a 3-year low of
about $10,9 billion (about 9.81%), a difference of about $5,2
billion compared to 2018. Besides with a slight increase in
inventories account due to upper price of raw material and
progress payment.
FINANCIAL ANALYSIS
Downloaded by Pham Huu Khiem ()
PAGE 11
lOMoARcPSD|12332183
PAGE
F I N11
ANCIAL
ANALYSIS
PAGE | 12
$3.6 b
Increasing in
Intangible asset
TRADEMARK AND
GOODWILL INCREASE
One noticeable point in 2020 balance sheet
accounts - growth in trademarks, goodwill, and
other intangible assets. The item related to the
brand value of Coca-Cola shows growth in 2020
with the difference compared to 2018 of $3,6
billion (about 5%). This is a potential little step
forward in the context of the economy's strong
breakdown by the pandemic, explained by its
earnings,
or
in
more
detail,
refranchising
operation-driven margin expansion at the same
time on account of lower COGS and SG&A
expenses mentioned above.
Downloaded by Pham Huu Khiem ()
lOMoARcPSD|12332183
Downloaded by Pham Huu Khiem ()
lOMoARcPSD|12332183
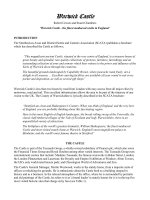
FINANCIAL ANALYSIS |
PAGE | 14
Total Liabilities
75.000
50.000
25.000
0
2018
2019
2020
Coca-Cola Co.'s total liabilities increases for 3 years, the numbers ranged
from about $66 - $68 billion. This number simultaneously tended to be
higher year-over-year, with reaching a peak appeared in 2020 (nearly
$68 billion), it increased by $1.78 billion (+2.7%). This upward trend in
the liability index can be explained by the retarded growth trend of the
market, in order to increase the value of the stock and deal with
extraordinary loss items from the COVID-19 pandemic, the company is
required to use leverage in the business leading to the account payable
steadily increases, the difference between the first year and the last year
in this period is $1.8 billion (1.3%).
TOTAL
LIABILITIES
Downloaded by Pham Huu Khiem ()
lOMoARcPSD|12332183
TOTAL
EQUITY
In terms of Equity, the period of 3 years
witnessed a stable rise. Coca-Cola begin
with $16,9 billion in 2018, keep moving
forward by 1.52% in 2019 at $18,9 billion, end
up in 2020 with $19,3 billion the difference
between the beginning and the end of the
period
was
$2.4
billion
(approx
1.48%).
Importantly, from 2018 to 2020, the Total
Liabilities ratio dominates over Total Equity
according
to
the
common-size
balance
sheet (maintained at more than 75%), equal
to
a
triple
common-size
fraction
according
balance
sheet.
to
the
Apparently,
Coca-Cola is implementing an ineffective
leverage policy, because the amount of debt
is still increasing then returning, showing
dismal progress.
This ascending tendency is affected by a
combination of three volatile account
factors:
Retained earnings,
Additional paid-in capital
Treasury stock.
FINANCIAL ANALYSIS
Downloaded by Pham Huu Khiem ()
PAGE 15
lOMoARcPSD|12332183
NET WORKING CAPITAL
PAGE 16
QUARTERLY CASHFLOW
The fluctuations in Coca-Cola's Working Capital index have shown
that Coke is not an exception in the edge of COVID-19 negative
impact.
It
shows
significant
fluctuations
from
2018-2020,
decreasing in turn in 2018 and 2019 at 2B USD and -6.6B USD,
especially in 2019 hit a low in the last 10 years (2011-2021). The
situation is still volatile from Q4 2019 to Q2 2020 as Coke is also
looking to streamline its portfolio, including the US continuing to
deal with the pandemic. Thus, nearly at the end of 2020 has
recovered its efficiency (to 4.6%) and continues to grow operating
liquidity.
Downloaded by Pham Huu Khiem ()
lOMoARcPSD|12332183
CASHFLOW
STATEMENT
2018 - 2020 ( From Investing.com)
FINANCIAL ANALYSIS
Downloaded by Pham Huu Khiem ()
PAGE 17
lOMoARcPSD|12332183
Downloaded by Pham Huu Khiem ()
lOMoARcPSD|12332183
From:
NonCurrent Liabilities
22.1%
SHORTTERM
To LONGTERM
Liabilities Distribution 2020
Current Liabilities
77.9%
Moreover, the study found there is a huge difference between
the two items of long-term and short-term debt over the year,
such an interesting point in the shift of business leverage
structure from reducing short-term debt to focusing on longterm debt. Total current liabilities for the period 2018-2020
reduced significantly, starting to drop (- 3.89%) in 2019, 2020
respectively. Thereafter, in 2020, total current liabilities rapidly
reduce to 16.9 billion USD approximately, (equivalent to -14,5%
). In other words, the proportion of debt structure has shifted
to long-term debt, especially between 2019 - 2020, the item of
long-term debt has skyrocketed from $27 billion to $40 billion
(equal to 15,5%).
FINANCIAL ANALYSIS
Downloaded by Pham Huu Khiem ()
PAGE 19
lOMoARcPSD|12332183
FINANCIAL ANALYSIS
PAGE 20
2018 - 2020
CASHFLOW
STATEMENT
CASHFLOW IN OPERATING ACTIVITIES
During three years from 2018 to 2020, the cash flow used in operating
activities of Coca-cola is various, the numbers of cashflow climbed
quickly from 2018-2019 (+37,3%). Thereafter, the yearly operating cash
flow reached a lower point in 2020 at 9,844 B USD (- 8,4%) but still upon
the operating cash flow of the first year. This is a signal that even though
in downturn 2020 because of Covid-19 but Coca-cola performed well on
its business and it is predicted that operating cash flow will be a positive
account with a consistent growth rate.
Downloaded by Pham Huu Khiem ()
lOMoARcPSD|12332183
FINANCIAL ANALYSIS
PAGE 21
CASHFLOW IN
INVESTING ACTIVITIES
Based on the company disclosures throughout this period, we
can conclude that Coca-Cola's investing activities showed the
most noticeable fluctuation in the overall pattern of cash flow
statement. Representing a rapid decrease from $5,93 in 2018
(which is impressing numbers of negative investing cash flow
over the past 10 years) to negative $3,9 billion in 2017 following
the landmark 2018 Costa Coffee acquisition. After discontinuing
200 certain brands generating just 2% of its revenue. Collectively,
the figure used to invest activities dropped consistently in 2020,
at just above -1,5B USD (+ 62,9%). Overall, the investing cash flow
follows an unpredictable trend but we can expect that will
optimize the investment account of the whole company.
CASHFLOW IN
FINANCING ACTIVITIES
Generally, for three years (2018-2020), financing activities became
more low-cost every year. After a decreasing figure in 2018 -2019.
There was an upward tendency in 2019 and 2020 at around -9B
USD and -8B USD, respectively. Additionally, the positive tendency
of numbers does not mean it is positive financial management.
But it illustrated that the company would attribute a larger
dividend paid (7,05B USD) due to the increase of profit and
positive insurance stock (529M USD) could be anticipated by
higher earning-per-share items.
Downloaded by Pham Huu Khiem ()