Tài liệu Ecological footprint of British city residents ppt
Bạn đang xem bản rút gọn của tài liệu. Xem và tải ngay bản đầy đủ của tài liệu tại đây (2.67 MB, 40 trang )
Ecological footprint
of British city residents
What we can do to reduce ours
Alan Calcott and Jamie Bull
CarbonPlan
October 2007
Acknowledgements
The authors would like to express their gratitude to the people who gave their time and rendered
assistance during the course of the preparation of this report. These include the Stockholm
Environment Institute at York University for their assistance in providing the data used in the
report and Anthony Field at WWF-UK for his contributions to the report.
Background note on the authors
CarbonPlan is an environmental consultancy which champions sustainable development in
business. It specialises in working with business organisations to implement programmes to
understand, measure and reduce the carbon and ecological impacts associated with both their
business operation and office premises or estate.
In conjunction with Bristol Zoo Gardens and the National Wildlife Conservation Park
CarbonPlan developed SALOME – a structured process to allow visitor attractions to
systematically reduce impacts and move towards sustainability.
3
3
Contents
Executive summary 4
Introduction 8
What is the issue? 10
What is Ecological Footprinting 12
The Ecological Footprint of the UK 14
Calculating a city footprint 16
Results 20
England – top 10 Smallest Footprints 21
top 10 Largest 22
10 Facts 23
Case Study: London Transport 24
Winchester and Salisbury – a comparison 24
Scotland – smallest to largest footprints 28
10 Facts 29
Wales – smallest to largest footprints 30
10 Facts 31
Edinburgh and Cardiff – a comparison 32
Recommendations 35
Top 10 recommendations to reduce your footprint 36
Conclusions 38
Appendix –
The breakdown of city residents ecological footprint 39
4
4
Executive summary
INTRODUCTION
The choices we make in our everyday lives about our homes, transport, food and the goods we
buy have impacts right across the world – from Indonesian rainforests to the Antarctic. The
amount we consume has a direct effect on climate change and species loss. For example, the
products we consume in the UK could be flown in from half way around the world and be made
using raw materials from somewhere else where species are under threat from loss of habitat.
If everyone in the world generated carbon emissions and consumed natural resources at the rate
we do in the UK we would need three planets to support us. Cumulatively, all of our individual
footprints – our impact on the world’s natural resources – make up the bigger picture.
We need to understand our impacts on the natural world in the fight against species loss and
climate change. We need to change our patterns of consumption to combat climate change,
conserve the Amazon rainforest and protect our oceans. We must become active citizens and
conscious consumers, aware of the consequences of our actions and the purchases we make. But
it’s not just us. Government and business also have their part to play by introducing policies and
products that allow us to lead better quality lives, for example by providing comprehensive
recycling facilities or environmentally friendly products.
This report highlights individuals’ consumption by ranking the 60 cities in Britain by the average
Ecological Footprint of their residents.
5
5
WHAT IS AN ECOLOGICAL FOOTPRINT?
An Ecological Footprint is a measure of the amount of bioproductive land and sea required to
support a person’s lifestyle. It includes the land needed to grow their food, dispose of their waste
and absorb their carbon emissions. The footprint counts all the impacts of personal spending as
well as the business and government expenditure on their behalf.
Biggest and smallest footprints
England
City
Planets
Footprint
gha
Smallest five
Plymouth
2.78
5.01
Salisbury
2.79
5.01
Kingston upon
Hull
2.79
5.02
Stoke on Trent
2.79
5.03
Gloucester
2.81
5.06
Largest five:
Canterbury
3.40
6.12
Brighton and
Hove
3.47
6.25
Chichester
3.49
6.28
St Albans
3.51
6.31
Winchester
3.62
6.52
Scotland
Smallest:
Glasgow
2.89
5.21
Dundee City
2.96
5.33
Inverness
2.97
5.35
Stirling
3.08
5.54
Aberdeen City
3.18
5.73
Largest:
Edinburgh
3.20
5.76
Wales
Smallest:
Newport
2.78
5.01
Swansea
2.84
5.12
Cardiff
2.89
5.20
St Davids
2.92
5.26
Largest:
Bangor
2.93
5.27
KEY ISSUES:
Income and total footprint
People in richer cities spend more – on cars, houses, eating out, etc – which leads to a larger
footprint. A simple comparison between the top and bottom cities in each country makes this
clear: well-off cities such as Edinburgh tend to have larger footprints, while less well-off cities
such as Glasgow have smaller ones.
Housing footprint
Housing is the sector that makes up the largest proportion of our individual footprint. It accounts
for 28% of the average per capita footprint. Again the biggest predictors of a large footprint are
6
6
having a higher income and a large house. This can be addressed, in part, by installing energy
efficiency measures such as draught-proofing and insulation.
Transport footprint
The difference between the transport footprint of London and that of St Albans is striking. The
average resident’s transport footprint in St Albans is 55% bigger than the London average. Public
transport, low levels of car ownership and policies to discourage large, polluting cars are behind
London’s lower transport footprint. Within London most commuting is by public transport. High
levels of commuting from St Albans (particularly by car rather than public transport) into London
are partially to blame for St Albans’ high transport footprint. Some can reduce their transport
footprint by spending more time working from home.
RECOMMENDATIONS
1. Measure your footprint and set annual targets to reduce it
It is much easier to reduce your footprint if you know what you are consuming and are aware of
its effect. Measure your personal environmental impact and find out the best ways to reduce it at
wwf.org.uk/calculator.
2. Make your home as energy efficient as possible
This is one of the simplest tips to follow. Many measures can not only reduce your footprint but
also save you money. For example, turning appliances off instead of switching them to standby,
or improving your home’s insulation.
3. Join with others who are reducing their footprint (and encourage those who are not)
There is evidence showing that people who try to reduce their footprint have more success if they
are part of a group. So join a local group trying to do this, for example a Carbon Rationing Action
Group, or one of Global Action Plan’s eco-teams
1
.
4. Think before you spend
Most of our footprint is down to the things we buy. Our houses are often cluttered with items we
only use or wear once. The average drill is used for just 15 minutes in its lifetime. Rather than
buying something, consider whether you could hire or borrow one instead.
5. Holiday closer to home
Flights comprise a large and growing part of our collective footprint. One passenger’s share of a
return flight to Australia will have the same impact on the climate as it takes to heat and power
the average home for six years. Europe is now easier to reach by train than ever before. A
passenger on a flight to Paris is responsible for 10 times more CO
2
emissions than a person using
the Eurostar.
1
These are groups of up to eight households who follow a four- month programme of work to reduce their environmental impacts.
www.globalactionplan.org.uk/index.cfm?TERTIARY_ID=0&PRIMARY_ID=31&SECONDARY_ID=38&PERMISSION_ID=11
7
7
CONCLUSIONS
Reducing consumption is the key to bringing down our Ecological Footprint. There is a link
between cities that have the biggest disposable incomes and the cities with the biggest footprints
per person.
The link is not an automatic one: some well-off cities have a footprint that is smaller than might
be expected. Salisbury has a one of the lowest footprints in the UK but high house prices and
wages. Where action is being taken the footprints reflect this. London’s transport footprint is a
case in point.
Everything we spend our money on has the potential to cause harm somewhere in the world. But
by increasing our understanding of these potential impacts and changing the way we do things
and our choices we can reduce the negative environmental impacts while maintaining our
lifestyle. What is needed is to step outside of the cycle of conspicuous consumption. People need
to become active citizens – taking positive actions in their own lives as well as in their
community to reduce their own footprint – and use their money wisely. By choosing responsible
products and companies we can have a positive impact.
If everyone in the world lived as we do in the UK, we would need three planets to support us.
This means that we are consuming two extra planets’ worth of resources. But even after we’ve
reduced our personal footprints as far as we can – which on average is about a third of our
consumption – there remains a third that is linked to government and business decisions. As
individuals we are locked into unsustainable patterns of consumption through the choices
provided by government and business. For example, out of town shopping centres require in more
people to drive to the shops. A step change is needed if we are to leave behind an unsustainable
system that is over-consuming resources. There would be positive benefits to government and
business if they were to take these considerations on board, such as reduced costs and increased
efficiency.
Collectively, individuals must put pressure on government and business to make them change.
One of the best ways to do this is to join organisations that are working with or lobbying local
authorities, MPs and businesses to help stop our ever-growing ecological debt.
8
8
Introduction
The battle for the environment will be won or lost in our cities. More than
half the world’s population now live in cities. These cities take up only
2% of the Earth’s surface but consume 75% of resources and produce
75% of all waste. However, environmentally they can be the most
efficient places to live.
This report into the ecological footprint of people in British cities was
commissioned by WWF to highlight the ways in which we are living
unsustainably and proposes opportunities for change. It presents
information about the average ecological impact caused by inhabitants in each of those cities.
We are on the cusp of the sixth wave of mass extinction that the Earth has experienced
2
. Tracking
of this degradation shows around a 30% decline in populations of terrestrial, marine and
freshwater vertebrate species between 1970 and 2003
3
. This year The World Conservation Union
(IUCN) warned that “life on Earth is disappearing fast and will continue to do so unless urgent
action is taken”
4
.
This makes depressing reading. What is driving the decrease in species populations? The answer
lies on our doorsteps. It is our consumption of resources. Our consumption here in Britain has
impacts across the world, from our consumption of palm oil that is degrading the forests in
Indonesia to our emissions of carbon dioxide that are helping to warm the world and melt the
Antarctic ice sheet. There is an inextricable link between over-consumption and species loss
5
. The
more we consume, the greater the demand on the environment and the higher the level of species
loss.
The impacts are both direct, such as the loss and degradation of forest
habitat, and indirect – through increasingly acute climate change.
There is a real imperative for action: a key WWF report
6
shows that it
is still possible to avoid a climate change catastrophe, but the world
has just five years to put the first big changes in place.
The British economist and academic, Sir Nicholas Stern, in his
government review of the economics of climate change highlighted
that we don’t have a choice about whether to embark on this journey
to combat climate change. We do have choices about how soon we
should begin and how fast we should travel
7
. But Sir Nicholas also
pointed out that it’s much cheaper to act today than wait until
tomorrow.
2
Physorg.com, 23 February 2006, Mass extinction of species has begun, www.physorg.com/news11151.html
3
Global Footprint Network WWF and ZSL, 2006, Living Planet Report.
4
IUCN, 12 September 2007, ‘Extinction crisis escalates: Red List shows apes, corals, vultures, dolphins all in danger’.
www.iucnredlist.org/wnew/
5
Millennium Ecosystem Assessment, 2005, Ecosystems and human well-being, our human planet.
6
WWF Energy Task Force, 2007, Climate Solutions: WWF’s Vision for 2050.
7
Stern, N, 2006, The Stern Review on the Economics of Climate Change.
Orang-utans in Sumatra are now
listed as critically endangered. Their
habitat is under severe pressure from
the cultivation of palm oil, used in
many products including shampoo,
margarine and biofuels. Logging for
desirable tropical hardwoods is also
squeezing the orang-utan’s habitat.
All of these products often find their
way to Britain. This is a direct link
from the footprint of our consumption
at home to species loss elsewhere in
the world.
9
9
This unsustainable use of the planet’s natural resources by consumer societies, such as ours in
Britain, is the driving force behind many environmental problems. If everyone in the world
generated carbon emissions and consumed natural resources at the rate we do in the UK, we
would need three planets to support us.
Planet Earth is all we have. It provides our food, water and fresh air. Its riches clothe us and heat
our homes. And its beauty gives us pleasure and places of recreation. The Earth acts as a bank for
all those resources we rely on to live happy, comfortable lives.
“Humanity is no longer living off nature’s interest, but drawing down its capital. This growing
pressure on ecosystems is causing habitat destruction or degradation and permanent loss of
productivity, threatening both biodiversity and human well-being.”
WWF Living Planet Report 2006
Cumulatively, all our individual footprints make up the unsustainable total demand. The solution
to this problem is for people to take individual action to break down that large footprint. We need
to change the way we live to combat climate change, conserve the world’s forests and protect our
oceans.
No-one wakes up in the morning and consciously decides to contribute to global warming; to help
cut down a tropical rainforest; or to deprive future generations of a decent standard of living. But
seemingly innocent decisions we make every day often have these unforeseen, far-reaching and
long-lasting consequences.
People are beginning to recognise that we need to change the way we treat the planet. Our
patterns of consumption need to change. But that doesn’t mean our quality of life will get worse;
indeed some of the steps and solutions in this report could help to improve it. For example,
playing an active part in local groups increases our community engagement and gives us an
opportunity to share ways of reducing the footprints we leave on the planet.
This report highlights individuals’ consumption by ranking the 60 cities in Britain by the average
Ecological Footprint of their residents.
Once people understand the impact of their actions they become empowered to do something
about it. Half the battle is making people realise that there is a problem with the way we are living
our lives.
Individuals, government and business all have their part to play to make sure we are living within
the means of the planet’s resources.
To assist in taking people on a journey towards levels of consumption that our one planet can
sustain, WWF has developed an online calculator (wwf.org.uk/calculator). The calculator
provides a simple means of measuring our Ecological Footprint and enabling people to take
practical steps to reduce it. The website also provides tailored eco-tips and has a forum to help
answer those tricky issues, such as dealing with food packaging, or deciding whether to fly or not,
and allows users to find out how other people are reducing their impacts.
10
10
What is the issue?
We now live in a world where more intense weather, patterns of droughts and floods are
becoming commonplace, as are overexploited fish stocks, destroyed forests and dried up rivers.
The era of post-war consumerism, where humanity lived in a world rich in resources that were
thought boundless, is closing as ecological limits become apparent around the world.
We have to face the fact that our consumption of everyday products has a global impact. Palm oil
used in shampoos and margarines comes from plantations where virgin tropical forests once
stood. World fisheries are being stretched to the limit due to overfishing by overly-efficient fleets.
Sea level rise as a result of global warming is displacing thousands of people from their homes
and flooding tiger habitat in the Sundarbans – a mangrove delta on the border between India and
Bangladesh. It is also threatening to submerge islands in the Pacific.
Human pressure is already threatening many of the planet’s assets. ‘Business as usual’ is likely to
accelerate these negative impacts on the very systems that we rely on to survive. People are
turning resources into waste faster than nature can turn waste back into resources. As a global
community we are consuming around 25% more than the world can sustain (see Figure 1 and 2
below). This can be kept up for a limited length of time, but if action is not taken to restore the
natural balance then ecological systems will start to collapse and environmental conditions will
become much worse than those we currently experience.
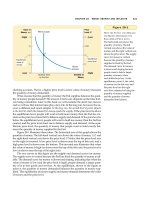
Figure 1: Humanity's Ecological Footprint. This
compares the resources mankind uses with the ability
of the Earth to provide them. Currently we need
around 1.25 planets to supply the resources we use.
Figure 2: Living Planet Index. This shows trends in
populations of terrestrial, marine, and freshwater
vertebrate species. It declined by around 30% between
1970 and 2003.
11
11
We are stretching all kinds of ecological boundaries – through climate change, overfishing, loss
of freshwater resources, and deforestation.
The results are already being experienced across the world:
• Europe has already warmed by almost 1°C over the past century, faster than the global
average. The heatwave in summer 2003 caused an estimated 70,000 premature deaths in the
EU
8
.
• More than 70% of fisheries are either overfished or are fished at their maximum capacity
9
.
• Conflicts are already occurring between pastoralists and farmers in Africa
10
.
• Himalayan glaciers are disappearing – these glaciers supply over a billion people with fresh
water during the dry season
11
.
• Deforestation rates of around 13 million hectares per year far outweigh a planting rate of four
million hectares. The deforestation that occurs is often in the areas of the planet that are
richest in species, whereas planting often takes the form of monocrop plantations, resulting in
species-poor areas.
All of these problems are symptoms of environmental degradation. The underlying cause is
unsustainable living. Ecological Footprinting is a measure used to assess sustainability; it is
therefore the key to realising sustainability in the UK and for humanity as a whole.
8
EUROPA, 29 June 2007, Climate change: Europe must take adaptation measures to lessen impacts of current and future warming,
www.europa.eu/rapid/pressReleasesAction.do?reference=IP/07/979&format=HTML&aged=0&language=EN&guiLanguage=en
9
FAO, 2005, Review of the state of world marine fishery resources,
10
NETWAS, September 2005, Water Conflicts in Tana River District, Kenya, www.netwas.org/newsletter/articles/2005/09/4
11
UNEP, 5 June 2007, ‘Fast Melting Glaciers from Rising Temperatures Expose Millions in Himalaya to Devastating Floods and
Water Shortages’. www.unep.org/Documents.Multilingual/Default.asp?DocumentID=512&ArticleID=5600&l=en
12
12
What is Ecological Footprinting?
Most people now know what a carbon footprint is. It is a measure of how much CO
2
is emitted as
a result of all aspects of our everyday lives. This is a good way of measuring the impact our
lifestyle has on the Earth. However, although CO
2
emissions make up around 70% of the
Environmental Footprint of developed countries such as the UK, we impact on the planet in other
ways than just our carbon footprint. Our Ecological
Footprint is a combination of all the things we do that
require us to draw on natural resources. It includes the
impact from our homes (e.g. the oil, gas and electricity we
use), transport (e.g. car, train and plane trips), food (e.g.
land under cultivation and fertilisers), and consumer goods
(e.g. fossil fuel energy used to make and transport goods).
In addition, it includes the fossil fuel energy and built land
required by government and business to provide
infrastructure, goods and services.
We are now developing the tools needed to assess our
impacts on the world and therefore to reduce the negative
ones. An Ecological Footprint will show, under prevailing technology, how much land and water
area a human population requires to provide the resources it consumes and to absorb its waste.
Ecological footprints are measured in global hectares (gha) – the amount of bioproductive land
and sea available on the planet. We can calculate our footprint by adding up the hectares it takes
to grow our food and farm the animals we eat; the hectares our house stands on; the hectares that
oil refineries and other energy infrastructure we depend on take up; the hectares of forest that
would be needed to absorb the CO
2
emitted by our fuels; a share of the hectares taken up by our
roads; and everything else we do that has an impact on the planet’s ecology.
Some of these are things we can do something about directly ourselves (e.g. ensure that our
homes are properly insulated, and use public transport, walk or cycle where possible rather than
use our cars). Others are out of our control (e.g. how many new roads are built or whether schools
use compact fluorescent light bulbs), though we can still influence them by our investment
decisions and by writing to our MPs and lobbying parliament.
We can measure sustainability by comparing the Ecological Footprint of a population with the
biocapacity of the planet to produce these resources in the long-term (i.e. what we use compared
to what is available). If we are using resources faster than they can be replenished, then we are
living beyond our means and using the planet unsustainably.
The results of studies show that consumption is not evenly spread. It changes from country to
country, city to city and person to person. On a country level, research shows that if everyone
generated carbon emissions and consumed natural resources at the rate we do in the UK we
would need three planets to support us. Some countries with higher Gross Domestic Product per
person and longer life expectancy have a lower Ecological Footprint (e.g. Germany, Switzerland
and the Netherlands – see Table 1, below). However, even these countries consume at above the
world average of 1.25 planets per person.
“As of 2003, there are
approximately 11.2 billion global
hectares of area available. In that
same year, humanity demanded
products and services from the
equivalent of 14.1 billion global
hectares.
This overshoot, if it continues, will
put global ecosystems at serious
risk of degradation or collapse.”
Kitzes et al. 2007
13
13
For now this over-consumption is being balanced by countries that consume less than their ‘fair
share’. For example, India is consuming at a rate of 0.4 planets per person – only a seventh of the
UK’s consumption per person. However, those countries that consume at below the sustainable
rate will almost certainly increase their footprints as their economies develop.
Table 1: Some standard of living indices compared with consumption
UK
Switzerland
Germany
Netherlands
India
Planets
needed to
support
consumption
rates
3.1
2.8
2.5
2.4
0.4
Infant
mortality rate
(deaths/1,000
live births)
5.01
(2007 est.)
4.28
(2007 est.)
4.08
(2007 est.)
4.88
(2007 est.)
34.61
(2007
est.)
Life
expectancy at
birth (years)
78.70
(2007 est.)
80.62
(2007 est.)
78.95
(2007 est.)
79.11
(2007 est.)
68.59
(2007
est.)
GDP – per
capita (US$)
$31,800
(2006 est.)
$34,000
(2006 est.)
$31,900
(2006 est.)
$32,100
(2006 est.)
$3,800
(2006
est.)
Source:
14
14
The Ecological Footprint of the UK
If everyone in the world lived like a citizen of the UK does, we would need three planets to
provide the resources to sustain us. Therefore the Ecological Footprint of UK citizens can be
thought of as three planets. Since we live on one planet, the UK is clearly living in an
unsustainable manner.
The diagram below shows how the UK’s footprint of three planets can be broken down into three
distinct areas – with a planet for each.
First planet of consumption. We have one planet with an abundance of
resources. We can use this more efficiently, maintaining our quality of life as well
as being sustainable.
Second planet of consumption. This may be accounted for by the personal
choices of UK citizens. The main components that make up an individual’s
footprint can be broken down into four areas: transport, food, homes, and the
consumables we buy, such as clothes, jewellery, cameras and TVs.
Third planet of consumption. This comprises government and business
infrastructure that requires institutional change if it is to be reduced. As
individuals, we are locked in to using these resources because of the way in which
our country is run, how our services are supplied, our transport network is
operated and our businesses are managed.
By taking simple individual actions in our everyday lives we can reduce our impact on the planet
and improve our quality of life. In the UK, our homes account for 27% of our carbon emissions –
from gas and electricity use to household appliances – and we already have all the technology we
need to substantially reduce this.
For example, by insulating our cavity walls we can cut heat loss in our homes by around a third.
It is easily available, cheap and will save all of those homes money in the long run, as well as
reducing their impact on climate change. Yet 11 million houses in the UK that could have cavity
wall insulation have yet to install it. Other individual actions revolve around our choice of
transport, the food we consume – buying locally produced goods – and the quantity of
consumable items we buy.
The WWF footprint calculator provides a first step for individuals. Measuring our Ecological
Footprint and understanding the drivers behind it is the first step in reducing our impact on the
planet.
Reducing our own footprint will go a long way, but is not sufficient in itself, as much over-
consumption is embedded in the infrastructure of our society. Infrastructure is not only the layout
of our cities, their transport networks, housing, hospitals and schools, but also the way resources
are consumed to create and supply us with the products we desire, from vegetables to ipods, socks
to cars.
15
15
Therefore we need to work with government and business if we are to live within the means of
one planet. Reducing our Ecological Footprint personally and across UK institutions is not only
better for the planet, but reduces our reliance on other countries, increases our energy security and
saves money.
The UK government was the first in the world to commit to enshrine in law a 60% cut in carbon
emissions by 2050. However, we will need an 80% reduction, as the scientific evidence continues
to show. The Scottish government has now taken the lead by committing to introducing an 80%
cut in the upcoming Scottish Climate Change Bill.
We need to become active citizens: as well as taking responsibility for the way we consume in
our own lives, we must add our voices to tens of thousands of others to demand that the
government introduces environmentally sustainable policies and encourages businesses to ensure
their products and practices allow us to lead better quality, sustainable lives. Far from having
negative impacts on the UK economy, this presents opportunities for the UK to lead the world in
green technology and green practice. The figure below summarises the steps we need to take to
reduce resource use in the UK from three planets to one.
Cities have a pivotal role to play in tackling climate change. City councils have the power to
deliver better homes, improved public transport and more energy-efficient services. WWF is
working with local authorities in the UK to reduce the impact that their cities have on the global
environment
12
.
In Aberdeen, council officers are using the Ecological Footprint to help plan low carbon
communities (www.scotlandsfootprint.org). In London, WWF is helping plan for a One Planet
Olympics. Cardiff Council plans to use the findings of its footprint to determine policy and as a
tool to brief the local authority on how to meet its sustainable development goals. Sunderland is
using Ecological Footprint to help guide its community strategy. The York footprinting study,
completed in 2002, calculated the average footprint of each resident. This has helped to guide the
City of York Council’s overall policy framework, most especially with regard to community
planning.
For more information about WWF’s work with cities and communities go to
wwflearning.org.uk/localmatters.
12
wwflearning.org.uk/ecological-budget/localauthorities
16
16
Calculating a city footprint
The centrepiece of the report is a ranking of the 60 cities in Britain according to the average
Ecological Footprint size of their residents. The results are calculated in global hectares (gha) per
person and expressed as the Ecological Footprint per capita (EF/cap), rather than total gha for
each city, which would favour smaller cities.
The Ecological Footprint (EF) is a measure of natural resource use. It works like an economic
indicator in that the available biocapacity per year is equivalent to income. Any resources used
beyond this amount can be seen as eating into the environmental capital of the Earth.
The footprint of a region is the area of land and sea required to maintain its levels of
consumption, both to provide food and materials and to absorb waste and pollution.
In the old days, environmental impacts and resource depletion issues were generally localised. A
village that indulged in unsustainable felling for firewood would soon lose its forest. These days
there is a mismatch of location between consumption and the implications of consumption.
Ecological Footprinting helps to show people just how much pressure their patterns of
consumption are putting on the planet.
SECTORS
To calculate average footprints, the international research group Stockholm Environment Institute
(SEI) used spending data for each of the local authorities, and national data, to indicate how
resource intensive the lifestyle of the average citizen living there is. The spending data is split
into eight sectors: housing, transport, food, consumer items, private services, public services,
capital investment, and other.
Housing
Housing includes the physical footprint of the house as well as the impacts of supplying energy
services, such as the forested land that would be required to sequester the CO
2
that is emitted by
heating and electricity provision.
Transport
A person’s transport footprint again counts the CO
2
sequestration land for any fossil fuel energy
used. It also contains a share of the total land area under tarmac.
Food
The food footprint includes the land used for food production. This is both primary land used for
growing cereals, etc. for human consumption, as well as pasture and land dedicated to providing
animal feed. It also includes the sea area required for fishing. Finally the sizeable fossil fuel
energy inputs into agriculture are included as sequestration land.
Consumer items
This includes the fossil fuel energy used to make and transport the things we buy that are not food
or services – such as electronic goods, clothes, etc. It also includes the land required to extract the
minerals and to dispose of the products at the end of their useful life.
17
17
Private services
The private services footprint counts the impacts of the business infrastructure we all rely on for
facilities such as banking, hotels, pubs and restaurants.
Public services
This is assessed as being the same for each local authority and shares out the fossil fuel energy
and built land requirements of government between all the citizens of the country.
Capital investment
Again, this is the same for all local authorities. It refers to the capital depreciation of the
infrastructure we all depend on.
Other
This is also the same for all local authorities and includes anything in the national accounts that is
not covered by the other categories.
ECOLOGICAL FOOTPRINTING OF CITIES
This report is based on research carried out by the SEI for WWF, which established the average
Ecological Footprint (EF/cap) of the inhabitants of all local authorities (LAs) in England,
Scotland and Wales
13
.
Where city and local authority boundaries coincide, the LA footprints already provide a good
indication of the average footprint of an inhabitant of that city. However, where boundaries do
not coincide, the EF/cap within the city boundary needs to be separated from the EF/cap outside
the city. This is because the average footprint of inhabitants of rural areas is different to that of
city dwellers.
This adjustment is made first by finding the average footprint of non-urban LAs adjoining the one
that includes the city. That average non-urban footprint is then applied to the rural population of
the LA being assessed. (The source for rural/urban split in England is Defra
14
. In Scotland the
source is the General Register Office for Scotland
15
. Wales was treated differently as explained
below.) This rural footprint is then subtracted from the total footprint of the city LA. Finally, the
remainder is divided by the urban population to find the city’s EF/cap (see the example of
Winchester, detailed below).
London is a special case as it is made up of a number of boroughs. However, as the rural
population of all boroughs is negligible (much less than 10%), the average EF/cap of the 32
boroughs is used.
13
SEI, www.sei.se/reap/local.php
14
From www.defra.gov.uk/rural/ruralstats/rural_focus/rural_focus_la.htm
15
www.gro-scotland.gov.uk/files/00settle-t2.pdf
18
18
EXAMPLE CITIES
Simple city:
For cities that have negligible rural population (less than 10%), the EF/cap from SEI is sufficient.
Example: Birmingham (0% rural)
Make-up: Housing 1.52
Transport 0.83
Food 1.22
Consumer items 0.61
Private services 0.45
Public services 0.37
Capital investment 0.24
Other -0.01
Ecological Footprint (EF/cap) 5.22
16
Compound city:
In this study, this only applies to London and is easily found as the rural population of London is
negligible.
London
Average EF/cap of all London boroughs 5.48
Cities within a larger LA:
The 22 cities within LAs with a rural population greater than 10% require adjustment to assess
only the city dwellers, as described above.
Example: Winchester
Total LA population 106,070
Percentage of rural dwellers 59%
Rural population 62,581
Urban population 43,489
Average EF/cap of surrounding rural LAs 6.05 gha
Winchester’s rural population footprint 378,471 gha
Winchester LA total footprint 661,833 gha
Winchester’s urban population footprint 283,362 gha
Winchester city EF/cap 6.52 gha
The spreadsheet used to calculate this determines the make-up of the footprint by using the same
algorithm on all filters, allowing for comparison between cities.
16
Does not sum due to rounding.
19
19
Bath and Wells
As both Bath and Wells are in the LA of Bath and North East Somerset, using this methodology
produces the same EF/cap for both cities. This is a limitation that could be addressed through
more detailed data.
Cities in Wales
In Wales, the urban areas of Newport, Cardiff and Swansea were assumed to have negligible rural
population. Rural population in Pembrokeshire (St Davids) and Gwynedd (Bangor) were found
from the Office of National Statistics
17
. As these cities are so small, and unlikely to have a
substantially different character to the surrounding towns and villages, the decision has been
taken to use the footprints unadjusted, as with simple cities, above.
Cities in Northern Ireland
The six cities Northern Ireland have not been assessed in this report since the data available is not
of the same quality as those for the rest of the UK.
17
www.statistics.gov.uk/pdfdir/rural0305.pdf
Newport 1
Plymouth 1
Salisbury 3
Kingston upon Hull 3
Stoke on Trent 3
Gloucester 6
Wakefield 6
Sunderland 8
Truro (Carrick) 9
Wolverhampton 9
Salford 9
Swansea 9
Coventry 13
Exeter 14
Cardiff 15
Glasgow (City of Glasgow) 15
Bradford 17
Lincoln 17
Birmingham 17
Bristol (City of Bristol) 17
Liverpool 21
Nottingham 21
St Davids (Pembrokeshire) 21
Bangor (Gwynedd) 24
Worcester 24
Leicester 24
Carlisle 24
Derby 28
Sheffield 29
York 29
Leeds 31
Dundee City 31
Peterborough 33
Norwich 33
Preston 33
Inverness (Highland) 33
Manchester 37
Rippon (Harrogate) 37
Bath (Bath and NE Somerset) 39
Wells (Bath and NE Somerset) 40
Newcastle upon Tyne 41
Lancaster 42
Lichfield 43
London 44
Stirling 45
Hereford (County of Herefordshire) 45
Ely (East Cambs) 47
Aberdeen City 48
Chester 49
Edinburgh (City of Edinburgh) 50
Portsmouth 51
Cambridge 52
Durham 53
Southampton 54
Oxford 55
Canterbury 55
Brighton and Hove 57
Chichester 58
St Albans 59
Winchester 60
British city residents’ footprints ranked
food
10%
travel
25%
home
25%
stuff
40%
Your footprint is
3.2 planets
Your CO2 emissions are 8.4
tonnes per annum
food
10%
travel
25%
home
25%
stuff
40%
Your footprint is
3.2 planets
Your CO2 emissions are 8.4
tonnes per annum
0.00 0.50 1.0 1.50 2.00 2.50 3.00 3.50 4.00
1.00
The table shows a clear rise in
consumption from the lowest average
citizen to the highest, with 0.84 planets
between them. While the lowest cities
consume under the UK average of
3.1 planets they are still consuming
at a rate 2.5 times higher than the
planet can support.
Planets needed to support consumption rate
Cities in order of ranking
Results
Myriad Pro
21
21
ENGLAND – TOP 10 SMALLEST FOOTPRINTS
Plymouth 2.78 planets
Salisbury 2.79 planets
Kingston upon Hull 2.79 planets
Stoke on Trent 2.79 planets
Gloucester 2.81 planets
Wakefield 2.81 planets
Sunderland 2.83 planets
Truro 2.84 planets
Wolverhampton 2.84 planets
Salford 2.84 planets
22
22
ENGLAND – TOP 10 LARGEST FOOTPRINTS
Winchester 3.62 planets
St Albans 3.51 planets
Chichester 3.49 planets
Brighton and Hove 3.47 planets
Canterbury 3.40 planets
Oxford 3.40 planets
Southampton 3.27 planets
Durham 3.24 planets
Cambridge 3.22 planets
Portsmouth 3.21 planets
England top ten largest footprints
0.00
0.50
1.00
1.50
2.00
2.50
3.00
3.50
4.00
Portsmouth
Cambridge
Durham
Southampton
Oxford
Canterbury
Brighton and
Hove
Chichester
St. Albans
Winchester
City
Planets
23
23
Breakdown of largest English footprints
0.00
1.00
2.00
3.00
4.00
5.00
6.00
7.00
Portsmouth
Cambridge
Durham
Southampton
Oxford
Canterbury
Brighton and
Hove
Chichester
St. Albans
Winchester
City
Footprint gha/capita
Private Services
Consumer Items
Food
Transport
Housing
Public Services
Capital Investment
ENGLAND – 10 FACTS
1. There are 49 cities in England, which have an average footprint of 3.02 planets. This is
smaller than the average footprint in Scottish cities, but larger then that of Welsh cities.
2. The inhabitants of the top-ranked city, Plymouth, have on average 30% lower footprints than
the inhabitants of bottom-ranked city, Winchester (2.78 planets and 3.62 planets
respectively).
3. Londoners have the second lowest transport footprint (0.72 gha).
4. The citizens of Chichester use almost their entire fair share of global hectares on housing
alone (1.77 of 1.8 gha).
5. The citizens of St Albans use most of their fair share just on transport (1.7 of 1.8 gha).
6. Leicester has the lowest food footprint (1.12 gha) while Durham has the highest (1.52 gha).
7. Sunderland uses the least of its footprint on consumer items (0.58 gha); Winchester uses the
most (1.11 gha) – almost double.
8. Chichester has a 23% bigger housing footprint than Kingston upon Hull (1.77 gha and 1.37
gha respectively).
9. Sunderland (1.34 gha) and Durham (1.52 gha) both come among the bottom five on food
footprints. This is despite Sunderland having one of the smallest overall footprints (5.09 gha)
and Durham having one of the largest (5.83 gha).
10. Because of its large population, London’s total footprint is 39,500,000 gha – an area the size
of Germany and Denmark combined.
24
24
CASE STUDY: LONDON TRANSPORT
Sector
Footprint gha
Ranking in Britain
Total footprint
5.48
44
Transport
0.72
2
The transport footprint of Londoners is an interesting case. They have the second lowest transport
EF/cap in England despite coming 44th in the list of overall footprints in Britain. This is because
London has a good, well-used public transport system at affordable prices. London is at an
advantage because it has such a large number of people concentrated in a small area, which
makes running public transport a more attractive proposition. There are also disincentives to car
ownership in the city, such as limited car-parking and the congestion charge for central London.
However, it should be pointed out that the Home Counties have very large transport footprints.
This is most likely due to people commuting into London, as well as the relative level of
affluence (which is related to higher levels of car ownership
18
) in the Home Counties.
Working from home or closer to home, and travelling by public transport are more sustainable
options than commuting long distances. They also mean less time and money wasted on
travelling.
WINCHESTER AND SALISBURY – A COMPARISON
On the surface, Winchester and Salisbury might be expected to be quite similar. They are only
80km apart. Both are old cathedral cities in the south of England, with similar populations
(43,489 and 43,608 respectively). In fact, the cities even share similar problems. Both their
cathedrals are thought to be becoming more at risk from flash flooding due to climate change
19
.
But while Salisbury has the third smallest footprint in Britain, Winchester has the largest. This
case study takes a look at some environmental and economic indicators to see what the
differences are.
Ecological Footprint
Winchester 3.62 planets
Salisbury 2.79 planets
18
CfIT, 2006, Sustainable Transport Choices and the Retail Sector, www.cfit.gov.uk/docs/2006/stc/technical/pdf/stc-technical01.pdf
19
www.defra.gov.uk/news/2007/070508a.htm
25
25
Ecological Footprint breakdown
0.0
0.2
0.4
0.6
0.8
1.0
1.2
1.4
1.6
1.8
Housing Transport Food Consumer
Items
Private
Services
Sector
gh a
Winchester
Salisbury
Housing
Winchester 1.69 gha
Salisbury 1.49 gha
Transport
Winchester 1.18 gha
Salisbury 0.72 gha
Food
Winchester 1.31 gha
Salisbury 1.14 gha
Consumer items
Winchester 1.11 gha
Salisbury 0.6 gha
Private services
Winchester 0.63 gha
Salisbury 0.46 gha
In each of the footprint sectors, Winchester has a higher footprint than Salisbury. It is much
higher for consumer items and transport. The difference is smaller but still noticeable for housing
and food.
Salisbury performs well on transport, food and consumer items but performs worse than the
average English city on housing and private services.