Tài liệu Energy Balance in Motion potx
Bạn đang xem bản rút gọn của tài liệu. Xem và tải ngay bản đầy đủ của tài liệu tại đây (3.12 MB, 111 trang )
SpringerBriefs in Physiology
For further volumes:
/>Klaas R. Westerterp
1 3
Energy Balance in Motion
Klaas R. Westerterp
Department of Human Biology
Maastricht University
Maastricht
The Netherlands
© The Author(s) 2013
This work is subject to copyright. All rights are reserved by the Publisher, whether the whole or part
of the material is concerned, specifically the rights of translation, reprinting, reuse of illustrations,
recitation, broadcasting, reproduction on microfilms or in any other physical way, and transmission or
information storage and retrieval, electronic adaptation, computer software, or by similar or dissimilar
methodology now known or hereafter developed. Exempted from this legal reservation are brief excerpts
in connection with reviews or scholarly analysis or material supplied specifically for the purpose of
being entered and executed on a computer system, for exclusive use by the purchaser of the work.
Duplication of this publication or parts thereof is permitted only under the provisions of the Copyright
Law of the Publisher’s location, in its current version, and permission for use must always be obtained
from Springer. Permissions for use may be obtained through RightsLink at the Copyright Clearance
Center. Violations are liable to prosecution under the respective Copyright Law.
The use of general descriptive names, registered names, trademarks, service marks, etc. in this publication
does not imply, even in the absence of a specific statement, that such names are exempt from the relevant
protective laws and regulations and therefore free for general use.
While the advice and information in this book are believed to be true and accurate at the date of
publication, neither the authors nor the editors nor the publisher can accept any legal responsibility for
any errors or omissions that may be made. The publisher makes no warranty, express or implied, with
respect to the material contained herein.
Printed on acid-free paper
Springer is part of Springer Science+Business Media (www.springer.com)
ISSN 2192-9866 ISSN 2192-9874 (electronic)
ISBN 978-3-642-34626-2 ISBN 978-3-642-34627-9 (eBook)
DOI 10.1007/978-3-642-34627-9
Springer Heidelberg New York Dordrecht London
Library of Congress Control Number: 2012953017
v
Man survives in an environment with a variable food supply. Energy balance is
maintained by adapting energy intake to changes in energy expenditure and vice
versa. Human energetics is introduced using an animal energetics model including
growth efficiency, endurance capacity and adaptation to starvation. Animal energet-
ics was the starting point for assessment of energy expenditure with respirometry and
doubly labelled water and of body composition with densitometry and hydrometry.
Examples of endurance performance in athletes and non-athletes illustrate limits in
energy expenditure. There is a complicated interaction between physical activity
and body weight. Body movement requires energy as produced by muscles. Thus,
there is an interaction between physical activity, body weight, body composition
and energy expenditure. Overweight is caused by energy intake exceeding energy
expenditure. The questions of how energy intake and energy expenditure adapt to
each other are dealt with. The evidence presented, originating from fundamental
research, is translational to food production and to physical activity-induced energy
expenditure in competitive sports. Another obvious and relevant clinical application
deals with overweight and obesity, with the increasing risk of developing diabetes,
cardiovascular disease and cancer. Finally, activity induced energy expenditure of
modern man is put in perspective by compiling changes in activity energy expendi-
ture, as derived from total energy expenditure and resting energy expenditure, over
time. In addition, levels of activity energy expenditure in modern Western societies
are compared with those from third world countries mirroring the physical activ-
ity energy expenditure in Western societies in the past. Levels of physical activity
expenditure of modern humans are compared with those of wild terrestrial mam-
mals as well, taking into account body size and temperature effects. Taken together
this book shows how energy balance has been in motion over the past four decades.
Preface
vii
Dr. Klaas R. Westerterp is professor of Human
Energetics in the Faculty of Health, Medicine and Life
Sciences at Maastricht University, The Netherlands.
His M.Sc in Biology at the University of Groningen
resulted in a thesis titled ‘The energy budget of the
nesting Starling, a field study’. He received a grant
from the Netherlands Organisation for Scientific
Research (FUNGO, NWO) for his doctorate research
in the Faculty of Mathematics and Natural Sciences
at the University of Groningen. His Ph.D. thesis was
titled ‘How rats economize, energy loss in starva-
tion’. Subsequently, he performed a three-year post-
doc at Stirling University in Scotland supported
by a grant from the Natural Environment Research
Council (NERC), and a two-year postdoc at the University of Groningen and the
Netherlands Institute of Ecology (NIOO, KNAW) with a grant from the Netherlands
Organisation for Scientific Research (BION, NWO) in order to work on flight ener-
getics in birds. In 1982, he became senior lecturer and subsequently full professor
at Maastricht University in the Department of Human Biology. Here, his field of
expertise is energy metabolism, physical activity, food intake and body composition
and energy balance under controlled conditions and in daily life. He was editor in
chief of the Proceedings of the Nutrition Society and he is currently a member of
the Editorial Board of the journal Nutrition and Metabolism (London) and of the
European Journal of Clinical Nutrition, and editor in chief of the European Journal
of Applied Physiology.
About the Author
ix
The content of this book is based on work performed with many students and
colleagues as reflected in the references. Paul Schoffelen and Loek Wouters tech-
nically supported measurements on energy expenditure with respirometry and
doubly labelled water. Margriet Westerterp-Plantenga reviewed the subsequent
drafts of the manuscript. Louis Foster edited the final text.
Acknowledgments
xi
1 Introduction, Energy Balance in Animals 1
2 Energy Balance 15
3 Limits in Energy Expenditure 37
4 Energy Expenditure, Physical Activity, Body Weight
and Body Composition 47
5 Extremes in Energy Intake 63
6 Body Weight 71
7 Growth, Growth Efficiency and Ageing 83
8 Modern Man in Line with Wild Mammals 91
Appendix 97
Glossary 101
References 105
Index 111
Contents
xiii
ADMR Average daily metabolic rate
AEE Activity-induced energy expenditure
ATP Adenosine triphosphate
BMI Body mass index
BMR Basal metabolic rate
COPD Chronic obstructive pulmonary disease
DEE Diet-induced energy expenditure
DEXA Dual energy X-ray absorptiometry for the measurement of body
components like mineral mass
EE Energy expenditure
EG Energy deposited in the body during growth
EI Energy intake
FAO Food and agriculture organisation of the United Nations
FFM Fat-free body mass
FM Fat mass of the body
SMR Sleeping metabolic rate
TEE Total energy expenditure
Tracmor Triaxial accelerometer for movement registration
UNU United Nations University
WHO World Health Organization
Abbreviations
1
Abstract Man is an omnivore and originally met energy requirements by hunt-
ing and gathering. Man evolved in an environment of feast and famine: there were
periods with either a positive or negative energy balance. As an introduction to
human energetics, this book on energy balance in motion starts with a chapter on
animal energetics. How do animals survive and reproduce in an environment with
a variable food supply? The examples on animal energetics illustrate how animals
grow, reproduce and survive periods of starvation. It is an introduction to method-
ology and basic concepts in energetics. Growth efficiency of a wild bird in its nat-
ural environment, here the Starling, is similar to a farm animal like the Domestic
Fowl. Reproductive capacity is set by foraging capacity, determined by food avail-
ability and the capacity parents can produce food to the offspring. Birds feeding
nestlings reach an energy ceiling where daily energy expenditure is four times
resting energy expenditure. Starvation leads to a decrease in energy expenditure,
where the largest saving on energy expenditure can be ascribed to a decrease in
activity energy expenditure.
Keywords Activity factor • Body temperature • Doubly labelled water method •
Energy ceiling • Gross energy intake • Growth efciency • Metabolizable energy •
Starvation
The Energy Budget of the Nestling Starling
From the late Middle Ages, nestling Starlings were harvested to prepare paté or
soup. As such, Starlings were a source of animal protein in a hunter and gatherer
system. Passerine birds have short incubation periods (12–14 days) and a nestling
period of some weeks, characterized by rapid growth. The conversion ratio of food
to energy incorporated in the growing body is high. Here the energy budget of
the nestling Starling is presented for the calculation of the growth efficiency of a
wild animal in its natural environment. The result is compared with figures for the
Domestic Fowl, one of our current sources for animal protein.
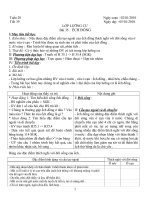
In the Netherlands, wild Starlings were offered artificial nest sites by mount-
ing ‘Starling pots’ against a building (Fig. 1.1). Pots were made from clay with a
Introduction, Energy Balance in Animals
Chapter 1
K. R. Westerterp, Energy Balance in Motion, SpringerBriefs in Physiology,
DOI: 10.1007/978-3-642-34627-9_1, © The Author(s) 2013
2
1 Introduction, Energy Balance in Animals
long neck, and a hole 5 cm in diameter as entrance. Pots were mounted against the
wall of a house at a height of some meters with the neck horizontal. At the back,
against the wall, was a hole to harvest the chicks. The optimal harvest time is just
before fledging, in the third week after the eggs hatch. An average brood provides
four to five chicks of 70 g each or about 300 g Starling. Starlings prefer to breed
in colonies. Thus, one can mount several pots on the same house. Additionally,
Starlings often start a second brood, especially when taking the chicks disturbs the
first brood.
The Starling (Sturnus vulgaris) is a feasible subject for a field investigation.
As a hole nester readily accepting nest-boxes, a Starling colony can be founded at
any convenient point bounding on pastureland for foraging. The nestlings develop
from hatching to fledging in 19–21 days. There is close synchrony in breeding
behaviour within the colony and the adults forage in the same general area allow-
ing several adults to be observed at the same time, thus duplicating observations.
Growth efficiency, the relation between energy intake and the energy deposited in
the body during growth, is assessed by measurement of the separate components of
Fig. 1.1 Five ‘Starling pots’, mounted against the front of a house or pub, with somebody
inspecting from the loft (Etching Claes Janz Visscher. The village party, 1617. With permission:
Rijksmuseum, Amsterdam)
3
the energy budget: food intake, rejecta, metabolizable energy, energy expenditure,
and energy stored in growth (Fig. 1.2). Food provides the organism with energy
for maintenance, temperature regulation activity and growth. Of the total incoming
food energy or gross energy, a part is voided as rejecta including both faeces and
urine. The remainder is commonly termed metabolizable energy. Measurements of
the separate components of the energy budget of the nestling Starling are described
to illustrate the methodology and general principles of energetics (Westerterp 1973).
Energy intake of the nestlings is measured by taking samples of the meals, and
by counting the total number of meals per day. Meals can be sampled by the col-
lar method. Nestlings are collared with a cotton thread around the neck preventing
swallowing of a meal after feeding. Meals are removed after each parental visit
for later analysis with regard to diet composition and energy content. Depending
on age, nestlings can be collared for periods of one to three hours, between some
hours after sunrise and before sunset so as not to interfere with the very first and
last feedings of the day. The feeding frequency can be determined by automatic
counting of parental visits with an electric contact in the nest entrance. Energy
output in rejecta is measured by taking samples of rejecta, and by observing the
production frequency of rejecta. Faeces and urine are excreted together in mem-
branous sacs, an adaptation enabling the parents to remove them and thus keeping
the nest clean. The collection of samples is a simple matter, especially after the
fifth day when the nestlings automatically produce a faecal sac when handled. The
frequency of faecal sac production is determined by watching the parents as they
carry off the glistening white faecal sacs from the nest. The energy content of food
and faecal samples is determined by bomb calorimetry.
The first days after hatching, chicks are fed with spiders; subsequently: leather-
jackets (Tipula paludosa), earthworms (Lumbricidae), and beetle species comprise
Fig. 1.2 Diagrammatic representation of the energy budget of a nestling Starling (After Wester-
terp 1973)
The Energy Budget of the Nestling Starling
4
1 Introduction, Energy Balance in Animals
the main dietary components. Spiders provide some 80 % metabolizable energy;
whereas, leatherjackets, worms and beetles provide only 60 % metabolizable
energy. However, Starlings cannot manage to provide sufficient high quality food
like spiders to meet the increasing energy requirement of growing chicks. A three-
day chick weighs 20 g and consumes 14 g food per day. After two weeks, body
weight and food intake is tripled. To meet the energy requirement of a brood of
four or five chicks, the parents together collect daily some 200 g of leatherjackets,
earthworms and beetles. Additionally, they have to meet their own energy require-
ment. Nestling feeding parents have to work at their upper limit. As shown in
Chap. 3, they perform at a similar level as one of the most demanding endurance
performances in man: the Tour de France.
Metabolizable energy, gross energy intake corrected for energy loss in
rejecta, is available for body maintenance, for maintaining body temperature,
physical activity and growth. After hatching, chicks are brooded nearly con-
stantly by one of the parents, but after a week this only happens overnight.
Then, parents are both foraging from sunrise to sunset and the growing chicks
get more physically active in the nest. Thus initially, 50 % of the metabolizable
energy goes to growth. This fraction decreases to zero just before edging. Over
the total interval from hatching to edging, 22 % of the metabolizable energy is
converted to growth, in this case in Starling. This is equivalent to 14 % of the
total or gross energy intake. This is similar to that of 16 % for Domestic Fowl.
Growth efficiency, the relation between energy intake and the energy depos-
ited in the body during growth, does not depend on the pattern of ontogeny but
seems rather a function of the type of food. Higher figures are reported for fish-
eating birds.
Natural selection favours individuals producing the optimal number of fertile
offspring. Starlings habitually lay a clutch of three to seven eggs. The figures as
presented above were mainly from nests with four chicks. The question is whether
the production of offspring is higher for a larger brood size. Is the food require-
ment of a chick in a larger brood lower than in a smaller brood? The higher
return in a larger brood could be a reflection of the reduced energy requirement
for maintaining body temperature through huddling. Comparative observations in
broods ranging in size from three to seven chicks showed food intake per gram of
growth to be optimal for a brood of five (Fig. 1.3). A chick in a brood of five needs
10–20 % less energy to reach a given body weight at fledging than in a brood of
three, a saving probably mainly based on huddling behaviour. This trend does not
continue with a further increase to brood size seven. Here a chick needed 5–10 %
more energy. Deterioration of the insulative properties of the nest in the big-
gest broods might explain this. Additionally, chicks in bigger broods spend more
energy in activity competing for food. Parents of big broods have to collect more
food and tend to spend less time in nest sanitation. They bring in a higher pro-
portion of leatherjackets and earthworms with higher water content, causing thin
rejecta, which are difficult to remove.
In conclusion, growth efficiency of a wild Starling in its natural environment is
similar to a farm animal like the Domestic Fowl.
5
Foraging Limits in Free Ranging Birds
The number of offspring a bird can produce is mainly a function of food availabil-
ity and foraging capacity. In the Starling it was the availability of spiders, leath-
erjackets, earthworms and beetles, and how much a bird can collect to feed the
nestlings. Additionally the parent has to meet its own energy requirement for the
activity by foraging. The most energy demanding activity in this situation is flying
up and down between the foraging grounds and the nest. Thus, the main determi-
nant for breeding success of the chicks is the working capacity of the parents. As
mentioned before, nestling feeding parents reach a ceiling that caps the energetic
effort an animal or human can maintain over a timeframe of days or weeks. This
led to the question how to measure energy expenditure in free ranging animals.
The method of choice was the doubly labelled water method. The method was
invented in 1955, was validated in laboratory rats and got its first field applica-
tion in birds like racing pigeons during long distance flights. It subsequently was
applied for the measurement of energy expenditure in man under daily living con-
ditions. Nowadays, it is the gold standard for the assessment of energy require-
ment of modern man. Presented evidence in this book on energy balance in motion
is largely based on studies where energy expenditure and physical activity is quan-
tified with doubly labelled water.
The doubly labelled water method for the measurement of energy expenditure
is based on the discovery that oxygen in the respiratory carbon dioxide is in iso-
topic equilibrium with the oxygen in body water. The technique involves enrich-
ing the body water of an animal with an isotope of oxygen and an isotope of
Fig. 1.3 Food intake per
gram growth of a nestling
Starling in relation to brood
size (After Westerterp et al.
1982)
Foraging Limits in Free Ranging Birds
6
1 Introduction, Energy Balance in Animals
hydrogen and then determining the washout kinetics of both isotopes. Most of the
oxygen isotope in a labelled animal is lost as water, but some is also lost as car-
bon dioxide because CO
2
in body fluids is in isotopic equilibrium with body water
due to exchange in the bicarbonate pools. The hydrogen isotope is lost as water
only. Thus, the washout for the oxygen isotope is faster than for the hydrogen iso-
tope, and the difference represents the CO
2
production. The isotopes of choice are
the stable, heavy, isotopes of oxygen and hydrogen, oxygen-18 (
18
O) and deute-
rium (
2
H), since these avoid the need to use radioactivity and can be safely used
in any organism (Fig. 1.4). Both isotopes naturally occur in drinking water and
thus in body water. Oxygen-18 (
18
O) has eight protons and ten neutrons instead
of the eight protons and eight neutrons found in normal oxygen (
16
O). Deuterium
(
2
H) has one proton and one neutron instead of one neutron for normal hydro-
gen (
1
H). ‘Normal’ water consists largely of the lighter isotopes
1
H and
16
O, the
natural abundance for
2
H is about 150 parts per million or 150 ppm and for
18
O
2000 ppm. Enriching the body water with doubly labelled water (
2
H
2
18
O) for the
measurement of energy expenditure implies an increase of the background levels
as mentioned with 200–300 ppm for
18
O and with 100–150 ppm for
2
H. The CO
2
production, calculated from the subsequent difference in elimination between the
two isotopes, is a measure of metabolism. Carbon dioxide is produced by oxida-
tion of carbohydrate, protein and fat to provide energy. It can be converted to units
of energy expenditure by incorporating knowledge of the chemical composition of
the food being oxidised to calculate the energy equivalent of the CO
2
produced.
Classic examples of free ranging birds reaching foraging limits are Hirundines
like Sand Martins (Riparia riparia), Swallows (Hirundo rustica) and House
2
H
2
18
O
2
H
18
O
H
2
18
O CO
18
O
2
HHO
K
2
r H
2
O
K
18
r CO
2
+r H
2
O
K
18
– K
2
= rCO
2
Labels water
pool
Labels water and
bicarbonate pools
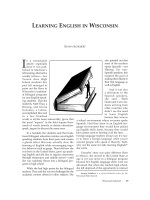
Fig. 1.4 The principle of measurement of carbon dioxide production with doubly labelled water
(
2
H
2
18
O). After administration of water labelled with heavy oxygen (
18
O) and heavy hydrogen
(
2
H), the two isotopes mix with the body water, where
18
O exchanges with CO
2
in the bicarbo-
nate pools as well. Thus, the elimination rate of
2
H (K
2
) is a measure for water loss (rH
2
O) and
the elimination rate of
18
O (K
18
) is a measure for rH
2
O plus carbon dioxide production (rCO
2
),
and rCO
2
= K
18
−K
2
7
Martins (Delichon urbica). Hirundines can stay on the wing day round, where they
feed on flying insects. The most extreme example is the Swift (Apus apus), it only
comes down to breed. Then, they occupy a hole in a steep cliff, or nowadays often
in high buildings. To get again on wing, they need a free fall of some meters, as
the legs are not strong enough to take off from the ground. A grounded swift dies
from starvation.
Here, the main example of free ranging birds reaching foraging limits is the
House Martin. Energy expenditure in free ranging adult House Martins was meas-
ured while they were feeding nestlings. Observations covered three subsequent
years in a colony of some 20 nests at a farm where food supply was monitored
continuously with a suction trap for insects at the same height as foraging House
Martins of 10–15 m.
Measuring energy expenditure with doubly labelled water required capturing
birds at two time points, initially to apply the labelled water and measure the sub-
sequent enrichment of the body water and again to measure the final enrichment.
In practice, a parent was taken from the nest at night and injected with a weighed
dose of doubly labelled water. It takes about one hour for the injected water to
equilibrate with the body water for a 20-g House Martin. Then, blood was sampled
from a leg vein for measurement of the initial isotope enrichment and the bird was
replaced in the nest. The next morning, birds started feeding nestlings as usual and
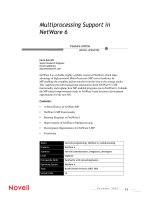
were recaptured at the end of day or the next day for the final sampling (Fig. 1.5).
Experimental birds were colour marked to observe where they were foraging and
how many meals were brought to the nest. The disturbance through capturing,
injecting water and taking blood samples is minimal. Some birds, as marked with
regular aluminium leg rings, were observed with doubly labelled in all subsequent
years.
Fig. 1.5 Protocol for the doubly labelled water method to measure energy expenditure in free
ranging House Martins during the breeding season (With permission from Bryant and Westerterp
1980). Stable isotopes are introduced by intraperitoneal injection (t
1
). The initial blood samples are
taken one hour after injection and consist of six capillary tubes, together containing about 100 µl
blood. A similar volume of blood is collected after one or two days of free-living activities (t
2
)
Foraging Limits in Free Ranging Birds
8
1 Introduction, Energy Balance in Animals
Energy expenditure of an animal like the House Martin is minimal during the
night, while quietly sitting on the nest, and reaches peak values during flights
up and down from the nest to the foraging area. The expenditure level can be
expressed by the increase with respect to the resting energy expenditure. This
figure, total energy expenditure divided by resting energy expenditure, is the
physical activity level. Total energy expenditure consists of expenditure for main-
tenance, food processing and physical activity. For animals like nestlings, there
is an additional component for growth. The activity component is the most vari-
able. Comparison between species requires a figure without dimension, or units.
As such, total expenditure in kJ/day can be divided by resting energy expenditure
in kJ/day. Resting energy expenditure of a specific animal is determined by body
size and composition, age, gender and body temperature. Dividing total energy
expenditure by resting energy expenditure adjusts for specific subject characteris-
tics. It results in a dimension less figure allowing for comparison of activity levels
between species, also species differing in size. A larger animal has higher resting
energy expenditure than a smaller animal. Total energy expenditure is higher as
well, and divided by resting energy expenditure might result in a comparable activ-
ity level to a smaller animal. Thus, the activity level of modern man was observed
to be in line with the activity level of a mammal living in the wild (Chap. 8).
The first year of the study, energy expenditure in adult House Martins that were
feeding their nestlings was 2.9 times resting energy expenditure. The two subse-
quent years, it was clearly higher with an average value of 3.9 times resting energy
expenditure. The first year, the breeding success in the colony was below average.
It was a wet summer with temperatures below average and few insects. Food avail-
ability as measured with the suction trap increased gradually during the breeding
season from May to September but was systematically nearly 50 % lower in the
first year compared to the two following years. Thus, the performance of a bird is a
function of food availability. The upper limit of energy expenditure, reached during
the maximum feeding rate, is around four times resting energy expenditure. The
activity factor of four seems to be a ceiling value (Bryant and Westerterp 1980).
Subsequent observations in nestling feeding Swallows and Sand Martins
resulted in values of 3.9 and 4.3 times resting energy expenditure, respectively
(Westerterp and Bryant 1984). It confirms the energetic ceiling is reached at an
activity factor of four. Subsequent observations in nestling feeding Starlings
resulted in activity factors ranging from 3.2 to 4.3 (Westerterp and Drent 1985).
The value of the activity factor in Starlings varied with the daily flight time.
Higher flight times, i.e. longer distances between foraging grounds and the nest,
resulted in total daily flight times of one hour to more than two hours.
Based on measurements as presented above, there seems to be an energy
ceiling in nature. Birds feeding nestlings for several weeks, reach the observed
ceiling value of four times resting energy expenditure. At higher values, body
weight cannot be maintained and thus performance goes down. The value is
derived in birds in the most active part of the year, the time they feed chicks in
the nest. The level is determined not only by food availability but also by the
capacity parents can produce to provide the food to the nestlings. The level is
9
similar to one of the most demanding endurance performances in man: the Tour
de France (Chap. 3). Another aspect is the effect of food availability. The activ-
ity factor reaches higher values in a breeding season with more food, resulting in
a higher breeding success. This phenomenon has been observed in man as well.
People reducing food intake reduce energy expenditure as well, especially through
a reduction of physical activity (Chap. 6). Finally, it is surprising a bird can reach
the performance of a Tour de France athlete without using supplements like sport
drinks.
How Rats Economize, Energy Loss in Starvation
Energy expenditure has an upper limit but also a lower limit. The lower limit is of
importance under conditions where food is not available. The question then is: can
energy expenditure be adapted to extend survival? Adaptation of energy expendi-
ture to food deprivation was studied in the laboratory rat. Energy expenditure was
measured by means of a balance technique and by measuring oxygen consumption
and carbon dioxide production (Westerterp 1977).
In the balance technique, energy expenditure is calculated from food intake,
faeces and urine production, and changes in body reserves. The calculated energy
requirement of a 300-g rat, kept in a metabolic cage at a comfortable room tem-
perature is 2 W (Joule per second). It is the energy content of the daily food con-
sumed minus the energy content of faeces and urine, as measured with bomb
calorimetry. During food deprivation, using body reserves covers energy expendi-
ture, and animals lose weight. A 300-g rat lost 100-g body weight over 11 days
without food. Energy expenditure over the last two days of the 11-day depriva-
tion interval was only 0.8 W. Here, energy expenditure was calculated from the
difference in energy content of the body of sacrificed animals after nine and
11 days food deprivation. Thus, reducing intake reduces energy expenditure. In
the extreme situation of complete food deprivation, energy expenditure went down
more than 50 %, from 2.0 to 0.8 W, allowing rats to survive twice as long without
food.
There is a classical experiment on the effect of semi-starvation in normal-weight
men with similar results, the so-called Minnesota Experiment (Keys et al. 1950).
It was initiated to determine the effects of relief feeding, necessitated by the fam-
ine in occupied areas of Europe during World War II. The subjects were volunteers
recruited from camps of conscientious objectors. They stayed in the laboratory for
a 12-week baseline period, 24-weeks of semi-starvation, and the first 12-weeks of
rehabilitation. The weight maintenance diet of 14.6 MJ/d in the baseline period was
reduced to 6.6 MJ/d during semi-starvation. In the 24 weeks of semi-starvation,
body weight went down from an average of 69 to 53 kg. At the end of the 24-week
interval, subjects reached a new energy balance as body weight levelled off at
the lower value (Fig. 1.6). Energy expenditure equalled energy intake, i.e. energy
expenditure went down from 14.6 to 6.6 MJ/d, a reduction of 55 %.
Foraging Limits in Free Ranging Birds
10
1 Introduction, Energy Balance in Animals
Mechanisms causing the adaptation of energy expenditure to food deprivation
were studied by measuring oxygen consumption and carbon dioxide production in
rats (6). The rats were housed individually in metabolic cages (Fig. 1.7). The cages
were airtight except for an inlet and outlet for ventilation and measurement of the
gas exchange. Energy expenditure is calculated minute by minute from oxygen
consumption and carbon dioxide production. In combination with measurement of
food intake and physical activity, energy expenditure can be split in three compo-
nents: resting energy expenditure, expenditure for food processing and expenditure
for physical activity. Obviously, a caged rat is not as active as a rat under free-
living conditions, but it can serve as a model. The 300-g rat with a total energy
expenditure of 2 W, as described, had a resting energy expenditure of 1.5 W,
0.2 W for food processing and the remaining 0.3 W for physical activity. Thus, the
activity factor of a caged rat is 2/1.5 = 1.33. Restricting intake or complete food
deprivation reduced all three components of total energy expenditure. In conclu-
sion, eating less reduces energy requirement through a reduction of maintenance
expenditure, expenditure for food processing and expenditure for physical activity.
Resting energy expenditure, the largest component, decreased through a low-
ering of body temperature and through behavioural changes reducing heat loss.
Longer-term energy restriction also reduces resting energy expenditure through
weight loss. The smaller body requires lower maintenance expenditure. The core
temperature of a rat, as recorded with a permanently implanted thermocouple
in the heart, is on average 38° C. The minimal value was 36.5° C, at dusk, just
before the start of the active phase of the day for a rat as a night animal. Man has
a similarly low body temperature in the early morning, just before getting up. The
core temperature rises as soon as one gets physically active and consumes food.
Fig. 1.6 Mean daily energy intake, left axis and open dots, and mean body weight, right axis
and closed dots, of 32 men during 24 weeks of semi-starvation (After Keys et al. 1970)
11
The rat’s core temperature increased from 36.5 to 39° C. A temperature that man
only reaches during endurance exercise or during fever. In the food deprivation
experiment described, the average daily core temperature of 38° C decreased
below 37° C. Reduction of heat loss was reached by curling up. Then, they lie
down on their tail and thereby decrease their heat loss. In rats, the tail, the largest
furless area of the body, mediates an important part of heat exchange.
Eating less implies less food to digest and process, like for temporary stor-
age in body reserves after a meal. An energy deficit during food deprivation is
covered by mobilizing energy from body stores. Mobilizing energy from body
stores instead of food consumed also saves on energy costs associated with food
processing like waste production as faeces and urine. Energy expenditure for
food processing is a function of the quantity of food consumed. It is a fraction
of energy intake. Energy expenditure for food processing is 10 %, for a rat on a
Fig. 1.7 The metabolic cage
How Rats Economize, Energy Loss in Starvation
12
1 Introduction, Energy Balance in Animals
diet of standard laboratory food. Thus, when intake matches expenditure, energy
expenditure for food processing is 10 % of total energy expenditure. Energy
expenditure decreases by 10 % when a rat stops eating. This is the same for man,
as described in Chap. 5.
Activity energy expenditure was calculated as total energy expenditure minus
the sum of energy expenditure for food processing and resting energy expenditure.
In the baseline situation, before food deprivation, total energy expenditure was
2 W, resting energy expenditure 1.5 W, expenditure for food processing 10 % of 2
or 0.2 W, and activity energy expenditure the remaining 0.3 W. After 11 days food
deprivation, total energy expenditure was 0.8 W, resting energy expenditure 0.7 W,
expenditure for food processing 0 W, and activity energy expenditure the remain-
ing 0.1 W. Activities performed by the rats, as monitored with a radar system,
went down by about half. Animals moved less and more slowly. The more than
50 % decrease of activity energy expenditure, from 0.3 to 0.1 W or to one third of
the initial value, is also caused by body weight loss. Weight bearing activities take
less energy when body weight has gone down.
Summarizing, energy expenditure of a 300-g laboratory rat was 2 W under
ad libitum food conditions. Food deprivation of 11 days led to a decreased
body weight of 200 g and decreased total energy expenditure to 0.8 W. Resting
energy expenditure decreased from 1.5 to 0.7 W. Expenditure for food processing
decreased from 0.2 to 0.0 W, and activity energy expenditure decreased from 0.3
to 0.1 W. Activity energy expenditure showed the largest relative change. This is in
line with the previously mentioned Minnesota Experiment in man. There, the larg-
est saving on energy expenditure could be ascribed to a decrease in activity energy
expenditure as well (Table 1.1). Subjects were not capable of doing anything more
than hanging around. The main effect of an insufficient energy intake is on physi-
cal performance.
Methodology and concepts as described for animal energetics were the starting
point for human energetics. The metabolic cage became a respiration chamber with
hotel facilities. Doubly labelled water was not injected but consumed as a drink
Table 1.1 Energy saved by 24 weeks semi-starvation in the Minnesota Experiment (Keys et al. 1950)
MJ/d % of total
Resting expenditure 2.6 32 65 % for decreased
active-tissue mass
35 % for lowered tissue
metabolism
Energy expenditure for food
processing
0.8 10
Energy expenditure for physical
activity
4.6 58 40 % for reduced body
weight
60 % for reduced physical
activity
Total 8.0 100
13
at a predetermined moment in time, at the start of an endurance performance like
the Tour de France, or before and after a period with an energy restricted diet to
lose weight. The radar system to measure physical activity in a metabolic cage was
maintained in the respiration chamber. Additionally, miniature accelerometers were
developed for the assessment of the activity pattern under daily living conditions.
With the methodology, new insights were acquired in energy balance and physical
activity in man. In the last chapter, evidence from research in animals and man is
combined under the title ‘Modern man in line with wild mammals’.
How Rats Economize, Energy Loss in Starvation
15
Abstract Energy balance in animals and man is a balance between
energy intake and energy expenditure for body functions and physical activ-
ity. Energy expenditure determines energy requirement. Energy requirement is
met by energy intake. When energy intake does not match energy requirement,
there is a misbalance, caused by intake that is either too high or too low. When
intake exceeds expenditure, there is a positive energy balance and excess energy
is stored in body reserves. When energy intake does not meet expenditure, energy
is mobilized from body reserves. Both result in a change of body weight and body
composition. This chapter firstly describes the assessment of energy expenditure
in man, based on the methodology as described for animals in the foregoing chap-
ter. Subsequent sections describe assessment of physical activity, food intake and
body composition, resulting in the assessment of energy and macronutrient bal-
ance. The methodology forms the basis for the insights as described in the follow-
ing chapters on regulation of energy balance as a function of behaviour, growth,
disease, and ageing. Energy balance can be derived from the measurement of
energy expenditure, food intake, and body composition. The indicated method
for the measurement of energy expenditure is indirect calorimetry via a venti-
lated hood, respiration chamber and with the doubly labelled water method. Food
intake is usually assessed with self-report like a dietary recall or a dietary record.
Self reported food intake has important limitations and the validity is insufficient
for research purposes. Body composition can be calculated from body weight
and body volume or total body water. At a negative or positive energy balance,
the deficit or excess energy is largely mobilised or stored as body fat. The best
long term indicator for energy balance over weeks and months is body weight and
body composition. With the present state of the art, disturbances of energy bal-
ance are better determined by measuring energy expenditure than with measuring
food intake.
Keywords Accelerometry • Body composition • Dietary record • Direct
calorimetry • Fat-free mass • Fat mass • Indirect calorimetry • Respiration
chamber • Substrate utilisation • Ventilated hood
Energy Balance
Chapter 2
K. R. Westerterp, Energy Balance in Motion, SpringerBriefs in Physiology,
DOI: 10.1007/978-3-642-34627-9_2, © The Author(s) 2013
16
2 Energy Balance
Assessment of Energy Expenditure
History
The first attempts for the measurement of energy expenditure in man were per-
formed early in the seventeenth century. Sanctorius (1614) demonstrated how a
subject loses weight while seated in a chair suspended from a balance (Fig. 2.1).
The weight loss was ascribed to insensible perspiration. In the end of the eight-
eenth century, nearly 200 years later, it was shown that he body produces energy
by oxidation of carbohydrate, protein and fat as consumed in food. Now, we con-
sider insensible perspiration as more of an indicator for water lost by evaporation
than for energy expenditure (Westerterp 2004). A calculation shows only a minor
part of weight loss is due to energy expenditure. Here, the calculation is performed
for a man with an average daily energy expenditure of 12 MJ/d, completely cov-
ered by glucose oxidation. The body produces energy from glucose by oxidation.
One glucose molecule (C
6
H
12
O
6
) is oxidised with 6 molecules oxygen (O
2
) to 6
molecules of carbon dioxide (CO
2
) and 6 molecules of water (H
2
O):
In grams, 180 g glucose (one molecule) oxidize with 192 g oxygen to produce
264 g carbon dioxide, 108 g water, and energy. Oxidizing one molecule of glucose
provides 3 MJ energy and thus, the energy expenditure of 12 MJ/d is covered by
the oxidation of four molecules glucose. The body weight change due to the dif-
ference between the weight of oxygen consumed and carbon dioxide produced is
(4 × 192) − (4 × 264) = −288 g/day. Water loss through breathing and evapora-
tion via the skin is on average one-third to two-thirds of the average daily water
turnover of 3 l/d, or 1,000–2,000 g/day depending on clothing, ambient temperature
and humidity. The calculation shows, insensible perspiration is more a measure for
water loss through evaporation than for energy expenditure.
The next development in the assessment of energy expenditure was a calo-
rimeter. A calorimeter is a device for measuring the heat given off by something,
like burning food or faeces in a bomb calorimeter. The first calorimeters for the
measurement of energy expenditure measured the heat given off from an animal.
Lavoisier (Paris, 1780) placed a guinea pig in a wire cage surrounded by chunks
of ice. As the ice melted from the animal’s body heat, the water collected below
in a container, which could be weighed. The amount of melted water allowed the
calculation of the heat production, 334 J/g. The calorimeter was adiabatic in that
the outer space, around the ice cavity surrounding the cage, was packed with snow
to maintain a constant temperature around the inner shell, which was filled with
ice. The days when these measurements could be made was limited by the mild
winters in Paris in a time ice machines were not yet invented. The first human
calorimeter was developed around 1900. Direct calorimetry, measuring energy
expenditure by measuring heat loss, is nowadays replaced by indirect calorimetry.
Living can be regarded as a combustive process. The metabolism of an organism is
C
6
H
12
O
6
+ 6O
2
→ 6 CO
2
+ 6H
2
O + energy
17
a process of energy production by the combustion of fuel in the form of carbohy-
drate, protein, fat or alcohol. In this process oxygen is consumed and carbon diox-
ide produced. Measuring energy expenditure by measuring oxygen consumption
and/or carbon dioxide production is called indirect calorimetry.
Fig. 2.1 Sanctorius (Italy, 1561–1636) started to assess energy expenditure from weight meas-
urements. For 30 years, he measured his weight; sitting on a chair suspended from a balance,
what he ate and drank, and produced faeces and urine. He observed the weight of what he ate and
drank was larger than the weight loss in faces and urine. The difference was ascribed to insensi-
ble perspiration
Assessment of Energy Expenditure
18
2 Energy Balance
Current Methods
In indirect calorimetry the energy production is calculated from chemical pro-
cesses. Knowing, for example, that the oxidation of 1 mol glucose requires 6 mol
oxygen and produces 6 mol carbon dioxide, 6 mol water and 3 MJ energy, the
energy production can then be calculated from the oxygen consumption and car-
bon dioxide production. The ratio of oxygen and carbon dioxide varies with the
nutrient oxidised (Table 2.1). Brouwer (1957) drew up a simple formula for calcu-
lating the energy production (kJ), based on the quantities of carbohydrate (C, g),
protein (P, g) and fat (F, g) oxidized, from oxygen consumption (l), carbon dioxide
production (l) and urine-nitrogen loss. The principle of the calculation consists of
three equations with the three measured variables:
Protein oxidation (g) is calculated as 6.25 x urine-nitrogen (g), and subse-
quently oxygen consumption and carbon dioxide production can be corrected for
protein oxidation to enable the calculation of carbohydrate and fat oxidation:
The general formula for the calculation of energy production (E) derived from
these gures is:
Oxygen consumption
= 0. 829 C + 0. 967 P + 2. 019 F
Carbon dioxide production
= 0. 829 C + 0. 885 P + 1. 427 F
Energy production = 17. 5 C + 18. 1 P + 39. 6 F
C =−2. 97 oxygen consumption + 4. 17 carbon dioxide production − 0. 39 P
F
=
1. 72 oxygen consumption
−
1. 72 carbon dioxide production
−
0. 32 P
E
= 16. 20 oxygen consumption + 5. 00 carbon dioxide production − 0. 95 P
Table 2.1 Gaseous exchange and energy production of metabolised nutrients (A) and resulting
energy equivalents of oxygen and carbon dioxide (B) (After Brouwer 1957)
A
Nutrient Oxygen consumption
(l/g)
Carbon dioxide production
(l/g)
Energy production
(kJ/g)
Carbohydrate 0.829 0.829 17.5
Protein 0.967 0.775 18.1
Fat 2.019 1.427 39.6
B
Nutrient Oxygen
(kJ/l)
Carbon dioxide
(kJ/l)
Carbohydrate 21.1 21.1
Protein 18.7 23.4
Fat 19.6 27.8