Cognitive and Physiologic Correlates of Subclinical Structural Brain Disease in Elderly Healthy Control Subjects docx
Bạn đang xem bản rút gọn của tài liệu. Xem và tải ngay bản đầy đủ của tài liệu tại đây (653.29 KB, 9 trang )
Cognitive and Physiologic Correlates
of Subclinical Structural Brain Disease
in Elderly Healthy Control Subjects
Ian A. Cook, MD; Andrew F. Leuchter, MD; Melinda L. Morgan, PhD; Elise Witte Conlee, PhD; Steven David;
Robert Lufkin, MD; Ashkan Babaie, MD; Jennifer J. Dunkin, PhD; Ruth O’Hara, PhD; Sara Simon, PhD;
Amy Lightner, MD; Susan Thomas, MD; David Broumandi, MD; Neeraj Badjatia, MD; Laura Mickes;
Rajal K. Mody, MD; Sanjaya Arora, MD; Zimu Zheng, MD; Michelle Abrams, RN; Susan Rosenberg-Thompson, MSN
Context: Healthy elderly persons commonly show 4 types
of change in brain structure—cortical atrophy, central
atrophy, deep white-matter hyperintensities, and peri-
ventricular hyperintensities—as forms of subclinical struc-
tural brain disease (SSBD).
Objectives: To characterize the volumes of SSBD pres-
ent with aging and to determine the associations of SSBD,
physiology, and cognitive function.
Design: Cross-sectional study.
Setting: University of California, Los Angeles, Neuro-
psychiatric Institute.
Subjects: Forty-three community-dwelling healthy
control subjects, aged 60 through 93 years.
Main Outcome Measures: Volumetric magnetic reso-
nance imaging, neuropsychological testing, and quanti-
tative electroencephalographic coherence (functional
connectivity) between brain regions.
Results: Regression models demonstrated significant
relationships between SSBD volumes, age, cognitive per-
formance, and connectivity. Cortical and central atro-
phy and periventricular hyperintensities had significant
associations with age while deep white-matter hyperin-
tensities did not. Posterior atrophy showed stronger as-
sociations with age than did anterior atrophy. Only a sub-
set of subjects at older ages showed large SSBD volumes;
older subjects primarily showed increasing variance of
SSBD. Although all subjects scored within the normal
range on cognitive testing, SSBD volume was inversely
related to performance, most notably on the Trail-
Making Test part B and the Shipley-Hartford Abstract Rea-
soning test. Coherence had significant associations with
SSBD. Path analysis supported mediation of the effects
of deep white-matter hyperintensities and periventricu-
lar hyperintensities on cognition by altered connectiv-
ity. For several measures, cognitive performance was best
explained by coherence, and only secondarily by SSBD.
Conclusions: Modest volumes of SSBD were associ-
ated with decrements in cognitive performance within
the normal range in healthy subjects. Lower coherence
was associated with greater volumes of SSBD and in-
creasing age. Path analysis models suggest that brain func-
tional connectivity mediates some effects of SSBD on cog-
nition.
Arch Neurol. 2002;59:1612-1620
S
TRUCTURAL CHANGES of the
brain are widely thought to
be an inherent part of aging,
with significant atrophy and
white matter changes re-
ported in 30% to 100% of the healthy el-
derly population.
1,2
These changes seem to
be related not only to age, but also to physi-
cal illnesses (eg, hypertension, diabetes
mellitus
3,4
). They reach their highest preva-
lence in patients who have dementia,
5
de-
pression,
6
and other neuropsychiatric dis-
orders.
7
Nevertheless, these structural
features are not invariably associated with
illness and are considered by some to be fea-
tures of normal aging.
1,8
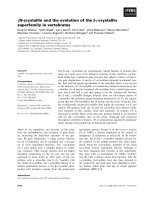
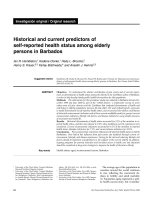
Specific changes have been identi-
fied on magnetic resonance imaging (MRI)
scans: cortical atrophy, ventricular en-
largement, deep white-matter hyperinten-
sities (DWMHs) in subcortical white mat-
ter, and periventricular hyperintensities
(PVHs) (
Figure 1). The effect of these
structural changes on cognitive or func-
tional abilities is unclear. All 4 can be sub-
sumed under the rubric of “subclinical
structural brain disease” (SSBD) as a short-
hand to review a broad literature and de-
velop a paradigm for examining struc-
tural changes in the aging brain.
General associations between SSBD
and impairment have been reported, with
large volumes of atrophy and white mat-
ter lesions found in elderly subjects who re-
port subjective cognitive impairments,
9,10
impaired mobility,
11
and mood disor-
ORIGINAL CONTRIBUTION
From the University of
California, Los Angeles,
Neuropsychiatric Institute and
the University of California,
Los Angeles, School of
Medicine.
(REPRINTED) ARCH NEUROL / VOL 59, OCT 2002 WWW.ARCHNEUROL.COM
1612
©2002 American Medical Association. All rights reserved.
at Penn State Milton S Hershey Med Ctr, on April 14, 2008 www.archneurol.comDownloaded from
ders.
12,13
The converse association between structural
changes and poorer cognitive function has also been re-
ported.
4,14-17
Nevertheless, there is not good agreement on
the functional consequences of structural disease, since
others have reported little or no association.
18-20
Some of these inconsistencies likely reflect limita-
tions of the measurement techniques. Few studies have
used precise methods to quantitate disease, though vol-
ume of damage is likely to be important.
21
Instead they have
used semiquantitative rating scales
3,5,10,22,23
that yield non-
volumetric values and limit accuracy and reliability. Sub-
jective judgments for “thresholds” of disease on multiple
point scales (ie, 0-3, 9, or even 24 points)
23
pose prob-
lems of systematizing what differentiates, for example, a
1froma2rating.Accuracymaybelimitedbysystematic
overrating or underrating of pathologic abnormality, be-
cause raters must determine what constitutes sufficient
change to be rated greater than 0; one study
22
explicitly
excluded some types of PVHs as a “normal variant. ” Ad-
ditionally, attention is not uniform in evaluating all types
of SSBD, such as differentiating DWMHs from PVHs,
24
lead-
ing to inconsistent conclusions.
5,10,14,25,26
Regional differ-
ences have received variable attention: studies of global
atrophy
4
have reached different conclusions from inves-
tigations that considered regions separately.
27,28
AmechanismthatmaylinkSSBDtocognitiveeffects
is disruption in the connectivity between brain regions.
7
Quantitative electroencephalographic (QEEG) coherence
can assess connections between regions
29
and permit test-
ing of this possible mechanism. Our past work linked white
matter lesions with decreased coherence in both healthy
subjects and and subjects with dementia.
30,31
A B
C D
Figure 1. Examples of the 4 types of subclinical structural brain disease are shown with representative magnetic resonance images. Arrows indicate the areas of
each structural change: A, cortical atrophy (increased sulcal cerebrospinal fluid); B, central atrophy (ventricular enlargement); C, deep white-matter
hyperintensities; and D, periventricular hyperintensities. White spots around the scalp are fiducial markers placed at the sites of the electroencephalographic
electrodes.
(REPRINTED) ARCH NEUROL / VOL 59, OCT 2002 WWW.ARCHNEUROL.COM
1613
©2002 American Medical Association. All rights reserved.
at Penn State Milton S Hershey Med Ctr, on April 14, 2008 www.archneurol.comDownloaded from
In this project, we combined volumetric MRI mea-
surements in healthy elderly subjects with neuropsycho-
logical assessments and coherence values to clarify the
cognitive correlates of SSBD and to investigate a poten-
tial mechanism for these relationships.
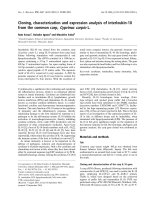
Figure 2 shows
a path analysis model for evaluating whether SSBD’s ef-
fects on cognition arise from disruption in connectivity.
Building on Inzitari’spropositions,
7
we hypothesized that
increasing age would be associated with larger volumes of
SSBD (arrow a), and that poorer cognitive performance
would be associated with both larger SSBD volumes (ar-
row b)andlowercoherence(arrowc). We further hypoth-
esized that larger SSBD volumes would be associated with
greater disruption in connectivity (arrow d)asgreaterdam-
age would be expected to produce greater impairment in
neuronal signal transmission. Finally, we used this path
analysis model to test the hypothesis that connectivity me-
diates the effects of SSBD on cognitive function.
SUBJECTS AND METHODS
SUBJECTS
We recruited 43 subjects from the community. All were at least
60 years old, were in good health, and had normal findings on
neurological examination. Exclusion criteria included any his-
tory of an axis I psychiatric disorder; any poorly controlled medi-
cal illness that could affect brain function (eg, untreated hypo-
thyroidism); current use of medications that could alter
electroencephalographic activity (eg, benzodiazepines); current
or past drug or alcohol abuse; and a history of head trauma, brain
surgery, skull defect, stroke, or transient ischemic attacks. This
study was approved by the University of California, Los Angeles,
institutional review board; informed consent was obtained from
all subjects. Demographic characteristics are given in
Table 1,
including age, sex, educational level, and health status (Cumu-
lative Illiness Rating Scale–Geriatrics).
32
Subclinical structural brain
disease measures were available from all 43 subjects. Because some
subjects did not have usable QEEG recordings (eye-movement
and/or muscle-tension artifacts), or declined to complete all cog-
nitive tests, subsets of subjects (ranging from 28 to 43 subjects)
were used for the analyses involving QEEG data and cognitive
scores; sample sizes are indicated for each analysis (
Tables 2,
3,and4). Subjects with QEEG data were not statistically differ-
Age SSBD
Connectivity
Cognition
a
b
d
c
Figure 2. Path analysis allows testing of the hypothesized relationships
between subclinical structural brain disease (SSBD), connectivity, and
cognition. Arrows represent correlations among increasing age and
increasing volume of SSBD (a), increasing volumes of SSBD and poor
cognitive performance (b), reduced connectivity and cognitive impairment
(c), and increasing disconnection with increasing SSBD volume (d ).
Table 1. Demographic and Clinical Features
for 43 Healthy Elderly Subjects*
Variable Values
Age, y 75.2 (6.9)
Sex, F/M 24/19
Ethnicity/race, W/B 42/1
Educational level, y 15.6 (2.4)
Health status (Cumulative Illness
Rating Scale−Geriatrics) score
32
4.0 (2.8)
Folstein Mini-Mental State Examination score
33
29.0 (1.2)
Hamilton Depression Rating Scale score
34,35
4.9 (4.9)
Hachinski scale for risk of ischemic
dementia score
36
0.58 (0.82)†
*Data are given as mean (SD) unless otherwise stated.
†Hachinski scores were skewed: median equals 0; interquartile range, 0-1.
Table 2. Relationship of SSBD and Cognitive Function*
SSBD Measure
Trails A Test
(n = 35)
Trails B Test
(n = 35)
BNT
(n = 36)
FAS Test
(n = 36)
SHAR Test
(n = 36)
DWMH
Total region −0.044 0.297† −0.285† −0.154 −0.214
Anterior region −0.011 0.332† −0.299† −0.170 −0.265
Posterior region −0.078 0.215 −0.231 −0.110 −0.112
PVH
Total region 0.039 0.328† −0.158 −0.156 −0.329†
Anterior region −0.020 0.367† −0.189 −0.204 −0.416‡
Posterior region 0.067 0.303† −0.146 −0.179 −0.297†
sCSF
Total region 0.207 0.506‡ −0.137 −0.004 −0.323†
Anterior region 0.198 0.406‡ −0.071 0.077 −0.284†
Posterior region 0.203 0.547‡ −0.173 −0.057 −0.330†
vCSF
Total region 0.243 0.410‡ −0.035 −0.047 −0.222
Anterior region 0.246 0.415‡ −0.062 −0.011 −0.283†
Posterior region 0.229 0.384† −0.021 −0.060 −0.185
*SBBD indicates subclinical structural brain disease; Trails A, Trail Making Test
48-50
to measure attention and speed; Trails B, Trail Making Test to measure
sequencing abilities; BNT, Boston Naming Test
53
; FAS, controlled word association
51
; SHAR, Shipley-Hartford Abstract Reasoning test
52
; DWMH, deep white-matter
hyperintensities; PVH, periventricular hyperintensities; sCSF, sulcal cerebrospinal fluid; and vCSF, ventricular CSF. Pearson correlation values are shown for the
relationships between changes in volumes and performance on cognitive tests. Regarding the correlation signs, higher scores on the BNT and SHAR test indicate
better performance, whereas higher scores on Trails A and B indicate poorer performance; correlations are in the predicted directions (greater SSBD volume is
associated with poorer performance).
†PϽ.05.
‡PϽ.01.
(REPRINTED) ARCH NEUROL / VOL 59, OCT 2002 WWW.ARCHNEUROL.COM
1614
©2002 American Medical Association. All rights reserved.
at Penn State Milton S Hershey Med Ctr, on April 14, 2008 www.archneurol.comDownloaded from
ent on any demographic factor or clinical rating from those with-
out QEEG data. All subjects were right-handed except for one
left-handed woman.
MRI METHODS
Brains were imaged using a 1.5-T scanner (Signa; GE Medical
Systems, Milwaukee, Wis). Parameters included a 256ϫ256
window, 3-mm slices, no interslice space, and a double–echo-
pulse sequence with the following: echo time, 3000 millisec-
onds; repetition time, 16 milliseconds; and echo time, 3000 mil-
liseconds; repetition time, 80 milliseconds. Data were processed
with standard segmentation protocols, using the MRX soft-
ware package.
37
This software has shown sensitivity and reli-
ability for detecting age-related changes.
38,39
Segmentation of brain, ventricular spaces, and lesions was
performed in 4 steps, by operators blinded to clinical and QEEG
data. First, an outline (mask) of the cerebral hemispheres was cre-
ated for each scan plane, to delineate brain parenchyma from other
structures and to eliminate the latter from further examination.
Second, the operator selected sample points of each specific tis-
sue and fluid type: sulcal cerebrospinal fluid (sCSF), normal cor-
tical and subcortical gray matter, normal white matter, DWMHs,
PVHs, and ventricular fluid (vCSF). The computer then classi-
fied all volume elements (voxels) according to these sample points
via the signal intensity in both echo sequences.
Third, these automated tissue segmentations were
reviewed for accuracy and misclassifications were corrected.
The operator searched for misclassifications from partial vol-
ume effects at the boundary between segments (eg, brain and
CSF). Finally, voxels for each tissue were summed and con-
verted to milliliter values. Data were evaluated for the whole
brain and for anterior and posterior regions separately. These
were divided by a vertical plane bisecting the line between the
genu and splenium of the corpus callosum, drawn where that
distance was smallest.
The use of the MRX software package has been investigated
by Sandor and colleagues,
40
and Guttmann et al,
41
who reported
high interrater reliability using manually drawn regions and good
reproducibility of data from multiple scans on the same sub-
jects. We have verified the reproducibility in our laboratory with
values comparable to those reported by Guttmann et al.
11
EEG METHODS
Recordings were performed while subjects rested in the eye-
closed, maximally alert state, as previously detailed.
2,31
Subjects
were alerted by the technicians at the emergence of any sign of
drowsiness. A parietal electrode (Pz)–referential montage was
used with electrodes placed according to the 10-20 system.
42
Sig-
nals were digitally recorded (bandpass width, 0.3-70 Hz) and ana-
lyzed with the QND system (Neurodata Inc, Pasadena, Calif).
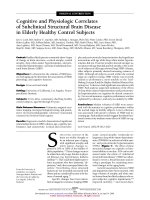
This system allowed for off-line reformatting to bipolar chan-
nels for coherence calculations (
Figure 3).
2,31
The first 20 to
32 seconds of artifact-free data were selected for processing by a
technician, with selections confirmed by a second technician (both
blinded to subject identity). Data were analyzed with a sample
rate of 256 samples per second per channel with a fast Fourier
transform (1024 points) to calculate values for coherence in 4-Hz
A B
Figure 3. Coherence was computed to detect alterations in functional
connectivity between regions connected by known neuroanatomical
pathways. Corticosubcortical connectivity was assessed in prerolandic (A)
and postrolandic (B) networks (modified from Leuchter et al
2
). Left
hemisphere pathways are shown here; measures were calculated separately
from both hemispheres. Dots indicate electrodes; arrows, pathways; and
gray areas, electrode pairs at the ends of the pathways.
Table 3. Regression Models of SSBD
and Age as Predictors of Cognition*
Model Predictors r
2
F P Values
Trails B Test
5 Age, DWMH, vCSF, sCSF, and PVH 0.453 4.80 .003
4 Age, DWMH, vCSF, and sCSF 0.450 6.13 .001
3 Age, DWMH, and sCSF 0.435 8.00 Ͻ.001
2 Age and sCSF 0.399 10.60 Ͻ.001
1 Age 0.329 16.15 Ͻ.0005
SHAR Test
5 Age, DWMH, vCSF, sCSF, and PVH 0.355 3.30 .017
4 Age, DWMH, vCSF, and sCSF 0.351 4.19 .008
3 Age, DWMH, and vCSF 0.344 5.60 .003
2 Age and DWMH 0.337 8.39 .001
1 Age 0.320 16.02 Ͻ.001
*SSBD indicates subclinical structural brain disease; Trails B, Trail-Making
Test
48-50
to measure sequencing abilities; DWMH, deep white-matter
hyperintensities; vCSF, ventricular cerebrospinal fluid; sCSF, sulcal CSF; PVH,
periventricular hyperintensities; and SHAR, Shipley-Hartford Abstract
Reasoning test.
48
Five regression models were used to evaluate the relative
contributions of age and SSBD measures in predicting cognitive
performance on the Trails B (n = 35) and SHAR tests (␣ = .05 for entry,
␣ = .10 for removal). Age is a significant predictor for both cognitive
measures. Additional variance is explained by including SSBD terms in the
model where r
2
values increase. Sulcal CSF enters next in predicting Trails B,
followed by DWMH; in contrast, DWMH enters next for predicting SHAR,
followed by vCSF.
Table 4. Correlations of Coherence
with SSBD and Cognition*
Measure Prerolandic Area Postrolandic Area
PVH 12 (R)‡ 12 (R),† 16§
DWMH 12 (R)† 16†
sCSF . . . 16 (L)†
vCSF 12 (L)† 12†
Trails A 8 (L)‡ 8 (R)†
Trails B 12†
8 (R)†
16 (L)‡
12 (L)†
8*
BNT 8 (R)†
FAS test 12 (L)†
16 (L)†
SHAR test . . . 16 (L)‡
*SSBD indicates subclinical structural brain disease; PVH, periventricular
hyperintensities; DWMH, deep white-matter hyperintensities; sCSF, sulcal
cerebrospinal fluid; vCSF, ventricular CSF; Trails A, Trail-Making Test
48-50
to
measure attention and speed; Trails B, Trail-Making Test
48-50
to measure
sequencing abilities; BNT, Boston Naming Test
53
; FAS test, controlled word
association
51
; SHAR, Shipley-Hartford Abstract Reasoning test
52
; and
ellipses, not applicable. Subclinical structural brain disease measures
showed significant correlations with connectivity in the corticosubcortical
coherence measures (prerolandic and postrolandic) (n = 33). Cognitive
performance measures also showed significant correlations with connectivity
in the coherence measures (n = 28 for all tests except FAS test [n = 29]).
Numbers indicate the center frequency of each band (ie, 8 Hz = 6-10 Hz; 12
Hz = 10-14 Hz; and 16 Hz = 14-18 Hz); unilaterality in the finding, if present,
is denoted by “R” and “L.”
†PϽ.05.
‡PϽ.01.
§PϽ.005.
(REPRINTED) ARCH NEUROL / VOL 59, OCT 2002 WWW.ARCHNEUROL.COM
1615
©2002 American Medical Association. All rights reserved.
at Penn State Milton S Hershey Med Ctr, on April 14, 2008 www.archneurol.comDownloaded from
wide bands previously examined (6-10 Hz, 10-14 Hz, and 14-18
Hz).
2,31,43
COHERENCE
Coherence measures the similarity between signals at differ-
ent locations, and is analogous to the square of a correlation
coefficient between 2 EEG channels.
29
High values (near 1) in-
dicate much shared activity between the 2 channels, while low
values (near 0) indicate little shared activity. Computation-
ally, coherence is a function of the power spectra for 2 chan-
nels, x and y, at any given frequency f:
C
x,y
(f) =
|S
xy
(f )|
2
S
x
(f )*S
y
(f )
or the square of the cross-spectrum of the 2 channels divided
by the product of the spectra of the individual channels.
Thatcher et al
44
measured the information transmitted
through corticocortical fibers by averaging coherence values
among recording sites overlying their distribution. By combin-
ing coherence values from bipolar channels overlying known
structures,
2
this measure can assess functional connectivity in
these areas of interest. We previously used this approach to study
disruption of connectivity in complex networks of corticocor-
tical and corticosubcortical fibers (eg, prerolandic, frontal cor-
tex [Figure 3A]) and the projections of the visual and associa-
tion cortex in the postrolandic area (Figure 3B)
2
;subjectswith
vascular dementia showed reductions in coherence in these net-
works. In the present study, we measured coherence in the pre-
rolandic and postrolandic regions. As in our previous work,
2
val-
ues were multiplied by 10 and log-transformed to minimize skew
and kurtosis. We limited our examination to frequencies above
6Hz,becausethesebandshaveshownaconsistentassociation
between decreased coherence and impaired cognition.
2
COGNITIVE MEASURES
We assessed cognition with measures previously shown to be sen-
sitive to structural changes. Boone et al
21,45
found that frontal mea-
sures are particularly sensitive to significant white matter dis-
ease. The work of Heaton and colleagues
46,47
with patients who
have multiple sclerosis suggests that measures of attention, inci-
dental memory, and psychomotor function are also useful. Con-
sequently, we used the Trail-Making Tests
48-50
to measure atten-
tion and processing speed (Trails A) and sequencing abilities (Trails
B). We used the Controlled Oral Word Association Test ( FAS test,
named for its stimuli)
51
to measure verbal fluency and semantic
memory retrieval. The Shipley-Hartford Abstract Reasoning test
52
was used to assess complex abstracting ability. The Boston Nam-
ing Test
53
was used as a measure of confrontational naming.
STATISTICAL METHODS
Statistical analyses were performed using SPSS Analytic Soft-
ware, Version 10.1 (SPSS Inc, Chicago, Ill). Continuous out-
come data were analyzed with linear regression models and ttests.
Differences in SSBD variance between age groups were exam-
ined with the Levene test for equality of variance. The test of par-
allelism was used to evaluate the homogeneity of regression slopes.
Path analysis
54
was used to test whether the effects of SSBD on
cognition were mediated by coherence. Regression equations from
the hypothesized path model were used to test whether (1) the
independent variable (SSBD) affected the mediator variable (con-
nectivity), (2) the independent variable affected the dependent
variable (cognition), and (3) the mediator variable (connectiv-
ity) affected the outcome variable. If all 3 conditions were met,
and the path coefficient of the independent variable to the de-
pendent variable was smaller than the path coefficient of the me-
diator to the dependent variable when cognition was regressed
on both connectivity and SSBD, one could conclude that the hy-
pothesized mediation was present.
55
RESULTS
EFFECTS OF AGE ON VOLUMES
OF STRUCTURAL CHANGE
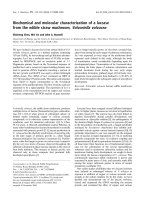
Significant linear relationships were found between age
and central atrophy (r
41
=0.47, P=.001), cortical atro-
phy (r
41
=0.46, P=.002), and PVHs (r
41
=0.47, P=.002),
but not with DWMHs (r
41
=0.22, P=.15) (Figure 4)
(n=43). Scatterplots revealed that, collectively, the older
individuals had more SSBD than the younger subjects,
but larger volumes were not inevitable: many subjects
older than 75 years exhibited small volumes that were
comparable to those in adults younger than 75 years. A
primary finding was the increased variability in SSBD vol-
umes for those older than 75 years, with a subgroup of
subjects showing much greater volumes than those seen
in the 60- to 75-year-old age group. Using the Levene test,
this increase in variance was significant for DWMHs
(F
41
=9.17, P=.004) and PVHs (F
41
=4.93, P=.03) but not
for vCSF (F
41
=3.67, P=.14) or sCSF (F
41
=0.02, P=.89).
Because DWMH was not associated with age, its re-
lationship with other factors was examined. Deep white-
matter hyperintensity volume was significantly corre-
lated with health state (CIRS-G, r
41
=0.34, P=.01) andtotal
PVH volume (r
41
=0.49, PϽ.001). Deep white-matter hy-
perintensity volume was not correlated with Hachinski
scores in our subject pool, though this may reflect the
limited range for the latter scale in these subjects.
To evaluate regional differences, we regressed age
against SBBD volumes separately for the anterior and pos-
terior regions. Different relationships were found for the
atrophy measures but not for the white matter changes
(lines in Figure 4). Regression slopes were significantly
different for anterior vs posterior sCSF and vCSF, with
age-related atrophy seen more prominently in the pos-
terior regions. In contrast, the slopes for DWMHs and
PVHs were not significantly different for the anterior and
posterior regions. The same process was used to evalu-
ate lateral differences and age; no differences were found
between the right and left hemispheres.
EFFECT OF SSBD ON COGNITIVE FUNCTION
Whole-brain SSBD volumes showed significant relation-
ships with cognitive performance; larger SSBD volumes were
associated with poorer performance, seen most strongly with
Trails B performance (Table 2). A regional analysis (Table
2) revealed more similarities than differences between the
anterior and posterior regions. For example, Trails B per-
formance was significantly correlated with both anterior
and posterior measures of PVHs, sCSF, and vCSF but was
associated only with anterior DWMHs.
JOINT RELATIONSHIP OF SSBD AND AGE
WITH COGNITIVE PERFORMANCE
Regression models incorporated age and SSBD variables
to predict cognitive function (Table 3). After age entered
(REPRINTED) ARCH NEUROL / VOL 59, OCT 2002 WWW.ARCHNEUROL.COM
1616
©2002 American Medical Association. All rights reserved.
at Penn State Milton S Hershey Med Ctr, on April 14, 2008 www.archneurol.comDownloaded from
the model, sCSF was the most important structural vari-
able in accounting for the variance in Trails B perfor-
mance, followed by DWMHs. In contrast, after age had en-
tered the model, DWMH was the best structural variable
for predicting performance on abstract reasoning (Shipley-
Hartford Abstract Reasoning test), followed by vCSF. While
age clearly was important, the structural measures further
explained the variance in performance.
RELATIONSHIP OF SSBD AND FUNCTIONAL
CONNECTIVITY, AND OF CONNECTIVITY
WITH COGNITION
Increasing PVH volumes were associated with signifi-
cantly lower values of coherence in prerolandic and post-
rolandic regions, as was the case for DWMHs and vCSF
(Table 4). In contrast, the only significant association for
sCSF was with postrolandic coherence, the region with
the greatest volumes of sCSF.
All cognitive measures showed associations with co-
herence, but with differing patterns of association (Table
4). For example, Trails A performance showed signifi-
cant associations with coherence in both prerolandic and
postrolandic regions, while Trails B showed a pattern of
multiple significant relationships with connectivity in the
both areas.
PATH ANALYSIS MODEL OF RELATIONSHIPS
BETWEEN SSBD, CONNECTIVITY,
AND COGNITION
To link these observations, we used a path analysis model
to test whether the effects of SSBD on cognition are me-
diated through disrupted connectivity. To build this
100
60
80
40
20
0
vCSF Volume, mL
300
100
200
0
sCSF Volume, mL
3.0
2.0
2.5
1.5
1.0
0.5
0.0
–0.5
50 60 70 80 90 100
Age, y
DWMH Volume, mL
40
20
10
0
30
–10
50 60 70 80 90 100
Age, y
PVH Volume, mL
Figure 4. Relationship among ventricular cerebrospinal fluid volume (vCSF) (A), sulcal CSF volume (sCSF) (B), deep white-matter hyperintensity (DWMH) volume
(C), and periventricular hyperintensity (PVH) and age for the 43 healthy control subjects. Volumes show a significant increase with age for vCSF, sCSF, and PVH.
There is a significant increase in variability of volumes for those older than 70 years, most clearly seen with sCSF. Volumes and regression lines are indicated
separately for anterior (solid squares, solid lines) and posterior regions (open circles, dashed lines), and are significant for sCSF (F
1,41
=6.27, P=.02) and vCSF
(F
1,41
=4.89, P=.03).
(REPRINTED) ARCH NEUROL / VOL 59, OCT 2002 WWW.ARCHNEUROL.COM
1617
©2002 American Medical Association. All rights reserved.
at Penn State Milton S Hershey Med Ctr, on April 14, 2008 www.archneurol.comDownloaded from
model, we constructed a total white-matter disease vari-
able by summing PVH and DWMH measures, and a total
atrophy variable by summing sCSF and vCSF. In paral-
lel, a total brain connectivity measure was constructed
by averaging coherence values in all bands and regions.
We examined bivariate statistics to determine which de-
mographic variables were associated with our most sen-
sitive cognitive outcome variable (Trails B) and should
be included as confounders; age was significantly corre-
lated with our cognitive measure (r
27
=0.538, P=.002),
but none of the other parameters showed a significant
association. The central focus of this model is the po-
tential mechanism relating structural changes to cogni-
tive performance; consequently, age was placed in the
model as exerting a physical influence through SSBD vol-
umes. Paths and statistical values are shown in
Figure 5.
The relationships in this model support the hypothesis
that altered connectivity does mediate the effects of white-
matter disease on cognition.
COMMENT
Our findings indicate a series of relationships between
structural changes, age, cognition, and connectivity. First,
while volume of some types of SSBD was strongly asso-
ciated with increasing age, this association was not seen
uniformly across types of change or brain region. Fur-
thermore, variance in the volumes of SSBD increased with
age, with only a subset of the oldest-old subjects show-
ing volumes of change significantly greater than the
younger-old age group. Second, there were detectable ef-
fects of most types of SSBD on cognition, even though
these healthy subjects had modest volumes of SSBD and
cognitive function in the normal range. Third, SSBD also
affected functional connectivity, with significant corre-
lations with coherence. Fourth, our path analysis mod-
els support the conclusion that effects of white-matter
SSBD on cognitive function are mediated through im-
pairment of functional connections, and support this me-
diation role at the trend level for atrophy.
The strongest relationships between SSBD and age
were seen for central and cortical atrophy and PVHs. There
was a regional difference for atrophy, with greater promi-
nence over the posterior brain regions, both cortically and
centrally; in contrast, white-matter changes did not show
a regional difference. These findings are consistent with
prior reports of atrophy and aging in healthy sub-
jects,
56,57
but extend them with the finding of regional dif-
ferences. The regional prominence of posterior atrophy
with age in healthy subjects is, to our knowledge, a new
finding and is particularly intriguing given that Alzhei-
mer disease is commonly associated with atrophy and hy-
pometabolism in posterior regions.
58-61
The increased variability of SSBD in our older sub-
jects is compatible with prior reports from Jernigan et
al
62,63
and Goldstein et al.
64
A clinical implication is that
increasing volumes of structural change with aging are
not inevitable; some of our most aged subjects showed
small amounts of SSBD. Of note, deep white-matter hy-
perintensity volume was not significantly related to age
but was related to health status. The differing patterns
of association for PVHs and DWMHs suggest that these
white matter changes may be pathophysiologically re-
lated but are not identical.
Our findings suggest that SSBD is associated with
decrements in cognitive performance even in a healthy
elderly control population, seen most strongly with the
Trails B task. Trail-Making Tests are thought to reflect
executive function
65,66
and Boone et al
21
reported on the
sensitivity of executive tasks to white-matter disease
throughout the brain. Trail-making performance has pre-
viously been reported to be affected by age in healthy
adults
67
and by deterioration in the integrity of white-
matter tracts,
17
but without the volumetric data needed
to test whether SSBD might be mediating the effect of age.
Our data do suggest a mediating role for SSBD on the dec-
rement in performance with aging. Our subjects had a
high average level of education; while this may be a limi-
tation for generalizing, it suggests that even subjects with
presumably high brain reserve
68,69
show detectable changes
in cognition from SSBD as they age.
Volumes of SSBD showed influences on coherence,
consistent with our previous reports in other popula-
tions,
30,31
and with the intrahemispheric coherence find-
ings of Koyama et al
70
and of Duffy et al
71
using inter-
hemispheric coherence. While Geschwind and Kaplan
72
and Geschwind
73
advanced the idea that a process of “dis-
connexion” underlay the deficits in their clinical popu-
lations, our data suggest that changes in connectivity may
occur during asymptomatic aging. This is also sup-
ported by recent observations by O’Sullivan et al
17
using
diffusion tensor imaging. Our findings support a patho-
physiological model in which the effects of SSBD pro-
duce disturbances in information processing.
Coherence was significantly related to cognitive per-
formance, with intriguing differences among the tests for
patterns of connectivity. The Trails B task depends on
numerous processing steps, and showed multiple asso-
ciations with connectivity variables, while the related but
simpler Trails A task showed fewer associations, sug-
gesting that the performance of the Trails B test may de-
mand more complex integrative processing. A limita-
tion of our study is that these were resting-state EEGs:
task-activated QEEG recordings might reveal addi-
tional relationships.
Age Total WMD
Total COH
Trails B
a
P
=
.002
b
P
=
.022
d
P
=
.048
c
P
=
.005
A
Age Total Atrophy
Total COH
Trails B
a
P
=
.004
b
P
=
0.044
d
P
=
.075
c
P
=
.014
B
Figure 5. The mediation hypothesis was examined using path analysis. A,
The results for total white-matter disease burden (total WMD) support a
mediation role for disturbances in connectivity (total COH or coherence) in
WMD’s effects on cognition (Trails B). Path a indicates the standardized path
coefficient  =.51, P=.002; b, =.45, P=.02; c,  =.34, P=.005; and d,
=.30, P=.048. B, This mediation is not supported for the effects of atrophy
(total atrophy) on cognition (total COH). Path a indicates  =.45, P=.004; b,
=.31, P=.044; c,  =.41, P=.01; and d,  =.26, P=.08.
(REPRINTED) ARCH NEUROL / VOL 59, OCT 2002 WWW.ARCHNEUROL.COM
1618
©2002 American Medical Association. All rights reserved.
at Penn State Milton S Hershey Med Ctr, on April 14, 2008 www.archneurol.comDownloaded from
The relationships between structural damage, co-
herence, and cognition in the path analysis model
support our hypothesis that the effects of SSBD on cog-
nition are mediated by disruptions in neuronal connec-
tivity. To our knowledge, this is the first demonstration
of a mechanism that integrates structural and func-
tional connectivity data to explain the cognitive conse-
quences of subtle structural damage in normal aging. The
relationship between structural damage and disconnec-
tion is more clearly established for disturbances in white-
matter structures
31,32
than for those involving gray mat-
ter, so these findings are consistent with prior
observations. These findings are also largely consistent
with previous work in dementia subjects.
31,32
In this group of healthy elderly subjects, even small
amounts of SSBD were seen to produce detectable changes
in QEEG measures and decrements in cognitive perfor-
mance. For some forms of SSBD, the adverse effect on
cognition seems to be mediated via disruption in con-
nectivity between brain regions, though other factors are
also important. We conclude that these mild degrees of
structural change can no longer be presumed to be in-
consequential for cognitive function.
Accepted for publication January 25, 2002.
Author contributions: Study conceptand design (Drs
Cook, Leuchter, Dunkin, and O ’Hara); acquisition of data
(Drs Cook,Witte Conlee,Lufkin, Babaie,Simon, Lightner,
Badjatia, Mody, and Arora, Mr David, and Mss Mickes,
Abrams, and Rosenberg-Thompson); analysis andinterpre-
tation of data (Drs Cook, Leuchter, Morgan,Witte Conlee,
Thomas, Broumandi, Arora, and Zheng,and Mr David); draft-
ing of the manuscript (Drs Cook, Leuchter, Witte Conlee,
Babaie, Simon, Broumandi, Badjatia, Mody, and Arora, Mr
David, and Mss Mickes, Abrams, and Rosenberg-Thomp-
son); critical revision of the manuscript for important intel-
lectual content (Drs Cook, Leuchter,Morgan, Lufkin, Dunkin,
O’Hara, Lightner, Thomas, and Zheng); statistical expertise
(Drs Cook, Morgan, and Witte Conlee); obtained funding
(Drs Cook and Leuchter); administrative,technical, and ma-
terial support(Drs Cook, Leuchter, Babaie, O’Hara, Simon,
Thomas, Broumandi,Mody, and Arora, Mr David, and Mss
Mickes, Abrams, and Rosenberg-Thompson); study super-
vision (Drs Cook, Leuchter, Witte Conlee, and Dunkin).
This study was supported by Career Development
Award K08-MH01483 (Dr Cook) and by grants R01-
MH40705 and Research Scientist Development Award K02-
MH01165 (Dr Leuchter) from the National Institute of Men-
tal Health, Bethesda, Md. We also acknowledge support by
aYoungInvestigatorAward(RioHondoInvestigator)from
the National Alliance for Research in Schizophrenia and De-
pression, Great Neck, NY (Dr Cook).
We thank Ron Kikinis, MD, for access to the MRX soft-
ware; to Barbara Siegman, REEGT, Mariahn Smith, REEGT,
and Suzanne Hodgkin, REEGT, for recording and process-
ing the QEEG data; to Valerie Gauche for supervising the
MRI scans; and to Kelly Nielson for expert assistance in the
preparation of the manuscript, figures, and tables.
Corresponding author and reprints: Ian A. Cook, MD,
University of California, Los Angeles, Neuropsychiatric In-
stitute, 760 Westwood Plaza, Los Angeles, CA 90024-1759
(e-mail ).
REFERENCES
1. K etonen LM. Neuro imaging of the aging brain. Neurol Clin. 1998;16:581-
598.
2. Leuchter AF, Newton TF, Cook IA, Walter DO, Rosenberg-Thompson S, Lachen-
bruch PA. Changes in brain functional connectivity in Alzheimer-type and multi-
infarct dementia. Brain. 1992;115:1543-1561.
3. Longstreth WT Jr, Manolio TA, Arnold A, et al, for the Cardiovascular Health Study.
Clinical correlates of white matter findings on cranial magnetic resonance im-
aging of 3301 elderly people. Stroke. 1996;27:1274-1282.
4. Longstreth WT Jr, Arnold AM, Manolio TA, et al, for the Cardiovascular Health
Study. Clinical correlates of ventricular and sulcal size on cranial magnetic reso-
nance imaging of 3301 elderly people. Neuroepidemiology. 2000;19:30-42.
5. Smith CD, Snowdon DA, Wang H, Markesbery WR. White matter volumes and
periventricular white matter hyperintensities in aging and dementia. Neurology.
2000;54:838-842.
6. Kumar A, Bilker W, Jin Z, Udupa J. Atrophy and high intensity lesions: comple-
mentary neurobiological mechanisms in late-life depression. Neuropsychophar-
macology.2000;22:264-274.
7. Inzitari D. Age-related white matter changes and cognitive impairment. Ann Neu-
rol.2000;47:141-143.
8. Fazekas F, Schmidt R, Kleinert R, Kapeller P, Roob G, Flooh E. The spectrum of
age-associated brain abnormalities: their measurement and histopathological cor-
relates. JNeuralTransmSuppl.1998;53:31-39.
9. Barber R, Scheltens P, Gholkar A, et al. White matter lesions on magnetic reso-
nance imaging in dementia with Lewy bodies, Alzheimer’sdisease,vascularde-
mentia, and normal aging. JNeurolNeurosurgPsychiatry.1999;67:66-72.
10. de Groot JC, de Leeuw FE, Oudkerk M, et al. Cerebral white matter lesions and
cognitive function: the Rotterdam Scan Study. Ann Neurol. 2000;47:145-151.
11. Guttmann CR, Benson R, Warfield SK, et al. White matter abnormalities in mobility-
impaired older persons. Neurology. 2000;54:1277-1283.
12. Lenze E, Cross D, McKeel D, Neuman RJ, Sheline YI. White matter hyperinten-
sities and gray matter lesions in physically healthy depressed subjects. Am J Psy-
chiatry. 1999;156:1602-1607.
13. Lesser IM, Boone KB, Mehringer CM, Wohl MA, Miller BL, Berman NG. Cogni-
tion and white matter hyperintensities in older depressed patients. Am J Psy-
chiatry. 1996;153:1280-1287.
14. Baum KA, Schulte C, Girke W, Reischies FM, Felix R. Incidental white-matter foci
on MRI in “healthy” subjects: evidence of subtle cognitive dysfunction. Neuro-
radiology.1996;38:755-760.
15. Gunning-Dixon FM, Raz N. The cognitive correlates of white matter abnormali-
ties in normal aging: a quantitative review. Neuropsychology.2000;14:224-232.
16. Kuller LH, Shemanski L, Manolio T, et al. Relationship between ApoE, MRI find-
ings, and cognitive function in the Cardiovascular Health Study. Stroke. 1998;
29:388-398.
17. O’Sullivan M, Jones DK, Summers PE, Morris RG, Williams SC, Markus HS. Evi-
dence for cortical “disconnection” as a mechanism of age-related cognitive de-
cline. Neurology.2001;57:632-638.
18. de Groot JC, de Leeuw FE, Breteler MM. Cognitive correlates of cerebral white
matter changes. JNeuralTransmSuppl.1998;53:41-67.
19. Fukui T, Sugita K, Sato Y, Takeuchi T, Tsukagoshi H. Cognitive functions in sub-
jects with incidental cerebral hyperintensities. Eur Neurol. 1994;34:272-276.
20. Palsson S, Aevarsson O, Skoog I. Depression, cerebral atrophy, cognitive per-
formance and incidence of dementia: population study of 85-year-olds. Br J Psy-
chiatry. 1999;174:249-253.
21. Boone KB, Miller BL, Lesser IM, et al. Neuropsychological correlates of white-
matter lesions in healthy elderly subjects: a threshold effect. Arch Neurol. 1992;
49:549-554.
22. Schmidt R, Fazekas F, Kapeller P, Schmidt H, Hartung HP. MRI white matter hy-
perintensities: three-year follow-up of the Austrian Stroke Prevention Study.
Neurology.1999;53:132-139.
23. Wahlund LO, Almkvist O, Basun H, Julin P. MRI in successful aging, a 5-year
follow-up study from the eighth to ninth decade of life. Magn Reson Imaging.
1996;14:601-608.
24. Kapeller P, Schmidt R. Concepts on the prognostic significance of white matter
changes. JNeuralTransmSuppl.1998;53:69-78.
25. Ylikoski R, Ylikoski A, Erkinjuntti T, Sulkava R, Raininko R, Tilvis R. White mat-
ter changes in healthy elderly persons correlate with attention and speed of men-
tal processing. Arch Neurol.1993;50:818-824.
26. Ylikoski R, Erkinjuntti T, Raininko R, Sarna S, Sulkava R, Tilvis R. White matter
hyperintensities on MRI in the neurologically nondiseased elderly: analysis of
cohorts of consecutive subjects aged 55 to 85 years living at home. Stroke.1995;
26:1171-1177.
27. Salat DH, Kaye JA, Janowsky JS. Prefrontal gray and white matter volumes in
healthy aging and Alzheimer disease. Arch Neurol. 1999;56:338-344.
28. Salat DH, Stangl PA, Kaye JA, Janowsky JS. Sex differences in prefrontal vol-
ume with aging and Alzheimer’sdisease.Neurobiol Aging.1999;20:591-596.
29. Shaw JC. Correlation and coherence analysis of the EEG: a selective tutorial re-
view. Int J Psychophysiol.1984;1:255-266.
30. Leuchter AF, Dunkin JJ, Lufkin RB, Anzai Y, Cook IA, Newton TF. Effect of white-
matter disease on functional connections in the aging brain.JNeurolNeurosurg
Psychiatry. 1994;57:1347-1354.
31. Dunkin JJ, Osato S, Leuchter AF. Relationships between EEG coherence and neu-
ropsychological tests in dementia. Clin Electroencephalogr.1995;26:47-59.
(REPRINTED) ARCH NEUROL / VOL 59, OCT 2002 WWW.ARCHNEUROL.COM
1619
©2002 American Medical Association. All rights reserved.
at Penn State Milton S Hershey Med Ctr, on April 14, 2008 www.archneurol.comDownloaded from
32. Miller MD, Paradis CF, Houck PR, et al. Rating chronic medical illness burden in
geropsychiatric practice and research: application of the Cumulative Illness Rat-
ing Scale. Psychiatry Res.1992;41:237-248.
33. Folstein MF, Folstein SE, McHugh PR. “Mini-Mental State”:apracticalmethod
for grading the cognitive state of patients for the clinician. JPsychiatrRes.1975;
12:189-198.
34. Hamilton M. Development of a rating scale for primary depressive illness. Br
JSocClinPsychol.1967;6:278-296.
35. Hamilton M. A rating scale for depression. JNeurolNeurosurgPsychiatry.1960;
23:56-62.
36. Hachinski VC, Lassen NA, Marshall J. Multi-infarct dementia: a cause of mental
deterioration in the elderly. Lancet. 1974;2:207-210.
37. Cline HE, Lorensen WE, Kikinis R, Jolesz F. Three-dimensional segmentation of
MR images of the head using probability and connectivity. JComputAssist
Tomogr.1990;14:1037-1045.
38. Guttmann CR, Jolesz FA, Kikinis R, et al. White matter changes with normal ag-
ing. Neurology. 1998;50:972-978.
39. Sandor T, Jolesz F, Tieman J, Kikinis R, Jones K, Albert M. Comparative analysis
of computed tomographic and magnetic resonance imaging scans in Alzheimer
patients and controls. Arch Neurol. 1992;49:381-384.
40. Killiany RJ, Gomez-Isla T, Moss M, et al. Use of structural magnetic resonance
imaging to predict who will get Alzheimer’sdisease.Ann Neurol.2000;47:430-
439.
41. Guttmann CR, Kikinis R, Anderson MC, et al. Quantitative follow-up of patients
with multiple sclerosis using MRI: reproducibility. JMagnResonImaging.1999;
9:509-518.
42. Harner PF, Sannit T. AReviewoftheInternationalTen-TwentySystemofElec-
trode Placement. Quincy, Mass: Grass Instrument Co; 1974.
43. Leuchter AF, Cook IA, Newton TF, et al. Regional differences in brain electrical
activity in dementia: use of spectral power and spectral ratio measures. Electro-
encephalogr Clin Neurophysiol.1993;87:385-393.
44. Thatcher RW, Krause PJ, Hrybyk M. Cortico-cortical associations and EEG co-
herence: a two-compartmental model.ElectroencephalogrClinNeurophysiol.1986;
64:123-143.
45. Boone KB, Miller BL, Lesser IM, Hill E. Performance on frontal lobe tests in healthy,
older individuals. Dev Neuropsychol. 1990;6:215-223.
46. Filley CM, HeatonRK,Nelson LM, Burks JS, Franklin GM. A comparison of demen-
tia in Alzheimer’sdiseaseandmultiplesclerosis.Arch Neurol. 1989;46:157-161.
47. Franklin GM, Nelson LM, Filley CM, Heaton RK. Cognitive loss in multiple scle-
rosis: case reports and a review of the literature. Arch Neurol. 1989;46:162-
167.
48. Reitan RM. Assessment of neurophysiological testing [discussion]. Neurology.
1997;49:1179.
49. Rei tan RM, Wolfson D. The Halsted-Reitan Neurophysiological Test Battery.
Tucson, Ariz: Neuropsychology Press; 1985.
50. Cullum CM, Bigler ED. Late effects of hematoma on brain morphology and memory
in closed head injury. Int J Neurosci.1985;28:279-283.
51. Benton AL. Differential behavioral effects in frontal lobe disease. Neuropsycho-
logia. 1968;6:53-60.
52. Shipley WC. A self-administering scale for measuring intellectual impairment and
deterioration. JPsychol.1940;9:371-377.
53. Kaplan EF, Goodglass H, Weintraub S. The Boston Naming Test. 2nd ed. Phila-
delphia, Pa: Lea & Febiger; 1983.
54. Pedhazur EJ. Multiple Regression in Behavioral Research: Explantion and Pre-
diction. Forth Worth, Tex: Holt Rinhart & Winston Inc; 1982.
55. Baron RM, Kenny DA. The moderator-mediator variable distinction in social psy-
chological research: conceptual, strategic, and statistical considerations. JPers
Social Psychol. 1986;51:1173-1182.
56. Pfefferbaum A, Sullivan EV, Jernigan TL, et al. A quantitative analysis of CT and
cognitive measures in normal aging and Alzheimer’sdisease.Psychiatry Res.
1990;35:115-136.
57. Akiyama H, Meyer JS, Mortel KF, Terayama Y, Thornby JL, Konno S. Normal hu-
man aging: factors contributing to cerebral atrophy. JNeurolSci.1997;152:39-
49.
58. Iba´n˜ez V, Pietrini P, Alexander GE, et al. Regional glucose metabolic abnormali-
ties are not the result of atrophy in Alzheimer’sdisease.Neurology. 1998;50:
1585-1593.
59. Meltzer CC, Zubieta JK, Brandt J, Tune LE, Mayberg HS, Frost JJ. Regional hy-
pometabolism in Alzheimer’sdiseaseasmeasuredbypositronemissiontomog-
raphy after correction for effects of partial volume averaging. Neurology.1996;
47:454-461.
60. Haxby JV, Grady CL, Koss E, et al. Heterogeneous anterior-posterior metabolic
patterns in dementia of the Alzheimer type. Neurology. 1988;38:1853-1863.
61. Meyer JS, Rauch G, Rauch RA, Haque A. Risk factors for cerebral hypoperfu-
sion, mild cognitive impairment, and dementia. Neurobiol Aging.2000;21:161-
169.
62. Jernigan TL, Salmon DP, Butters N, Hesselink JR. Cerebral structure on MRI,
part II: specific changes in Alzheimer’sandHuntington’sdiseases.Biol Psychia-
try.1991;29:68-81.
63. Jernigan TL, Press GA, Hesselink JR. Methods for measuring brain morpho-
logic features on magnetic resonance images: validation and normal aging. Arch
Neurol. 1990;44:27-32.
64. Goldstein SJ, Wekstein DR, Kirkpatrick C, Lee C, Markesbery WR. Imaging the
centenarian brain: a computed tomographic study. JAmGeriatrSoc.1985;33:
579-584.
65. Arbuthnott K, Frank J. Trail making test, part B as a measure of executive con-
trol: validation using a set-switching paradigm. JClinExpNeuropsychol.2000;
22:518-528.
66. Schatzberg AF, Posener JA, DeBattista C, Kalehzan BM, Rothschild AJ, Shear
PK. Neuropsychological deficits in psychotic versus nonpsychotic major depres-
sion and no mental illness. Am J Psychiatry. 2000;157:1095-1100.
67. Wecker NS, Kramer JH, Wisniewski A, Delis DC, Kaplan E. Age effects on ex-
ecutive ability. Neuropsychology. 2000;14:409-414.
68. Glatt SL, Hubble JP, Lyons K, et al. Risk factors for dementia in Parkinson’sdis-
ease: effect of education. Neuroepidemiology.1996;15:20-25.
69. Schmand B, Smit JH, Geerlings MI, Lindeboom J. The effects of intelligence and
education on the development of dementia: a test of the brain reserve hypoth-
esis. Psychol Med.1997;27:1337-1344.
70. Koyama K, Hirasawa H, Okubo Y, Karasawa A. Quantitative EEG correlates of nor-
mal aging in the elderly. Clin Electroencephalogr. 1997;28:160-165.
71. Duffy FH, McAnulty GB, Albert MS. Effects of age upon interhemispheric EEG
coherence in normal adults. Neurobiol Aging. 1996;17:587-599.
72. Geschwind N, Kaplan E. A human cerebral deconnection syndrome: a prelimi-
nary report. Neurology. 1962;12:675-685.
73. Geschwind N. Disconnexion syndromes in animals and man, I. Brain.1965;88:
237-294.
(REPRINTED) ARCH NEUROL / VOL 59, OCT 2002 WWW.ARCHNEUROL.COM
1620
©2002 American Medical Association. All rights reserved.
at Penn State Milton S Hershey Med Ctr, on April 14, 2008 www.archneurol.comDownloaded from