Báo cáo khoa học: Suppression of NADPH oxidase 2 substantially restores glucose-induced dysfunction of pancreatic NIT-1 cells doc
Bạn đang xem bản rút gọn của tài liệu. Xem và tải ngay bản đầy đủ của tài liệu tại đây (654.43 KB, 11 trang )
Suppression of NADPH oxidase 2 substantially restores
glucose-induced dysfunction of pancreatic NIT-1 cells
Huiping Yuan, Yonggang Lu, Xiuqing Huang, Qinghua He, Yong Man, Yingsheng Zhou, Shu Wang
and Jian Li
Peking University Fifth School of Clinical Medicine (Beijing Hospital), Beijing, China
Keywords
apoptosis; glucose; NADPH oxidase 2; NIT-1
cells; reactive oxygen species
Correspondence
J. Li, Peking University Fifth School of
Clinical Medicine (Beijing Hospital),
Beijing 100730, China
Fax: +86 10 65237929
Tel: +86 10 58115048
E-mail:
(Received 2 August 2010, revised 28
September 2010, accepted 11 October
2010)
doi:10.1111/j.1742-4658.2010.07911.x
Defects in insulin secretion by pancreatic cells and ⁄ or decreased sensitivity
of target tissues to insulin action are the key features of type 2 diabetes. It
has been shown that excessive generation of reactive oxygen species (ROS)
is linked to glucose-induced b-cell dysfunction. However, cellular mechanisms involved in ROS generation in b-cells and the link between ROS and
glucose-induced b-cell dysfunction are poorly understood. Here, we demonstrate a key role of NADPH oxidase 2 (NOX2)-derived ROS in the deterioration of b-cell function induced by a high concentration of glucose.
Sprague–Dawley rats were fed a high-fat diet for 24 weeks to induce diabetes. Diabetic rats showed increased glucose levels and elevated ROS generation in blood, but decreased insulin content in pancreatic b-cells. In vitro,
increased ROS levels in pancreatic NIT-1 cells exposed to high concentrations of glucose (33.3 mmolỈL)1) were associated with elevated expression
of NOX2. Importantly, decreased glucose-induced insulin expression and
secretion in NIT-1 cells could be rescued via siRNA-mediated NOX2
reduction. Furthermore, high glucose concentrations led to apoptosis of
b-cells by activation of p38MAPK and p53, and dysfunction of b-cells
through phosphatase and tensih homolog (PTEN)-dependent Jun N-terminal kinase (JNK) activation and protein kinase B (AKT/PKB) inhibition,
which induced the translocation of forkhead box O1 and pancreatic duodenal homeobox-1, followed by reduced insulin expression and secretion. In
conclusion, NOX2-derived ROS could play a critical role in high glucoseinduced b-cell dysfunction through PTEN-dependent JNK activation and
AKT inhibition.
Introduction
Diabetes mellitus comprises a number of diseases characterized by high levels of blood glucose resulting from
defects in insulin production and ⁄ or insulin action.
Type 2 diabetes may account for more than 90% of all
diagnosed cases of diabetes. Insulin resistance first
results in a disorder in which cells cannot utilize insulin
properly and ⁄ or gradual loss occurs in the ability of
pancreatic b-cells to produce insulin as the need for
insulin increases due to elevated circulating glucose
levels [1]. This leads to a vicious cycle between insulin
Abbreviations
AKT/PKB, protein kinase B; DPI, diphenyliodinium; FAM, fluorescein amidite; FOXO1, forkhead box O1; ICAM-1, inter-cellular adhesion
molecule 1; JNK, Jun N-terminal kinase; L-NAME, N G-nitro-L-arginine methyl ester; NOX, NADPH oxidase; PDX-1, pancreatic duodenal
homeobox-1; PIP3, phosphatidylinositol(3,4,5)-triphosphate (PtdIns(3,4,5)P3); PTEN, phosphatase and tensih homolog; ROS, reactive oxygen
species; VCAM-1, vascular adhesion molecule 1.
FEBS Journal 277 (2010) 5061–5071 ª 2010 The Authors Journal compilation ª 2010 FEBS
5061
Glucose induces dysfunction of pancreatic cells
H. Yuan et al.
Glucose level (mmol·L–1)
and glucose levels termed ‘glucotoxicity’ [2]. Glucotoxicity is a secondary phenomenon that is proposed
to play a role in all forms of type 2 diabetes. Continuous overstimulation of b-cells by glucose could eventually lead to depletion of insulin stores, worsening of
hyperglycemia, and finally deterioration of b-cell
function [2].
A large body of evidence shows that increased generation of reactive oxygen species (ROS) destroys the
function of b-cells and the balance between glucose
and insulin, suggesting a link between high glucose levels and b-cell dysfunction [3,4]. However, the cellular
mechanisms involved in ROS generation in b-cells and
the link between ROS and glucose-induced b-cell dysfunction are poorly understood.
ROS are produced via multiple processes such as the
mitochondrial electron transport chain, nitric oxide
synthase and xanthine oxidase, as well as a family of
NADPH oxidases (NOX) [5]. Although the source of
ROS generation in insulin-secreting pancreatic b-cells
has traditionally been considered to be the mitochondrial electron transport chain, recent attention has
focused on NOX enzymes as a potential source of
ROS production in pancreatic b-cells, and the various
isoforms that contribute to O2Ỉ) and H2O2 production
under various conditions [6]. It has been reported that
activation of NOX plays an important role in ROS
production by pancreatic b-cells during glucose-stimulated insulin secretion [7]. However, the relationship
between NOX and oxidative stress-mediated dysfunction of b-cells is still unclear.
In the present study, we demonstrate that NOX2derived ROS play a key role in the deterioration of
b-cell function induced by high concentrations of
A
*
20
10
Results
Diabetic rats show increased blood glucose
levels, elevated ROS production and impaired
insulin content in pancreatic cells
Pancreatic b-cell functions, such as insulin biosynthesis
and secretion, are often impaired under the chronic
hyperglycemic conditions found in diabetes. To examine the functional effects of glucotoxicity on insulin
secretion, insulin gene expression and b-cell death, nine
4-week-old male Sprague–Dawley rats were fed a highfat diet containing 20% fat and 20% sucrose for
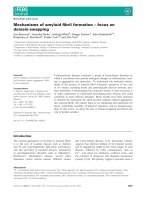
24 weeks to induce diabetes. Glucose levels in the
blood were significantly increased in the diabetic rats
(Fig. 1A), accompanied by impaired insulin synthesis
(Fig. 1B), suggesting deterioration of b-cell function.
Moreover, levels of ROS production in the pancreas of
diabetic rats were significantly increased, confirming a
state of oxidative stress (Fig. 1C). These in vivo observations suggest that oxidative stress could contribute
to dysfunction of pancreatic b-cells under diabetic
conditions.
D-glucose leads to enhanced ROS generation,
apoptosis and dysfunction of NIT-1 cells
Because animal models of diabetes are complex and
may be accompanied by alterations such as high levels
of triglyceride, it is difficult to determine the contribution of glucose to oxidative stress and dysfunction of
B
25
15
glucose. Suppression of NOX2 substantially reverses
glucose-induced dysfunction of pancreatic NIT-1 cells.
*
Control
Control
Diabetes
Diabetes
*
*
5
0
0
0.5
1
Time point (h)
C
Control
Diabetes
5062
ROS
2
Insulin
Merge
Fig. 1. Analysis of blood glucose level,
insulin content and ROS generation in
pancreas of diabetic rats. Rats were fed a
high-fat diet containing 20% fat and 20%
sucrose for 24 weeks. Glucose level (A),
insulin content (B) and ROS production (C)
in the pancreas of rats. Data are
means ± SEM (n = 9). *P < 0.05 for
comparison with control rats by ANOVA
test.
FEBS Journal 277 (2010) 5061–5071 ª 2010 The Authors Journal compilation ª 2010 FEBS
Glucose induces dysfunction of pancreatic cells
A
ROS production
(fold of control)
2
1
0
11.1
5.5
22.2
2.5
2.0
1.0
0.5
0.0
33.3
0h
6h
12 h
24 h
48 h
–1
D-Glucose (33.3 mmol·L )
D
0.3
*
Control
Glucose
0.2
0.1
0.0
1.2
Relative quantification
(fold of control)
C
**
*
1.5
–1
D-Glucose (mmol·L )
Insulin secretion
(ng·mg–1 of cellular protein)
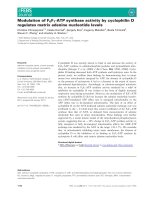
Fig. 2. D-glucose-induced ROS generation,
apoptosis and dysfunction of NIT-1 cells.
ROS levels increased dose- and timedependently after exposure of NIT-1 cells to
)1
D-glucose (A,B). D-glucose (33.3 mmolỈL ,
48 h) increased basal insulin secretion
(2.5 mmolỈL)1 D-glucose) and decreased
glucose stimulated insulin secretion
(20 mmolỈL)1 D-glucose) in NIT-1 cells (C),
reduced the insulin mRNA level as shown
by real-time PCR (D), and induced apoptosis
as assessed by double-staining with
Annexin V and PI (E). Data are
means ± SEM (n = 3 independent
experiments). *P < 0.05 and **P < 0.01 for
comparison with control conditions by
ANOVA test.
**
B
ROS production
(fold of control)
H. Yuan et al.
**
1.0
0.8
0.6
0.4
0.2
0.0
Basal
Control
Glucose-stimulated
Glucose
E
Neg
pancreatic b-cells. Therefore, the observations in vivo
need to be re-assessed in vitro. We investigated the
effects of high concentrations of glucose on ROS production, b-cell dysfunction and apoptosis in cultured
NIT-1 cells, a mouse pancreatic b-cell line. First
we examined whether ROS levels were altered by
d-glucose treatment. As shown in Fig. 2A,B, ROS
levels were increased in a dose- and time-dependent
manner by exposure of NIT-1 cells to d-glucose. To
further analyze the effect of d- glucose on b-cell dysfunction, we assessed insulin expression and secretion
in NIT-1 cells exposed to 33.3 mmolỈL)1 d-glucose for
48 h. ELISA showed increased basal insulin secretion
(2.5 mmolỈL)1 d-glucose in KRBH buffer) and decreased
glucose stimulated insulin secretion (20 mmolỈL)1
d-glucose in KRBH buffer) in NIT-1 cells in response
to d-glucose (Fig. 2C). Moreover, insulin mRNA levels
were significantly reduced in NIT-1 cells treated with
d-glucose, as shown by real-time PCR (Fig. 2D). These
results show that exposure to d-glucose led to dysfunction of NIT-1 cells.
We next assessed whether d-glucose induces apoptosis of NIT-1 cells. NIT-1cells were doubly stained
using Annexin V and PI kit. Annexin V can combine
with the phosphatidylserine on the surface of the cellular membrane that is activated by very early apoptosis
signals and translocated to the membrane. In addition,
PI stains cells that are at a later stage of apoptosis or
death. Figure 2E shows the apoptosis in NIT-1 cells
treated with 33.3 mmolỈL)1 of d-glucose for 24 h.
CTRL
D-Glucose
Si + G
PTEN-dependent JNK activation and AKT
inhibition are involved in D-glucose-induced
dysfunction of NIT-1 cells
To assess the molecular mechanisms involved in
impaired function of b-cells, we investigated several signal transduction pathways such as JNK and ERK1 ⁄ 2.
ERK1 ⁄ 2 was not activated in d-glucose-treated NIT-1
cells (data not shown), but phosphorylation of PTEN,
JNK and AKT were altered in response to d-glucose.
It has been reported that, under oxidative stress, PTEN
is phosphorylated at 380Ser ⁄ 382 ⁄ 383Thr, leading to
activation of JNK by phosphorylation at 183Thr ⁄
185Tyr. As a consequence, AKT phosphorylation
is decreased through increased phosphatidylinositol
(3,4,5)-triphosphate (PtdIns(3,4,5)P3) (PIP3) production
[8]. Therefore, we focused on PTEN-dependent JNK
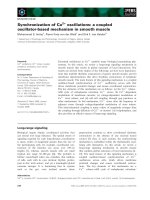
activation and AKT inhibition. As shown in Fig. 3A,
phosphorylation of PTEN and JNK was elevated, but
phosphorylation of AKT was reduced, in d-glucosetreated NIT-1 cells. Importantly, PTEN-dependent
JNK activation and AKT inhibition was rescued by
transfection of siRNA-PTEN into NIT-1 cells.
It has been shown that oxidative stress induces the
nuclear translocation of forkhead box O1 (FOXO1)
through activation of the JNK pathway, leading to
nucleocytoplasmic translocation of pancreatic duodenal homeobox-1 (PDX-1) [9]. To further analyze the
translocation of FOXO1 and PDX-1 in response to
d-glucose, we isolated proteins of the nuclei and
FEBS Journal 277 (2010) 5061–5071 ª 2010 The Authors Journal compilation ª 2010 FEBS
5063
Glucose induces dysfunction of pancreatic cells
A
si-PTEN
Glucose si-PTEN + G
Protein level (fold of control)
Control
H. Yuan et al.
PTEN
p-PTEN
p-Akt
Akt
β-actin
1.50
Control
si-PTEN
Glucose
si-PTEN + Glucose
*
*
1.25
†
†
1.00
*
0.50
0.25
0.00
p-PTEN/β-actin PTEN/β-actin
B
C
Cytoplasm
†
0.75
Control
PDX-1
si-PTEN
Glucose si-PTEN + G
Insulin
β-actin
β-actin
Nucleus
FOXO1
PDX-1
PCNA
Control
Glucose
Protein level (fold of control)
FOXO1
p-Akt/Akt
1.25
1.00
††
0.75
0.50
**
0.25
0.00
Control si-PTEN Glucose si-PTEN +
Glucose
cytoplasmic fractions of NIT-1 cells after exposure to
d-glucose for 48 h. Western blotting showed that the
FOXO1 content decreased in the cytoplasm but
increased in the nucleus. In contrast, the level of PDX-1
increased in the cytoplasm but decreased in the nucleus
(Fig. 3B). Moreover, the d-glucose-induced decreased
insulin content was reversed by down-regulation of
PTEN (Fig. 3C).
Fig. 3. Signal transduction pathways
involved in D-glucose-induced dysfunction of
NIT-1 cells. D-glucose (33.3 mmolỈL)1, 48 h)
increased the phosphorylation of PTEN and
JNK and decreased the phosphorylation of
AKT. This effect was reversed by transfection of siRNA-PTEN into NIT-1 cells (A).
FOXO1 content was decreased in the
cytoplasm but increased in the nucleus; in
contrast, the level of PDX-1 was increased
in the cytoplasm but decreased in the
nucleus (B). siRNA-PTEN reversed
D-glucose-induced impaired insulin content
(C). *P < 0.05 and **P < 0.01 by ANOVA
test (D-glucose versus control). P < 0.05
and P < 0.01 by ANOVA test (siRNAPTEN + D-glucose versus D-glucose).
NIT-1 cells (Fig. 4C). Moreover, d-glucose stimulated
elevated expression of cytochrome c and its release from
mitochondria to the cytoplasm (Fig. 4C), resulting in
activation of caspase-3. These observations suggest that
p38MAPK and p53 mediate the apoptosis of NIT-1 cells
induced by d-glucose.
Suppression of NOX2 substantially restores
dysfunction and apoptosis of
NIT-cells
D-glucose-induced
P38MAPK and p53 mediate the apoptosis of
NIT-1 cells induced by D-glucose
We next explored the molecular mechanisms involved
in apoptosis of b-cells induced by d-glucose. It has
been reported that p38MAPK is activated by dual
phosphorylation of 180Thr and 182Tyr residues, and
p53 is activated by phosphorylation of 15Ser residues.
Phosphorylation of p38MAPK and p53 is widely held
to represent its activation in response to oxidative
stress. In the present study, we found that exposure
to d-glucose for 48 h substantially stimulated phosphorylation of p53 and p38MAPK (Fig. 4A,D). It
bas been suggested that NF-jB is involved in
apoptosis mediated by p53. As shown in Fig. 4B,
d-glucose enhanced phosphorylation of I-jB at 32Ser,
followed by degradation of I-jB, confirming NF-jB
activation.
We further assessed the molecules involved in d-glucose-induced apoptosis. The levels of Bcl-2 and Bax, key
factors in the process of apoptosis, were measured by
western blot. A decreased Bcl-2 level and an increased
Bax content, accompanied by the translocation of Bax
into the mitochondria, were found in d-glucose-treated
5064
To investigate the potential role of the NOX family in
the glucose-induced elevated ROS generation that
leads to dysfunction of b-cells, we first identified the
source of ROS generated in response to d-glucose by
determination of the effects on d-glucose-induced ROS
levels of various inhibitors of ROS-generating systems:
2.5 lmolỈL)1 diphenyliodinium (DPI), which inhibits
NOX, 50 lmolỈL)1 NG-nitro-l-arginine methyl ester
(l-NAME), which inhibits nitric oxide synthases,
1 lmolỈL)1 Rotenone, which inhibits the mitochondrial
respiratory chain, and 50 lmolỈL)1 oxypurinol, which
inhibits xanthine oxidase. As shown in Fig. 5A, DPI
and Rotenone, but not l-NAME or oxypurinol, significantly suppressed the generation of ROS induced by
d-glucose, suggesting that NOX is a leading candidate
for production of ROS in NIT-1 cells.
We next analyzed the expression profile of the NOX
family in NIT-1 cells. RT-PCR showed expression of
NOX2 and its subunits, such as p22phox, p47phox,
p67phox and Rac1, but not of NOX1, NOX3, NOX4
or NOX5 in NIT-1 cells (Fig. 5B). Importantly, d-glucose significantly increased the expression of NOX2,
FEBS Journal 277 (2010) 5061–5071 ª 2010 The Authors Journal compilation ª 2010 FEBS
H. Yuan et al.
Glucose induces dysfunction of pancreatic cells
Control
Glucose
Protein level (fold of control)
A
P38
p-P38
P53
p-P53
β-actin
3
Control
Glucose
**
*
2
*
1
0
p-P38/P38
B
Control
Glucose
C
p-P53/β-actin P53/β-actin
Control
Glucose
I-κB
Mito-bax
p-I-κB
Mito-HSP70
ICAM-1
Cyt c
VCAM-1
β-actin
β-actin
Fig. 4. Molecular mechanisms involved in
apoptosis of b-cells induced by D-glucose.
)1
D-glucose (33.3 mmolỈL , 48 h) stimulated
the phosphorylation of p53 and p38MAPK
(A). D-glucose stimulated degradation of
I-jB, phosphorylation of I-jB at 32Ser,
expression of ICAM-1 and VCAM-1 (B),
expression and translocation of Bax (C), and
release and translocation of cytochrome c
(C,D). *P < 0.05 and **P < 0.01 for
comparison with control conditions by
ANOVA test.
D
Negative
Control
Glucose
Cyt c
DAPI
Merge
but not that of p22phox, p47phox, p67phox and Rac1
(Fig. 5C). NOX1, NOX3, NOX4 and NOX5 were also
not expressed in d-glucose-treated NIT-1 cells (data
not shown).
Moreover, reduction of NOX2 by transfection of
siRNA-NOX2 into NIT-1 cells significantly suppressed
d-glucose-induced elevated ROS levels (Fig. 5D) and
apoptosis (Fig. 2E), and reversed d-glucose-induced
impaired synthesis and secretion of insulin (Fig. 5E,F).
Finally, the effects of d-glucose on activation of JNK,
p38MAPK and p53 pathways were reversed by NOX2
down-regulation in NIT-1 cells (Fig. 5G).
Taken together, these results demonstrate that suppression of NOX2 substantially restores d-glucoseinduced dysfunction and apoptosis of NIT-1 cells.
Discussion
Type 2 diabetes is normally described as a multifactor-induced disease. Increased glucose levels and
dysfunction of pancreatic cells have been shown to be
key features of type 2 diabetes. Glucotoxicity is proposed to play an important role in the pathogenesis of
type 2 diabetes. In particular, pancreatic b-cell function, such as insulin biosynthesis and secretion, is often
impaired under the chronic hyperglycemic conditions
found in diabetes. Given the weight of experimental
evidence, it is now widely accepted that ROS contribute to the cell and tissue dysfunction and damage
caused by ‘glucotoxicity’ in diabetes. Under diabetic
conditions, ROS levels are increased in many tissues
and organs, leading to the progression of b-cell dysfunction in type 2 diabetes [10]. In addition, because
pancreatic islet cells express a relatively low amount of
anti-oxidative enzymes such as glutathione peroxidase
and catalase [11], b-cells are sensitive to oxidative
stress. Thus, research has focused on the critical role
of oxidative stress in the deterioration of b-cell function. The aims of this study were to: confirm whether
NOX2 is the source of ROS generated in response to
FEBS Journal 277 (2010) 5061–5071 ª 2010 The Authors Journal compilation ª 2010 FEBS
5065
Glucose induces dysfunction of pancreatic cells
A
ROS production
(fold of control)
**
2.0
**
**
**
p47phox p67phox
C NOX2
1.5
p22phox
1.0
††
p47phox
††
0.5
p67phox
Rac-1
0.0
l
e
ro
nt
Co
ROS production
(fold of control)
phox
NS
**
D
Marker NOX1 NOX2 NOX3 NOX4 Rac1 p22
B
NS
2.5
H. Yuan et al.
lu
G
G
H
SO
s
co
+
DM
G
aO
+
N
G
+
G
I
DP
+
2
1.8
1.6
1.4
1.2
1
0.8
0.6
0.4
0.2
0
n
te
Re
G
ol
e
on
pu
xy
+
LA
rin
+
G
O
β-actin
NM
Control
E
Control
Glucose
si-NOX2
Glucose
si-NOX2+G
NOX2
*
PTEN
p-PTEN
†
Akt
p-Akt
Glucose
–
–
–
–
+
+
+
si-NOX2
FAM
Transfection
reagent
–
–
–
–
–
+
+
–
–
–
+
–
–
–
–
+
–
–
–
+
–
JNK
p-JNK
Insulin
β-actin
Control
*
si-NOX2
Protein level
(fold of control)
†
si-NOX2 + Glucose
†
1.00
15.0
Glucose
*
1.25
††
††
0.75
0.50
0.00
p-PTEN/β-actin PTEN/β-actin
F
*
0.3
Insulin secretion
(ng·mg–1 of cellular protein)
**
**
0.25
p-Akt/Akt
p-JNK/JNK protein level
(fold of control)
1.50
12.5
10.0
†
7.5
5.0
2.5
0.0
Insulin/β-actin
**
Control
si-NOX2
Glucose
si-NOX2 + Glucose
Control
si-NOX2
Glucose
si-NOX2 +
Glucose
**
NS
*
Control
Glucose
si-NOX2
si-NOX2 + Glucose
†
0.2
*
0.1
0.0
G
Basal
Control
Glucose-stimulated
-
si-NOX2
Glucose si-NOX2 + G
P38
2.5
p-P53
bcl-2
Protein level
(fold of control)
2.0
P53
Control
si-NOX2
Glucose
si-NOX2 + Glucose
**
p-P38
**
*
1.5
††
††
†
p-P53/β-actin
P53/β-actin
1.0
0.5
Caspase-3
0.0
β-actin
p-P38/P38
high concentrations of glucose, explore the molecular
mechanisms of glucotoxicity in diabetes, and define the
critical role of NOX2-derived ROS in the dysfunction
and apoptosis of b-cells induced by d-glucose.
5066
Fig. 5. Effects of siRNA-NOX2 on
D-glucose-induced production of ROS and
dysfunction and apoptosis of NIT-1 cells. (A)
Effects on D-glucose-induced ROS generation of various inhibitors of ROS-generating
systems: 2.5 lmolỈL)1 diphenyliodinium
(DPI), which inhibits NOX, 50 lmolỈL)1 NG
nitro-L arginine methyl ester (L NAME),
which inhibits nitric oxide synthases,
1 lmolỈL)1 Rotenone, which inhibits the
mitochondrial respiratory chain, and
50 lmolỈL)1 oxypurinol, which inhibits
xanthine oxidase. Dimethyl sulfoxide and
NaOH were used as solvent controls. (B,C)
Expression profile of NOX family members
in NIT-1 cells without or with D-glucose
treatment. NIT-1 cells were transiently
transfected with siRNA-NOX2 for 48 h
followed by treatment with D-glucose
(33.3 mmolỈL)1) for 48 h. ROS production
(D), insulin expression and activation of the
JNK pathway (E), release of insulin (F) and
activation of the p38MAPK and p53
pathways (G) were assessed. Data are
means ± SEM (n = 3 independent
experiments). *P < 0.05 and **P < 0.01
by ANOVA test (D-glucose versus control).
P < 0.05 and P < 0.01 by ANOVA test
(siNOX2 + D-glucose versus D-glucose).
There is growing evidence suggesting that ROS are
produced via multiple processes such as via NOX, the
mitochondrial electron transport chain, nitric oxide
synthase and xanthine oxidase. The source of ROS
FEBS Journal 277 (2010) 5061–5071 ª 2010 The Authors Journal compilation ª 2010 FEBS
H. Yuan et al.
generation in insulin-secreting pancreatic b-cells has
traditionally been considered to be the mitochondrial
electron transport chain, but recent attention has
focused on NOX enzymes as a potential source of
ROS production in pancreatic b-cells [6]. Those
authors found suppression of high glucose-induced
ROS production and decreased glucose-stimulated
insulin secretion by DPI in cells of the insulin-producing
cell line MIN. We obtained a similar result in NIT-1
cells. In the present study, we found that DPI and
Rotenone, but not l-NAME or oxypurinol, significantly suppressed the generation of ROS induced by
d-glucose. However, the possibility that ROS are also
derived from the mitochondrial electron transport
chain is not ruled out by our results. NOX is a multicomponent enzyme comprising two membrane-associated proteins and cytosolic subunits. Gp91phox was
first identified in phagocytes and also termed NOX2.
In connection with similar membrane-associated proteins p22phox, NOX form the catalytic core of the
enzyme family by incorporating the flavocytochrome
b558 complex. p47phox, p67phox and the small G-protein
Rac located in the cytoplasm play as regulatory role
by interacting with the cytochrome. The NOX family
has seven known isoforms (NOX1, NOX2, NOX3,
NOX4, NOX5, Duox1 and Duox2), which are localized in specific tissues and perform diverse functions
[5]. In the present study, RT-PCR indicated expression
of NOX2 and subunits such as p22phox, p47phox,
p67phox and Rac1, but not of NOX1, NOX2, NOX4
and NOX5 in NIT-1 cells. Moreover, NOX2 downregulation by transfection of siRNA-NOX2 led to
reduced ROS generation, reversing d-glucose-induced
impaired synthesis and secretion of insulin in NIT-1
cells. These observations suggest that NOX2 could be
a leading candidate for production of ROS in NIT-1
cells. However, whether NOX2 acts as source of ROS
production in vivo, and how glucose up-regulates the
expression of NOX2 requires further investigation.
It has been reported that NF-jB, p38MAPK and
p53 are the key points relating to apoptosis [12]. An
inhibitor of p38MAPK was used to confirm its role
in apoptosis. The increased level of phosphorylation
indicates that activation of p38MAPK and p53 are
involved in the pathways of cell apoptosis. It has been
suggested that NF-jB is involved in the process of
apoptosis mediated by p53. In addition, it is considered
that apoptosis induced by d-glucose is mitochondriadependent. A high level of glucose serves as a stimulus
to release cytochrome c to the cytoplasm from mitochondrial cristae, leading to cleavage of caspase-3 [13].
Our results suggest that p38MAPK and p53 mediate
the apoptosis of NIT-1 cells induced by d-glucose.
Glucose induces dysfunction of pancreatic cells
Exposure to d-glucose for 48 h substantially stimulated
phosphorylation of p38MAPK and p53, accompanied
by activation of NF-jB and increased expression of
inter-cellular adhesion molecule 1 (ICAM-1) and vascular adhesion molecule 1 (VCAM-1). Moreover, a
decreased Bcl-2 level and an increased Bax content,
followed by release of cytochrome c and activation
of caspase-3, were also found in d-glucose-treated
NIT-1 cells.
With regard to the molecular mechanism of b-cell
deterioration, it has been reported that activity of
JNK pathway is abnormally elevated in various
tissues under diabetic conditions [14]. JNK activation
is involved in the reduction of insulin gene expression
in response to oxidative stress, and suppression of
the JNK pathway can protect b-cells from glucose
toxicity [15]. In addition, the PTEN-mediated JNKdependent pathway is thought to be the main pathway with respect to dysfunction of b-cells [8]. We
found that phosphorylation of PTEN and JNK was
elevated, but phosphorylation of AKT was reduced,
in d-glucose-treated NIT-1 cells. Importantly, PTENdependent JNK activation and AKT inhibition were
reversed by transfection of siRNA-PTEN into NIT-1
cells. It is noteworthy that d-glucose-induced JNK
activation and AKT inhibition resulted in decreased
phosphorylation of FOXO1 following nuclear localization and nucleocytoplasmic translocation of
PDX-1, leading to reduction of insulin levels and
ultimately dysfunction of b-cells. It is proposed that
transcription factor FOXO1 functions as a bridge
between AKT and PDX-1 [16]. FOXO1 was recently
reported to inhibit PDX-1 gene transcription in pancreatic b-cells [17], suggesting that it is involved in
the deterioration of b-cell function. Moreover,
FOXO1 translocation may modulate the nucleocytoplasmic translocation of PDX-1. Importantly, oxidative stress induces nuclear translocation of FOXO1
through activation of the JNK pathway, leading to
nucleocytoplasmic translocation of PDX-1. It has
been shown that PDX-1 functions as an accelerator
of b-cell functions, such as insulin transcription,
growth and proliferation. The reduction of insulin
gene expression in NIT-1 cells exposed to high glucose levels is accompanied by a decrease in PDX-1
expression in nuclei, implicating PDX-1 in b-cell
dysfunction. More interestingly, d-glucose-induced
activation of JNK, inhibition of AKT and decreased
phosphorylation of FOXO1, followed by nucleocytoplasmic translocation of PDX-1, was reversed by
NOX2 down-regulation in NIT-1 cells, demonstrating
a critical role for NOX2-derived ROS in the deterioration of b-cell function.
FEBS Journal 277 (2010) 5061–5071 ª 2010 The Authors Journal compilation ª 2010 FEBS
5067
Glucose induces dysfunction of pancreatic cells
H. Yuan et al.
with fluorescein isothiocyanate/horseradish peroxidaseconjugated anti-rabbit IgG at 37 °C for 60 min. Finally, the
cover slips were mounted using 1,4-diazabicyclo[2.2.2]octane
(Sigma, The Woodlands, TX, USA).
Experimental procedures
Animals
Nine 4-week-old male Sprague–Dawley rats were fed a
high-fat diet containing 20% fat and 20% sucrose for
24 weeks to induce diabetes. Nine control rats were fed
standard laboratory food for 24 weeks. All animal procedures were performed in accordance with the National
Institutes of Health Animal Care and Use Guidelines. All
animal protocols were approved by the Animal Ethics
Committee at the Beijing Institute of Geriatrics.
Determination of apoptosis occurrence
To assess the occurrence of apoptosis in NIT-1 cells, cells
were double-stained with Annexin V and a PI kit (Baosai,
Beijing, China) according to the manufacturer’s protocol.
Stained nuclei were immediately visualized by fluorescence
microscopy.
Cell culture
RNA isolation, RT-PCR and real-time PCR
NIT-1 cells derived from mouse pancreatic b-cells (American
Type Culture Collection) were cultured in low-glucose
Dulbecco’s modified Eagle’s medium (5 mmolỈL)1 glucose,
Gibco, Grand Island, NY, USA) supplemented with 10%
fetal bovine serum (Hyclone, Logan City, UT, USA),
100 U mL)1 penicillin (Gibco) and 0.1 mgỈmL)1 streptomycin (Gibco) at 37 °C in a humidified atmosphere of 95% O2,
5% CO2.
Total RNA was isolated from NIT-1 cells using Trizol
reagent (Invitrogen, Carlsbad, CA, USA). Reverse transcription was performed using 1 lg RNA at 60 °C for
35 min using a reverse transcription kit (A3500, Promega,
Fitchburgm, WI, USA) containing 0.5 lg random primers,
15 units of avian myeloblastosis virus and 0.5 units of
RNasin RNase inhibitor. After reverse transcription, the
cDNAs were used for semi-quantitative PCR using sets of
specific primers as shown in Table 1. An initial denaturation at 94 °C for 5 min was followed by 30 cycles of 94 °C
for 1 min, 60 °C for 1 min and 72 °C for 1 min. RT-PCR
was completed by incubation at 72 °C for 7 min. Aliquots
(15 lL) of the reaction mixture were run on a 1.5% agarose
gel, and photographed on a UV transilluminator using a
digital camera.
Real-time PCR was performed using an A7500 real-time
thermal cycler (ABI, Foster City, CA, USA). The specific
Determination of ROS
Cells (3 · 105 cells per mL) were incubated with 5 lmolặL)1
of 2Â7Â-dichlorouorescein diacetate (Sigma, The Woodlands,
TX, USA) for 40 min at 37 °C. The 2¢7¢-dichlorofluorescein
fluorescence was measured by fluorescence-activated cell
sorting with excitation ⁄ emission wavelengths of 488 ⁄ 525 nm.
Sections of optimum cutting temperature-embedded pancreas were incubated with 10 lm dihydroethidium (Sigma)
for 15 min at room temperature. The sections were analyzed
by fluorescence microscopy.
Immunofluorescence and immunohistochemistry
Cover slips of NIT-1 cells or sections of optimum cutting
temperature-embedded pancreas of rats were incubated with
polyclonal antibodies at 37 °C for 60 min, and then labeled
Table 2. Nucleotide sequences of primers used for real-time PCR.
Forward primer
(5¢ fi 3¢)
Insulin
GAPDH
AGGCTTTTGTCA
AACAGCACCTT
CGTCCCGTAGAC
AAAATGGT
Reverse primer (5¢ fi 3¢)
ATCCACAATGCCACGCTTCTG
TTGATGGCAACAATCTCCAC
Table 1. Nucleotide sequences of primers used for PCR.
Forward primer (5¢ fi 3¢)
NOX1
NOX2
NOX3
NOX4
p22phox
p47phox
p67phox
Rac1
b-actin
5068
Reverse primer (5¢ 3Â)
GAAATTCTTGGGACTGCCTTGG
TGGGGAAAAATAAAGGAGTGCC
AGCTGCCTTATGCCCTGTACCTC
GGACGTCCTGGTGGAAACTT
GGAGCGATGTGGACAGAAGTA
CTATCTGGAGCCCCTTGACA
CCAGAAGACCTGGAATTTGTG
AGACAATTTGGGCACACCTC
GTGGGGCGCCCCAGGCACCA
GCTGGAGAGAACAGAAGCGAGA
CTCCCACTAACATCACCACCTCATA
AGGCCTTCAATAACGCGCCTCTGTC
GCAAACCCTTGGGTATTCTTTGG
GCACCGACAACAGGAAGTG
ACAGGGACATCTCGTCCTCTT
AAATGCCAACTTTCCCTTTACA
GCTTCGTCAAACACTGTCTTG
CTCCTTAATGTCACGCACGATTTC
FEBS Journal 277 (2010) 50615071 ê 2010 The Authors Journal compilation ª 2010 FEBS
H. Yuan et al.
Glucose induces dysfunction of pancreatic cells
Table 3. Nucleotide sequences used for RNA interference (RNAi).
Negative control
(FAM-siRNA)
siRNA-NOX2
siRNA-PTEN
Sense
Antisense
Sense
Antisense
Sense
Antisense
5¢-UUCUCCGAACGUGUCACGUTT -3¢
5¢-ACGUGACACGUUCGGAGAATT-3¢
5¢-UGCCAGAGUCGGGAUUUCUTT-3¢
5¢-AGAAAUCCCGACUCUGGCATT-3¢
5¢-GTATAGAGCGTGCAGATAATT-3¢
5¢-UUAUCUGCACGCUCUAUACTT-3¢
primers are shown in Table 2. Amplification was performed
as recommended by the manufacturer with a 25 lL reaction
mixture containing 12.5 lL of SYBR Green PCR master
mix (Applied Biosystems, Foster City, CA, USA), the
appropriate primer concentration, and 1 lL of cDNA.
Relative cDNA concentrations were established from a
standard curve prepared using sequential dilutions of corresponding PCR fragments. The data were normalized to
results obtained for glyceraldehyde-3-phosphate dehydrogenase. The amplification program included an initial
denaturation step at 95 °C for 10 min, then 40 cycles of
denaturation at 95 °C for 10 s and annealing and extension
at 60 °C for 1 min. Fluorescence was measured at the end
of each extension step. After amplification, melting curves
were produced and used to determine the specificity of
PCR products.
siRNA transfection
siRNAs targeting mouse NOX2 or PTEN mRNA were
transfected into NIT-1 cells using Tran MessengerÔ transfection reagent (Qiagen, Hilden, Germany) according to the
manufacturer’s instructions. A luciferase siRNA (fluorescein
amidite FAM) was used as a negative control. RNAi oligonucleotides for transfection are shown in Table 3.
Protein preparation of whole-cell, nuclei,
cytoplasmic and mitochondrial fractions
NIT-1 cells were lysed in lysis buffer containing 50 mmolỈL)1
Tris ⁄ HCl pH 8.0, 150 molỈL)1 NaCl, 0.02% NaN3, 0.1%
SDS, 1% NP-40 (Fluka, Sigma-Aldrich Inc., The Woodlands, TX, USA), 100 lgỈmL)1 phenylmethanesulfonyl
fluoride, 1 lgỈmL)1 aprotinin and 0.5% sodium deoxycholate supplemented with phosphatase inhibitor cocktails 1
and 2 (Sigma), and sonicated for 2 s to shear DNA. Cell
lysates were centrifuged at 12 000 g for 10 min. Supernatant was used for western blot analysis.
Proteins of the nucleic and cytoplasmic fractions of NIT-1
cells were prepared as described previously [9]. Briefly, the
cells were collected and centrifuged for 20 s in a microcentrifuge, followed by resuspension in buffer 1 containing
10.0 mmolỈL)1 Hepes pH 7.9, 10.0 mmolỈL)1 KCl,
1.5 mmolỈL)1 MgCl2 and 0.5 mmolỈL)1 dithiothreitol. After
incubation at 4 °C for 15 min, the cells were lysed using a
Dounce homogenizer. The suspension was centrifuged for
20 s in a microcentrifuge, and the supernatant (cytoplasmic
fraction) was collected and frozen. The pellet, which
contained the nuclei, was resuspended in 150 lL buffer 2
containing 20 mmolỈL)1 Hepes pH 7.9, 20% v ⁄ v glycerol,
0.1 molỈL)1 KCl, 0.2 mmolỈL)1 EDTA pH 8.0, 0.5 mmolỈL)1
dithiothreitol and 0.5 mmolỈL)1 phenylmethanesulfonyl
fluoride. After stirring at 4 °C for 30 min, the nuclear
extracts were centrifuged for 20 min at 4 °C in a microcentrifuge. The supernatant was collected and stored at
)80 °C.
Proteins of mitochondria from NIT-1 cells were prepared as
described previously [18]. Briefly, the cells were collected and
lysed on ice for 30 min in buffer A containing 20 mmolỈL)1
Hepes ⁄ KOH pH 7.5, 10 mmolỈL)1 KCl, 1.5 mmolỈL)1
MgCl2, 1 mmolỈL)1 EGTA, 1 mmolỈL)1 EDTA pH 8.0,
1 mmolỈL)1 dithiothreitol, 0.1 mmolỈL)1 phenylmethanesulfonyl fluoride, 1 lgỈmL)1 aprotinin and 250 mmolỈL)1
sucrose. After consecutive centrifugations at 1000 g for
5 min and 10 000 g for 15 min, the pellet, which contained
the mitochondrial fraction, was resuspended in buffer A
and centrifuged at 100 000 g for 1 h. The supernatant was
collected and stored at )80 °C.
Western blot analysis
Cell lysates (10–30 lg protein) were separated by 10%
SDS ⁄ PAGE, transferred to poly(vinylidene difluoride)
membrane (Millipore, Billerica, MA, USA), blocked using
5% non-fat dry milk for 60 min, and probed with antibodies at 4 °C overnight. The blots were incubated with horseradish peroxidase-conjugated anti-IgG, followed by
detection using enhanced chemiluminescence (Santa Cruz
Biotechnology Inc., Santa Cruz, CA, USA). Antibodies
against p38, phosphorylated p38, JNK, phosphorylated
JNK, AKT, phosphorylated AKT, phosphorylated p53,
PTEN and phosphorylated PTEN were purchased from
Cell Signaling (CST, 3Track Lake Danvers, MA, USA).
Antibodies against NOX2, p67phox, p47phox, p22phox,
Rac1, I-jB, phosphorylated I-jB, ICAM-1, VCAM-1, bcl-2,
bax, cytochrome c, HSP70, p53, FOXO1, PDX-1, insulin
and b-actin were obtained from Santa Cruz.
Measurement of insulin secretion and cellular
insulin content
NIT-1 cells were washed using a modified Krebs ⁄ Ringer ⁄
bicarbonate ⁄ Hepes buffer (KRBH buffer: 140 mmolỈL)1
NaCl, 3.6 mmolỈL)1 KCl, 0.5 mmolỈL)1 NaH2PO4,
0.5 mmolỈL)1 MgSO4, 1.5 mmolỈL)1 CaCl2, 2 mmolỈL)1
NaHCO3, 10 mmolỈL)1 Hepes, 0.1% BSA, pH 7.4), and
pre-equilibrated using Dulbecco’s modified Eagle’s medium
containing 2.5 mmolỈL)1 glucose for 5 h at 37 °C. Cells
were then incubated for 35 min in KRBH buffer containing
2.5 mmolỈL)1 glucose (basal secretion) or KRBH buffer
containing 20 mmolỈL)1 glucose (glucose-stimulated insulin
FEBS Journal 277 (2010) 5061–5071 ª 2010 The Authors Journal compilation ª 2010 FEBS
5069
Glucose induces dysfunction of pancreatic cells
H. Yuan et al.
secretion). Supernatants were collected and frozen for insulin assays [19,20]. The content of insulin was assessed using
an ELISA kit (Linco, St. Charles, MO, USA) according to
the manufacturer’s protocol.
Statistical analysis
All values are represented as means ± SEM of the indicated
number of measurements. A one-way ANOVA test was used
to determine significance, with values of P < 0.05 indicating
statistical significance.
Acknowledgements
We would like to thank Professor Yi Zhu (Peking University Health Science Center, China) for providing
NIT-1 cells. This work was supported by grants from
the National Basic Research Program of China
(2006CB 503910), the National Natural Science Foundation of China (30572082) and the Natural Science
Foundation of Beijing (7052059).
References
1 Chen J, Saxena G, Mungrue IN, Lusis AJ & Shalev A
(2008) Thioredoxin-interacting protein: a critical link
between glucose toxicity and b-cell apoptosis. Diabetes
57, 938–944.
2 Poitout V & Robertson RP (2008) Glucolipotoxicity:
fuel excess and b-cell dysfunction. Endocr Rev 29,
351–366.
3 Newsholme P, Haber EP, Hirabara SM, Rebelato EL,
Procopio J, Morgan D, Oliveira-Emilio HC, Carpinelli
AR & Curi R (2007) Diabetes associated cell stress and
dysfunction: role of mitochondrial and non-mitochondrial ROS production and activity. J Physiol 583, 9–24.
4 Tang C, Han P, Oprescu AI, Lee SC, Gyulkhandanyan
AV, Chan GN, Wheeler MB & Giacca A (2007)
Evidence for a role of superoxide generation in glucoseinduced b-cell dysfunction in vivo. Diabetes 56,
2722–2731.
5 Bedard K & Krause KH (2007) The NOX family of
ROS-generating NADPH oxidases: physiology and
pathophysiology. Physiol Rev 87, 245–313.
6 Newsholme P, Morgan D, Rebelato E, Oliveira-Emilio
HC, Procopio J, Curi R & Carpinelli A (2009) Insights
into the critical role of NADPH oxidase(s) in the normal and dysregulated pancreatic beta cell. Diabetologia
52, 2489–2498.
7 Morgan D, Rebelato E, Abdulkader F, Graciano MFR,
Oliveira-Emilio HR, Hirata AE, Rocha MS, Bordin S,
Curi R & Carpinelli AR (2009) Association of
NAD(P)H oxidase with glucose-induced insulin secretion
by pancreatic b-cells. Endocrinology 150, 2197–2201.
5070
8 Song P, Wu Y, Xu J, Xie Z, Dong Y, Zhang M &
Zou MH (2007) Reactive nitrogen species induced by
hyperglycemia suppresses Akt signaling and triggers
apoptosis by upregulating phosphatase PTEN
(phosphatase and tensin homologue deleted on
chromosome 10) in an LKB1-dependent manner.
Circulation 116, 1585–1595.
9 Kawamori D, Kaneto H, Nakatani Y, Matsuoka TA,
Matsuhisa M, Hori M & Yamasaki Y (2006) The
forkhead transcription factor Foxo1 bridges the JNK
pathway and the transcription factor PDX-1 through its
intracellular translocation. J Biol Chem 281, 1091–1098.
10 Nishikawa T, Edelstein D, Du XL, Yamagishi S,
Matsumura T, Kaneda Y, Yorek MA, Beebe D,
Oates PJ, Hammes HP et al. (2000) Normalizing mitochondrial superoxide production blocks three pathways
of hyperglycaemic damage. Nature 404, 787–790.
11 Tiedge M, Lortz S, Drinkgern J & Lenzen S (1997)
Relation between antioxidant enzyme gene expression
and antioxidative defense status of insulin-producing
cells. Diabetes 46, 1733–1742.
12 Maedler K, Schulthess FT, Bielman C, Berney T,
Bonny C, Prentki M, Donath MY & Roduit R (2008)
Glucose and leptin induce apoptosis in human b-cells
and impair glucose-stimulated insulin secretion through
activation of c-Jun N-terminal kinases. FASEB J 22,
1905–1913.
13 Martinez SC, Tanabe K, Cras-Meneur C, Abumrad
NA, Bernal-Mizrachi E & Permutt MA (2008) Inhibition of Foxo1 protects pancreatic islet b-cells against
fatty acid and endoplasmic reticulum stress-induced
apoptosis. Diabetes 57, 846–859.
14 Hirosumi J, Tuncman G, Chang L, Gorgun CZ, Uysal
KT, Maeda K, Karin M & Hotamisligil GS (2002) A
central role for JNK in obesity and insulin resistance.
Nature 420, 333–336.
15 Kawamori D, Kajimoto Y, Kaneto H, Umayahara Y,
Fujitani Y, Miyatsuka T, Watada H, Leibiger IB,
Yamasaki Y & Hori M (2003) Oxidative stress induces
nucleo-cytoplasmic translocation of pancreatic
transcription factor PDX-1 through activation of c-Jun
NH2-terminal kinase. Diabetes 52, 2896–2904.
16 Glauser DA & Schlegel W (2007) The emerging role of
FOXO transcription factors in pancreatic b cells.
J Endocrinol 193, 195–207.
17 Nakae J, Biggs WH III, Kitamura T, Cavenee WK,
Wright CV, Arden KC & Accili D (2002) Regulation of
insulin action and pancreatic b-cell function by mutated
alleles of the gene encoding forkhead transcription
factor Foxo1. Nat Genet 32, 245–253.
18 Nijhawan D, Fang M, Traer E, Zhong Q, Gao W,
Du F & Wang X (2003) Elimination of Mcl-1 is
required for the initiation of apoptosis following
ultraviolet irradiation. Genes Dev 17, 1475–1486.
FEBS Journal 277 (2010) 5061–5071 ª 2010 The Authors Journal compilation ª 2010 FEBS
H. Yuan et al.
19 Wang H, Kouri G & Wollheim CB (2005) ER stress
and SREBP-1 activation are implicated in b-cell
glucolipotoxicity. J Cell Sci 118, 3905–3915.
20 Yang JY, Walicki J, Abderrahmani A, Cornu M,
Waeber G, Thorens B & Widmann C (2005) Expres-
Glucose induces dysfunction of pancreatic cells
sion of an uncleavable N-terminal RasGAP fragment
in insulin-secreting cells increases their resistance
toward apoptotic stimuli without affecting their
glucose-induced insulin secretion. J Biol Chem 280,
32835–32842.
FEBS Journal 277 (2010) 5061–5071 ª 2010 The Authors Journal compilation ª 2010 FEBS
5071