Cancer survival in five continents: a worldwide population-based study (CONCORD) ppt
Bạn đang xem bản rút gọn của tài liệu. Xem và tải ngay bản đầy đủ của tài liệu tại đây (1.3 MB, 27 trang )
www.thelancet.com/oncology Published online July 17, 2008 DOI:10.1016/S1470-2045(08)70179-7
1
Articles
Cancer survival in five continents: a worldwide
population-based study (CONCORD)
Michel P Coleman, Manuela Quaresma, Franco Berrino, Jean-Michel Lutz, Roberta De Angelis, Riccardo Capocaccia, Paolo Baili, Bernard Rachet,
Gemma Gatta, Timo Hakulinen, Andrea Micheli, Milena Sant, Hannah K Weir, J Mark Elwood, Hideaki Tsukuma, Sergio Koifman, Gulnar Azevedo e Silva,
Silvia Francisci, Mariano Santaquilani, Arduino Verdecchia, Hans H Storm, John L Young, and the CONCORD Working Group*
Summary
Background Cancer survival varies widely between countries. The CONCORD study provides survival estimates for
1·9 million adults (aged 15–99 years) diagnosed with a first, primary, invasive cancer of the breast (women), colon,
rectum, or prostate during 1990–94 and followed up to 1999, by use of individual tumour records from 101 population-
based cancer registries in 31 countries on five continents. This is, to our knowledge, the first worldwide analysis of
cancer survival, with standard quality-control procedures and identical analytic methods for all datasets.
Methods To compensate for wide international differences in general population (background) mortality by age, sex,
country, region, calendar period, and (in the USA) ethnic origin, we estimated relative survival, the ratio of survival
noted in the patients with cancer, and the survival that would have been expected had they been subject only to the
background mortality rates. 2800 life tables were constructed. Survival estimates were also adjusted for differences in
the age structure of populations of patients with cancer.
Findings Global variation in cancer survival was very wide. 5-year relative survival for breast, colorectal, and prostate
cancer was generally higher in North America, Australia, Japan, and northern, western, and southern Europe, and
lower in Algeria, Brazil, and eastern Europe. CONCORD has provided the first opportunity to estimate cancer survival
in 11 states in USA covered by the National Program of Cancer Registries (NPCR), and the study covers 42% of the US
population, four-fold more than previously available. Cancer survival in black men and women was systematically and
substantially lower than in white men and women in all 16 states and six metropolitan areas included. Relative survival
for all ethnicities combined was 2–4% lower in states covered by NPCR than in areas covered by the Surveillance
Epidemiology and End Results (SEER) Program. Age-standardised relative survival by use of the appropriate race-
specific and state-specific life tables was up to 2% lower for breast cancer and up to 5% lower for prostate cancer than
with the census-derived national life tables used by the SEER Program. These differences in population coverage and
analytical method have both contributed to the survival deficit noted between Europe and the USA, from which only
SEER data have been available until now.
Interpretation Until now, direct comparisons of cancer survival between high-income and low-income countries have
not generally been available. The information provided here might therefore be a useful stimulus for change. The
findings should eventually facilitate joint assessment of international trends in incidence, survival, and mortality as
indicators of cancer control.
Funding Centers for Disease Control and Prevention (Atlanta, GA, USA), Department of Health (London, UK), Cancer
Research UK (London, UK).
Introduction
International comparisons of population-based cancer
survival have been rare,
1–5
but large and unexplained differ-
ences in survival have been reported for many cancers
from individual studies and cancer registries in Europe and
North America.
6
For example, 5-year relative survival for
women diagnosed with breast cancer during 1985–89 was
73% in Europe (weighted mean for 17 countries)
7
and 84%
in the USA.
8
The CONCORD study provides a systematic
comparison of survival between Europe and North
America,
9–16
extended to countries in all other continents.
The first international comparison of cancer survival,
published in 1964,
17
was a study of patients diagnosed with
one of 15 common cancers in Denmark, England, Finland,
France, Norway, Sweden, and the USA, mainly during
1945–54. It was the first study in which relative survival
techniques, first described in the 1950s,
18–20
were used to
correct the survival estimates for differences in background
mortality between participant countries. The findings are
mainly of historical interest, but survival in the USA
(represented by Connecticut) was generally higher than in
the European countries.
Cancer survival is known to vary between the regions of
the USA covered by the US National Cancer Institute’s
(NCI) Surveillance, Epidemiology and End Results (SEER)
Program,
21
but the range of survival in Europe is much
wider. Furthermore, survival from breast cancer during
1985–94 was higher in each of the nine SEER areas than in
any of the 22 countries participating in the European study
of cancer survival (EUROCARE).
7,22
The differences were
Published Online
July 17, 2008
DOI:10.1016/S1470-
2045(08)70179-7
*Members of the CONCORD
Working Group are listed in the
webappendix
Cancer Research UK Cancer
Survival Group,
Non-Communicable Disease
Epidemiology Unit, London
School of Hygiene and Tropical
Medicine, London, UK
(Prof M P Coleman FFPH,
M Quaresma MSc, B Rachet MD);
Department of Preventive and
Predictive Medicine
(F Berrino MD, G Gatta MD,
M Sant MD), and Descriptive
Epidemiology and Health
Planning Unit (P Baili PhD,
A Micheli PhD), Fondazione
IRCCS Istituto Nazionale
Tumori, Milan, Italy; Geneva
Cancer Registry, Geneva,
Switzerland (J-M Lutz MD);
National Centre for
Epidemiology, Surveillance and
Health Promotion, Department
of Cancer Epidemiology,
Istituto Superiore di Sanità,
Rome, Italy (R De Angelis BSc,
R Capocaccia PhD,
S Francisci PhD,
M Santaquilani PhD,
A Verdecchia PhD); Finnish
Cancer Registry, Helsinki,
Finland (Prof T Hakulinen PhD);
Division of Cancer Prevention
and Control, Centers for
Disease Control and
Prevention, Atlanta, GA, USA
(H K Weir PhD); British
Columbia Cancer Agency,
Vancouver, BC, Canada
(Prof J M Elwood MD); Osaka
Cancer Registry, Department of
Cancer Control and Statistics,
Osaka Medical Centre for
Cancer and Cardiovascular
Diseases, Osaka, Japan
(H Tsukuma MD); Department
of Epidemiology, National
School of Public Health,
Oswaldo Cruz Foundation,
Ministry of Health, Rio de
Janeiro, Brazil (S Koifman PhD);
Institute of Social Medicine,
University of Rio de Janeiro,
Articles
2
www.thelancet.com/oncology Published online July 17, 2008 DOI:10.1016/S1470-2045(08)70179-7
often more marked in elderly patients:
9
for several cancers,
5-year survival for patients diagnosed aged 75 years or older
during the 1990s was nearly 20% higher in the USA than
in Europe.
23
The CONCORD study began in 1999 as an extension of
the EUROCARE-3 study, then just starting. EUROCARE has
published systematic comparisons of survival for most adult
and childhood cancers in Europe since 1995.
24
The first
EUROCARE study involved patients diagnosed in 1978–84
in 12 countries;
25
EUROCARE-2 covered patients diag-
nosed during 1985–89 in 17 countries,
26
and EUROCARE-3
involved 22 countries, with patients diagnosed in 1990–94
and followed up to 1999.
27,28
More recently, EUROCARE-4
has included patients diagnosed in 23 countries during all
or part of 1995–2002 and followed up to 2003.
29,30
CONCORD was originally designed to assess the survival
of adults (aged 15–99 years) diagnosed with cancer of the
breast (women), colorectum, or prostate during 1990–94 in
Europe and the USA, using population-based data and
standardised quality control, and with identical analysis for
all datasets, adjusted for differences in general population
(background) mortality by country, region, race, and calen-
dar period, and also for differences in the age structure of
patient populations. CONCORD also enables comparison
of cancer survival between five states and four metropolitan
areas in the USA covered by the SEER Program (SEER-9)
and 11 states covered by the Centers for Disease Control
and Prevention’s (CDC) National Program of Cancer
Registries (NPCR). It also provides a wider comparison of
cancer survival between black and white patients in the
USA than has previously been possible.
CONCORD includes data from one or more countries
on all five continents. To our knowledge, it is the first
attempt at a global comparison of cancer survival.
Methods
Cancer registries
In 1999, we identified at international cancer meetings in
Atlanta (USA) and Lisbon (Portugal), and from published
studies, population-based cancer registries that had pub-
lished survival data and were operational during 1990–99.
Registries that had met the quality criteria for inclusion in
Cancer Incidence in Five Continents (volume VII, 1988–92)
31
were eligible. We obtained data from 19 other registries.
Most had met comparable criteria, such as those in the
EUROCARE-3 study (patients diagnosed during 1990–94
with follow-up to 1999).
28
North American registries were
eligible if they had met the standards required for Cancer
Incidence in North America, 1991–95,
32
and could provide
complete follow-up to the end of 1999. In total, we identified
112 registries, but 11 were withdrawn or excluded: no re-
sponse (one); withdrawal for legal reasons (one); incom-
plete registration before 1995 (four); follow-up activity
stopped before 1999 (two); data not supplied by the
September, 2005 deadline (three).
A pilot study of 50 registries in 2000 obtained a 100%
response. All registries were able to provide data for
patients diagnosed during all or part of the period 1990–94,
and had access to various data sources to obtain follow-up
information for all patients for at least 5 years or to the end
of 1999. After further recruitment, a detailed questionnaire
was obtained for 100 of the 101 registries finally included in
the analyses, covering data definitions and methods of
operation, including data collection, coding of tumour site,
morphology, behaviour, and stage at diagnosis, tracing of
registered patients to ascertain their vital status, and
linkage between data on the incident tumour and data on
subsequent death or loss to follow-up. The procedures and
definitions used, the stated quality and completeness of
data on the registration of incident cancers, and of the
follow-up of those patients over the next 5 years, were
deemed adequate to attempt cancer-survival analysis,
subject to central quality control of the data. The pilot study
confirmed the feasibility of the CONCORD protocol
33
and
the active support of cancer registries for wider international
comparisons of cancer survival. The questionnaire and
detailed findings are available online.
34
Data sources
Anonymised individual tumour records were obtained from
population-based cancer registries in all five continents, as
defined on UN guidelines:
35
Africa, America (Central and
South, including the Caribbean), America (North), Asia,
Europe, and Oceania (table 1 and webfigure 1). We retained
Hawaii (USA) with North America rather than Oceania.
Africa was represented by a single cancer registry, for the
wilaya (département, or state) of Sétif (Algeria).
Central and South America, including the Caribbean,
were represented by the national cancer registry of Cuba
and two regional registries in Brazil: the Goiânia (Goiás
state) registry is one of 20 registries in state capitals,
whereas the Campinas (São Paulo state) registry is the only
one in Brazil that is not in a state capital.
Data from North America include five of the seven
largest provinces in Canada (British Columbia, Manitoba,
Nova Scotia, Ontario, and Saskatchewan). Data for the USA
came from 22 registries covering 16 states (California,
Colorado, Connecticut, Florida, Hawaii, Idaho, Iowa, Louis-
iana, Michigan, Nebraska, New Jersey, New Mexico, New
York State, Rhode Island, Utah, and Wyoming) and six
metropolitan areas (Atlanta, GA, Los Angeles, CA, San
Francisco, CA, Detroit, MI, New York City, NY, and Seattle,
WA).
Population-based cancer registries in the USA receive
support from either or both of the two federal cancer-
surveillance programmes, the NCI’s SEER Program and
the CDC’s NPCR.
36
As of 1990, the SEER Program included
nine population-based cancer registries covering some
10% of the US population (SEER-9): the states of
Connecticut, Hawaii, Iowa, New Mexico, and Utah, and the
metropolitan areas of Atlanta, GA, Detroit, MI, San
Francisco, CA, and Seattle, WA. The Los Angeles cancer
registry became a SEER registry in 1992, but we opted to
retain it with the NPCR data, so that the SEER grouping
Rio de Janeiro, Brazil
(G Azevedo e Silva PhD);
Department of Cancer
Prevention and
Documentation, Danish Cancer
Society, Copenhagen, Denmark
(H H Storm MD); Metropolitan
Atlanta SEER Registr y, Georgia
Center for Cancer Statistics,
Department of Epidemiology,
Rollins School of Public Health
at Emory University, Atlanta,
GA, USA (Prof J L Young PhD)
Correspondence to:
Prof Michel P Coleman,
Cancer Research UK Cancer
Survival Group, Non-
Communicable Disease
Epidemiology Unit, London
School of Hygiene and Tropical
Medicine, London WC1E 7HT, UK
See Online for webfigure 1
Articles
www.thelancet.com/oncology Published online July 17, 2008 DOI:10.1016/S1470-2045(08)70179-7
3
we used was identical with that for which SEER data had
been published in the past (SEER-9). The NPCR at the
CDC began more recently, and this is the first cancer-
survival analysis for 11 states: California, Colorado, Florida,
Idaho, Louisiana, Michigan, Nebraska, New Jersey, New
York, Rhode Island, and Wyoming.
Population
covered by
registry
% of
national
population
Breast Colon Rectum Colorectum Prostate Total
Women Men Women Men Women Men Women
Africa
Algeria (Sétif) 1 104 561 4·2 180 10 14 30 30 40 44 36 300
America (Central and South)
Brazilian registries 1 795 387 1·2 806 130 194 50 69 180 263 474 1723
Campinas 870 380 0·6 175 61 82 149 467
Goiânia 925 007 0·6 631 69 112 50 69 119 181 325 1256
Cuba 10 754 868 100·0 6461 1083 1516 674 734 1757 2250 4341 14 809
South American
registries
12 550 255 ·· 7267 1213 1710 724 803 1937 2513 4815 16 532
America (North)
Canadian registries 16 474 543 58·1 44 620 13 989 13 819 6272 4220 20 261 18 039 45 999 128 919
British Columbia 3 131 700 11·0 9141 2223 2178 625 412 2848 2590 11 496 26 075
Manitoba 1 109 998 3·9 2932 954 957 556 343 1510 1300 3761 9503
Nova Scotia 918 000 3·2 2316 771 829 ·· ·· ·· ·· 2243 6159
Ontario 10 298 801 36·3 27 389 9214 9069 4613 3154 13 827 12 223 25 310 78 749
Saskatchewan 1 016 044 3·6 2842 827 786 478 311 1305 1097 3189 8433
US registries 108 775 729 42·4 324 551 89 673 96 186 40 149 32 774 129 822 128 960 356 881 940 214
Atlanta,† GA 2 315 961 0·9 5747 1215 1473 474 496 1689 1969 6406 15 811
California 30 974 659 12·1 85 143 21 384 22 351 9999 8172 31 383 30 523 95 707 242 756
Los Angeles, CA 9 055 424 ·· 22 587 5741 6136 2659 2233 8400 8369 25 789 65 145
San Francisco, CA 3 805 588 ·· 12 321 3165 3375 1463 1194 4628 4569 12 733 34 251
Colorado 3 495 939 1·4 9117 2084 2183 944 751 3028 2934 11 433 26 512
Connecticut 3 300 712 1·3 11 335 3112 3299 1458 1128 4570 4427 11 357 31 689
Florida 13 650 553 5·3 46 065 14 845 15 007 6007 4790 20 852 19 797 64 256 150 970
Hawaii 1 158 613 0·5 2857 986 808 508 279 1494 1087 3482 8920
Idaho 1 071 685 0·4 2689 676 681 331 239 1007 920 3899 8515
Iowa 2 818 401 1·1 9133 2776 3532 1267 989 4043 4521 10 743 28 440
Louisiana 4 293 003 1·7 11 204 3302 3780 1374 1186 4676 4966 13 059 33 905
Michigan 9 479 065 3·7 31 183 8821 9323 3791 3162 12 612 12 485 23 705 79 985
Detroit, MI 3 969 304 ·· 12 247 3223 3534 1499 1213 4722 4747 17 162 38 878
Nebraska 1 611 687 0·6 5242 1625 1801 776 544 2401 2345 6828 16 816
New Jersey 7 880 508 3·1 27 125 8110 8670 3694 3091 11 804 11 761 29 877 80 567
New Mexico 1 595 442 0·6 3796 901 892 436 323 1337 1215 5393 11 741
New York State 18 246 653 7·1 55 404 15 191 17 426 6936 5889 22 127 23 315 47 096 147 942
New York City 7 322 564 ·· 21 644 5821 7048 2335 2253 8156 9301 16 770 55 871
Rhode Island 1 012 581 0·4 3466 1113 1280 477 440 1590 1720 3449 10 225
Seattle,† WA 3 567 217 1·4 10 451 2415 2577 1168 893 3583 3470 12 818 30 322
Utah 1 836 799 0·7 3506 866 805 393 293 1259 1098 5779 11 642
Wyoming 466 251 0·2 1088 251 298 116 109 367 407 1594 3456
North American
registries
125 250 272 44·0 369 171 103 662 110 005 46 421 36 994 150 083 146 999 402 880 1 069 133
Asia
Japanese registries 10 819 997 8·7 7179 5469 4588 3510 2248 8979 6836 1691 24 685
Fukui 827 000 0·7 840 738 709 477 310 1215 1019 325 3399
Osaka 8 734 516 7·0 5112 3337 2593 2075 1283 5412 3876 920 15 320
Yamagata 1 258 481 1·0 1227 1394 1286 958 655 2352 1941 446 5966
(Continues on next page)
Articles
4
www.thelancet.com/oncology Published online July 17, 2008 DOI:10.1016/S1470-2045(08)70179-7
Population
covered by
registry
% of
national
population
Breast Colon Rectum Colorectum Prostate Total
Women Men Women Men Women Men Women
(Continued from previous page)
Europe
Austria (Tirol) 624 939 8·0 1559 416 483 261 237 677 720 1432 4388
Czech Republic ( West
Bohemia)
861 000 8·3 1543 672 601 681 416 1353 1017 693 4606
Denmark 5 145 160 100·0 14 686 3954 4822 3308 2495 7262 7317 6503 35 768
Estonia 1 562 468 100·0 2205 598 845 479 553 1077 1398 1143 5823
Finland 5 070 000 100·0 12 214 1907 2639 1687 1561 3594 4200 7544 27 552
French registries 3 098 526 5·6 6359 1675 1544 1164 876 2839 2420 2909 14 527
Bas-Rhin 954 710 1·8 2591 848 730 522 379 1370 1109 1626 6696
Calvados 618 353 1·1 1640 440 448 345 309 785 757 1283 4465
Côte d’Or 507 147 0·9 791 387 366 297 188 684 554 2029
Isère 1 018 316 1·8 1337 ·· 1337
Germany (Saarland) 1 067 027 1·3 2957 1035 1237 712 656 1747 1893 1610 8207
Iceland 254 960 100·0 504 125 128 37 47 162 175 493 1334
Ireland 3 609 000 100·0 1513 587 534 382 224 969 758 1062 4302
Italian registries 8 944 772 15·3 26 403 8713 8672 4743 3887 13 456 12 559 10 671 63 089
Ferrara 355 479 0·6 1321 488 486 200 158 688 644 438 3091
Genoa 695 981 1·3 2571 892 894 442 380 1334 1274 1122 6301
Latina 468 865 0·8 657 199 182 135 84 334 266 197 1454
Macerata 281 537 0·5 629 296 283 168 119 464 402 435 1930
Modena 602 570 0·5 1887 641 654 361 275 1002 929 810 4628
Parma 391 237 0·7 1318 480 410 256 204 736 614 456 3124
Ragusa 140 537 0·5 513 159 171 123 82 282 253 227 1275
Romagna 604 488 0·8 1347 498 549 226 226 724 775 740 3586
Sassari 469 570 0·8 591 143 128 126 62 269 190 198 1248
Turin 996 443 1·8 3009 868 904 500 457 1368 1361 1030 6768
Tuscany 1 167 687 2·1 3807 1420 1446 854 702 2274 2148 1797 10 026
Varese 793 378 1·4 2400 691 710 410 344 1101 1054 803 5358
Veneto 1 977 000 3·5 6 353 1938 1855 942 794 2880 2649 2418 14 300
Malta 365 000 100·0 359 76 73 53 31 129 104 111 703
Netherlands registries 5 158 472 34·3 15 862 2418 2791 1471 1271 3889 4062 5353 29 166
Amsterdam 2 620 000 17·4 7509 1764 2117 1020 946 2784 3063 4171 17 527
Netherlands (North) 1 602 661 10·6 5999 ·· ·· 5999
Netherlands (South) 935 811 6·3 2354 654 674 451 325 1105 999 1182 5640
Norway 4 245 180 100·0 9193 3590 4136 2536 2048 6126 6184 9841 31 344
Polish registries 2 373 190 6·1 4220 1080 1152 827 773 1907 1925 1159 9211
Cracow 747 985 1·9 1205 240 243 203 168 443 411 253 2312
Warsaw 1 625 205 4·2 3015 840 909 624 605 1464 1514 906 6899
Portugal (South) 1 145 000 11·4 1219 364 355 327 236 691 591 344 2845
Slovakia 5 297 774 100·0 6079 2572 2126 2646 1815 5218 3941 2821 18 059
Slovenia 2 072 000 100·0 3327 914 898 1025 851 1939 1749 160 8175
Spanish registries 5 566 140 14·4 9744 3439 2934 2502 1613 5941 4547 4273 24 505
Basque Country 2 097 000 5·4 3816 1321 1027 1057 589 2378 1616 1721 9531
Granada 787 898 2·0 879 299 255 219 152 518 407 1804
Mallorca 582 655 1·5 1143 447 394 296 213 743 607 617 3110
Murcia 1 036 966 2·8 1485 505 512 397 330 902 842 643 3872
Navarra 520 300 1·3 1229 404 304 249 167 653 471 688 3041
Tarragona 541 321 1·4 1192 463 442 284 162 747 604 604 3147
(Continues on next page)
Articles
www.thelancet.com/oncology Published online July 17, 2008 DOI:10.1016/S1470-2045(08)70179-7
5
Survival estimates reported from the SEER Program
have until now been the only population-based cancer
survival data from the USA.
21,37
We wanted to compare
survival between the areas covered by registries in the
NPCR and the SEER Program during 1990–94. We received
separate datasets from Detroit, MI, San Francisco, CA
(SEER registries), and Los Angeles, CA (NPCR), and these
were included in the respective totals for SEER and NPCR.
However, the data from these metropolitan areas could not
be separately identified in the state-wide datasets we
received from California and Michigan, therefore, the non-
metropolitan data for those states could not be included
with the other NPCR data. Data from all nine SEER
registries were available.
38
Survival in the SEER-9 areas was therefore compared with
survival in nine states and one metropolitan area covered by
Population
covered by
registry
% of
national
population
Breast Colon Rectum Colorectum Prostate Total
Women Men Women Men Women Men Women
(Continued from previous page)
Sweden 8 826 939 100·0 24 170 6112 6685 4401 3578 10 513 10 263 24 041 68 987
Swiss registries 1 758 249 25·8 4847 ·· ·· 4847
Basel 429 104 6·3 1365 ·· ·· 1365
Geneva 381 492 5·6 1275 ·· ·· 1275
Graubunden-Glarus 210 485 3·1 544 ·· ·· 544
St Gallen-Appenzell 483 801 7·1 1 027 ·· ·· 1027
Valais 253 367 3·7 636 ·· ·· 636
UK 58 984 046 ·· 154 867 41 499 45 729 30 600 22 556 72 099 68 285 78 608 373 859
England (national) 49 310 000 100·0 129 703 33 983 37 334 25 618 18 780 59 601 56 114 66 181 311 599
East Anglia 2 089 000 4·2 6330 1820 2060 1245 954 3065 3014 3897 16 306
Mersey 2 412 000 4·9 6561 1932 2080 1425 1069 3357 3149 3242 16 309
Oxford 2 582 000 5·2 7458 1737 1934 1193 929 2930 2863 3612 16 863
South Thames 6 756 000 13·7 17 002 3880 4689 2824 2328 6704 7017 8232 38 955
South West 3 320 000 6·7 19 203 5630 6215 3869 2917 9499 9132 11 766 49 600
Trent 4 745 000 9·6 13 360 3523 3793 3045 2087 6568 5880 6774 32 582
West Midlands 5 278 000 10·7 13 561 4397 4482 3272 2066 7669 6548 7315 35 093
Yorkshire 3 698 000 7·5 9 473 2599 2910 2121 1574 4720 4484 5165 23 842
English registries 30 880 000 62·5 92 948 25 518 28 163 18 994 13 924 44 512 42 087 50 003 229 550
Northern Ireland 1 648 960 100·0 1527 562 576 328 224 890 800 888 4105
Scotland 5 100 086 100·0 14 254 4441 5089 2671 2124 7112 7213 6855 35 434
Wales 2 925 000 100·0 9383 2513 2730 1983 1428 4496 4158 4684 22 721
European registries 126 029 842 ·· 303 830 81 746 88 384 59 842 45 724 141 588 134 108 161 771 741 297
Oceania
Australia 18 071 422 100·0 41 090 15 200 15 098 9911 6904 25 111 22 002 42 890 131 093
Australian Capital
Territory
304 371 1·7 548 180 160 99 78 279 238 414 1479
New South Wales 6 133 913 33·9 14 382 5358 5066 3478 2354 8836 7420 15 507 46 145
Northern Territory 178 062 1·0 165 46 41 41 20 87 61 78 391
Queensland 3 252 245 18·0 7052 2783 2743 1619 998 4402 3741 7468 22 663
Southern Australia 1 473 966 8·2 3688 1323 1335 937 734 2260 2069 4228 12 245
Tasmania 472 971 2·6 1081 474 453 242 171 716 624 1321 3742
Victoria 4 521 392 25·0 10 583 3865 4103 2683 1978 6548 6081 9826 33 038
Western Australia 1 734 502 9·6 3591 1171 1197 812 571 1983 1768 4048 11 390
CONCORD
CONCORD total 293 826 349 ·· 728 717 207 300 219 799 120 438 92 703 327 738 312 502 614 083 1 983 040
*Some registries provided data for shorter periods, ie, 4 years: Campinas, Macerata, Granada (1991–94); 3 years: Isère (1990–92) , Portugal (1991–93), Sétif , Sassari
(1992–94); 2 years: Malta, Northern Ireland (1993–94); 1 year: Ireland (1994). †No state-wide data available for this city. Where a registry did not provide data for a given
cancer, cell entries for numbers of patients and survival estimates are left blank. National percentages are derived from the raw data and can differ from the sum of regional
percentages because of rounding. Row totals avoid double counting of colon and rectal tumours, also shown in the table as colon and rectum combined.
Table 1: Population coverage and number of adults (aged 15–99 years) diagnosed with cancer of the breast, colon, rectum, or prostate during
1990–94* and included in the analyses: continent, country, and region
Articles
6
www.thelancet.com/oncology Published online July 17, 2008 DOI:10.1016/S1470-2045(08)70179-7
NPCR: Colorado, Florida, Idaho, Los Angeles, CA, Louis-
iana, Nebraska, New Jersey, New York, Rhode Island, and
Wyoming. For this comparison, data from the non-metro-
politan areas of California and Michigan were excluded to
ensure that the two sets of data were mutually exclusive.
In Asia, Japan was represented by three of the prefectural
(state) registries: Fukui, Osaka, and Yamagata.
In Europe, the 53 cancer registries that contributed data
to EUROCARE-3
28
on cancers of the breast, colon, rectum,
or prostate all participated in the CONCORD study. Six
other registries also provided data: two national registries
(Northern Ireland and Ireland) and four regional registries
from the Netherlands (North) and Switzerland (Grau-
bunden-Glarus, St Gallen-Appenzell, Valais). As in the
EUROCARE study, the UK is considered as its four con-
stituent countries (England, Scotland, Wales, Northern
Ireland), each of which has a national registry. In England,
both the national cancer registry and eight of the regional
cancer registries submitted datasets.
Oceania was represented by the national cancer registry
of Australia, with data from each of the eight population-
based state or territorial registries.
Quality control
Procedures used in the EUROCARE-3 study were applied
to all datasets. Tumour records were supplied with the ana-
tomical site coded to the ninth revision of the International
Classification of Diseases (ICD-9
39
) for four index tumours:
cancers of the breast (women) (ICD-9 174.0–174.9), colon
(153.0–153.9), rectum (including the anus, 154.0–154.9),
and prostate (185). Tumour morphology and behaviour
were coded to the first or second revision of ICD-Oncology
(ICD-O,
40
ICD-O-2
41
). Only invasive malignant tumours
(behaviour code 3) were included. Patients with an index
tumour had sometimes been registered with another
malignancy, either before or after the index tumour. Data
on those other cancers in index patients were also sub-
mitted. Only the first, primary, invasive, malignant tumour
diagnosed in each patient was retained for analysis.
Patients registered with a malignant neoplasm before the
index tumour were excluded, although non-melanoma
skin cancer was not counted as a previous tumour for this
purpose. Bilateral breast cancers and multiple colon
cancers were included as a single tumour if synchronous;
otherwise, only the earliest tumour was considered. The
duration of survival was taken from the date of diagnosis
of the index tumour until death from any cause, or until
the patient was censored from the analysis as alive, either
at loss to follow-up or after Dec 31, 1999, whichever came
first; any subsequent tumour occurring in the same patient
during that period was ignored.
Standard quality-control routines, based on those devel-
oped by the International Agency for Research on Cancer,
42
were applied to each tumour record. Records with invalid
codes, impossible sequences of dates, or improbable com-
binations of tumour site and morphology were returned to
the registry for checking. Usually, the registry provided a
correction or an explanation. Corrected tumour records
were checked again: those which still had missing, invalid
or inconsistent values for sex, site, morphology, or dates
were flagged as major errors and excluded from analysis.
Records for which an unlikely combination of age, site and
morphology had nonetheless been confirmed as correct
were flagged as minor errors, and included in the analyses.
Details of the approach have been published elsewhere.
43
Detailed quality-control findings are available online.
34
Follow-up
All registries used more than one mechanism of follow-up
to ascertain the vital status (alive, dead, emigrated, lost to
follow-up) and the date of the last vital status for each
registered patient. The mechanisms varied between
countries, usually linkage between the registry’s database
and a variety of other data sources, especially the national
index of deaths. Secure linkage of a tumour record and a
record of death, based on a set of identifiers such as name,
sex, date of birth, and personal identity number, enabled
the registry to update the tumour record accordingly. Direct
contact with the patient or their family to establish vital
status was unusual, although home visits by registry staff
were done in Algeria. Enquiries to the patient’s primary
care physician or hospital consultant were frequently used.
A wide variety of administrative databases was also used,
such as social insurance, health insurance, motor vehicle
records, drivers’ licences, hospital discharge records,
national primary-care databases, electoral registers (those
eligible to vote), and voter registration records (those who
voted in the last election). The presence of a person’s record
in such administrative databases on a given date is taken
as evidence that the person was alive on that date. This is
subject to administrative error (failure to remove in timely
fashion the record of a person known to be dead) and fraud
(by someone seeking to retain access to benefits received
by the deceased), but in most instances the risks are small.
If coverage of the databases was known to be high, and
especially if a person was present in more than one such
database, the risk of error decreased further.
In the USA, a match to an administrative database might
show that an event occurred during a certain quarter of a year
(eg, an insurance claim paid, a licence renewed), but the
exact date might not be known; the date of last vital status
was then set to the first day of the quarter, ie, Jan 1, April 1,
July 1, Sept 1. This approach can give rise to irregular distri-
butions of the day of last known vital status, but it is a
conservative approach to establishing when patients were
last known to be alive, because patients are censored from
survival analysis on the latest of any such dates in the
record.
The proportion of patients not known to be dead and for
whom the registry could not be certain that the date of last
vital status was at least 5 years after diagnosis was less than
1% overall. The proportion was often zero (follow-up for at
least 5 years was established for every patient not known to
be dead), the highest proportion was 4%, and only in a
Articles
www.thelancet.com/oncology Published online July 17, 2008 DOI:10.1016/S1470-2045(08)70179-7
7
Breast Colon Rectum Colorectum Prostate
Women RS (%)
(95% CI)
Men RS (%)
(95% CI)
Women RS (%)
(95% CI)
Men RS (%)
(95% CI)
Women RS (%)
(95% CI)
Men RS (%)
(95% CI)
Women RS (%)
(95% CI)
RS (%) (95% CI)
Africa
Algeria (Sétif) 38·8 (31·4–46·2) R 11·4 (0·7–40·9) R 30·6 (9·5–56·1) R 25·9 (11·4–43·7) R 18·2 (6·6–34·6) R 22·5 (10·6–37·7) R 22·6 (11·2–36·7) R 21·4 (8·7–38·9) R
America (Central and South)
Brazilian registries 58·4 (52·7–64·6) 33·1 (24·2–45·3) 32·7 (26·1–40·8) 49·3 (34·8–69·8) 38·4 (27·3–53·9) 47·3 (37·5–59·6) 43·5 (35·7–53·1) 49·3 (43·6–55·8)
Campinas 36·6 (27·8–48·3) 23·8 (13·1–36·8) R 21·4 (12·6–31·9) R 34·4 (25·2–47·0)
Goiânia 65·4 (58·3–73·2) 48·1 (36·7–63·1) 44·8 (35·2–56·9) 49·3 (34·8–69·8) 38·4 (27·3–53·9) 47·3 (37·5–59·6) 43·5 (35·7–53·1) 55·7 (49·0–63·3)
Cuba 84·0 (82·9–85·2) 59·3 (55·8–63·1) 61·4 (58·3–64·5) 59·2 (55·1–63·7) 62·8 (58·6–67·4) 59·5 (56·8–62·5) 62·0 (59·5–64·6) 69·7 (67·1–72·3)
America (North)
North American
registries
83·7 (83·5–83·9) 59·5 (59·1–59·9) 59·9 (59·5–60·3) 56·4 (55·8–56·9) 59·7 (59·1–60·3) 58·6 (58·3–58·9) 60·0 (59·7–60·3) 91·1 (90·9–91·3)
Canadian registries 82·5 (81·9–83·0) 56·1 (55·1–57·2) 58·7 (57·7–59·7) 53·1 (51·5–54·6) 58·7 (57·0–60·4) 55·3 (54·4–56·2) 58·9 (58·0–59·8) 85·1 (84·4–85·7)
British Columbia 85·4 (84·2–86·5) 57·0 (54·5–59·6) 59·2 (56·8–61·7) 64·6 (59·9–69·7) 62·8 (57·5–68·6) 58·7 (56·4–61·0) 59·9 (57·7–62·2) 89·3 (88·1–90·5)
Manitoba 82·9 (80·9–85·0) 57·4 (53·4–61·6) 59·8 (56·1–63·8) 54·6 (49·6–60·1) 58·1 (52·3–64·6) 56·4 (53·3–59·7) 59·5 (56·4–62·8) 87·5 (85·5–89·6)
Nova Scotia 79·3 (77·0–81·8) 54·3 (50·0–58·9) 58·2 (54·3–62·4) 84·7 (81·8–87·6)
Ontario 81·6 (80·9–82·3) 56·0 (54·8–57·3) 58·5 (57·3–59·7) 51·1 (49·3–52·9) 57·8 (55·8–59·8) 54·5 (53·5–55·6) 58·6 (57·5–59·6) 83·4 (82·5–84·3)
Saskatchewan 82·8 (80·8–84·8) 55·4 (51·3–59·7) 58·0 (53·9–62·4) 54·8 (49·6–60·6) 61·1 (55·1–67·7) 55·2 (52·0–58·6) 59·1 (55·6–62·7) 77·5 (74·4–80·8)
US registries 83·9 (83·7–84·1) 60·1 (59·6–60·5) 60·1 (59·7–60·5) 56·9 (56·3–57·5) 59·8 (59·2–60·4) 59·1 (58·8–59·5) 60·2 (59·8–60·5) 91·9 (91·7–92·1)
Atlanta,† GA 85·7 (84·0–87·4) 63·9 (60·2–67·7) 60·7 (57·8–63·7) 56·5 (50·9–62·7) 64·3 (59·4–69·7) 62·3 (59·3–65·6) 62·0 (59·4–64·7) 93·4 (91·8–94·9)
California 84·6 (84·3–85·0) 60·4 (59·5–61·2) 59·5 (58·7–60·3) 57·2 (56·0–58·5) 60·1 (58·8–61·4) 59·4 (58·7–60·1) 59·9 (59·2–60·5) 90·4 (90·0–90·8)
Los Angeles, CA 83·4 (82·6–84·2) 61·2 (59·6–62·9) 58·4 (56·9–60·0) 55·7 (53·3–58·1) 58·5 (56·1–61·0) 59·5 (58·1–60·8) 58·5 (57·2–59·8) 90·7 (89·9–91·5)
San Francisco, CA 86·2 (85·2–87·2) 59·2 (57·1–61·4) 59·9 (57·9–62·0) 56·5 (53·4–59·8) 60·3 (57·1–63·7) 58·4 (56·6–60·2) 60·2 (58·4–62·0) 89·5 (88·4–90·6)
Colorado 87·0 (85·8–88·2) 61·6 (59·0–64·4) 62·0 (59·5–64·6) 55·6 (51·7–59·8) 59·8 (55·9–64·0) 59·7 (57·5–62·0) 61·7 (59·6–63·8) 92·8 (91·6–93·9)
Connecticut 85·7 (84·7–86·7) 62·3 (60·1–64·7) 63·4 (61·3–65·6) 61·3 (58·1–64·6) 62·4 (59·1–65·8) 62·0 (60·2–63·9) 63·4 (61·6–65·2) 91·7 (90·5–93·0)
Florida 84·0 (83·5–84·5) 60·2 (59·2–61·3) 61·0 (60·0–62·0) 57·1 (55·5–58·7) 61·0 (59·4–62·6) 59·4 (58·5–60·2) 61·2 (60·3–62·1) 89·0 (88·4–89·5)
Hawaii 89·3 (87·3–91·4) 67·9 (64·2–71·8) 66·5 (62·6–70·6) 59·3 (54·2–64·8) 61·0 (54·7–68·0) 65·0 (61·9–68·1) 65·5 (62·2–69·0) 90·9 (88·7–93·2)
Idaho 86·3 (84·2–88·5) 61·4 (56·9–66·3) 63·4 (59·1–68·0) 66·9 (60·8–73·6) 60·0 (53·3–67·6) 63·6 (59·9–67·6) 62·8 (59·2–66·7) 91·7 (89·8–93·7)
Iowa 86·6 (85·5–87·7) 60·8 (58·4–63·3) 64·8 (62·7–67·0) 59·0 (55·6–62·6) 63·8 (60·2–67·6) 60·3 (58·3–62·3) 64·7 (62·9–66·6) 92·6 (91·4–93·8)
Louisiana 81·0 (79·9–82·2) 59·8 (57·5–62·1) 58·8 (56·8–60·7) 57·3 (53·9–60·9) 58·7 (55·5–62·1) 59·1 (57·3–61·1) 58·9 (57·2–60·6) 88·4 (87·2–89·6)
Michigan‡ 82·3 (81·7–83·0) 58·7 (57·4–60·1) 59·3 (58·0–60·5) 55·2 (53·2–57·2) 59·2 (57·2–61·3) 57·8 (56·7–58·9) 59·4 (58·4–60·5) 100·0 (99·8–100)
Detroit, MI 83·0 (82·0–84·1) 60·5 (58·3–62·8) 58·0 (56·0–60·1) 55·8 (52·6–59·1) 57·5 (54·2–60·9) 59·1 (57·3–61·0) 57·9 (56·2–59·6) 93·4 (92·4–94·4)
Nebraska 85·4 (84·0–86·9) 60·4 (57·3–63·7) 64·2 (61·4–67·2) 58·3 (54·0–63·0) 60·6 (56·0–65·7) 59·8 (57·3–62·5) 63·6 (61·1–66·1) 92·8 (91·3–94·4)
New Jersey 83·3 (82·6–84·0) 61·3 (59·9–62·7) 61·1 (59·8–62·5) 56·1 (54·0–58·2) 58·4 (56·3–60·5) 59·6 (58·4–60·8) 60·5 (59·4–61·6) 90·8 (90·1–91·6)
New Mexico 84·6 (82·7–86·4) 62·0 (58·1–66·2) 61·6 (57·8–65·7) 52·6 (47·2–58·7) 59·1 (53·0–65·8) 59·0 (55·7–62·4) 61·0 (57·8–64·4) 92·4 (90·7–94·1)
New York State 81·0 (80·5–81·5) 56·6 (55·6–57·7) 56·4 (55·5–57·4) 54·9 (53·4–56·4) 56·7 (55·2–58·2) 56·1 (55·3–57·0) 56·6 (55·8–57·4) 85·6 (85·0–86·2)
New York City 77·4 (76·6–78·2) 54·2 (52·6–55·9) 53·6 (52·1–55·1) 50·6 (48·2–53·2) 52·4 (50·0–54·9) 53·2 (51·8–54·5) 53·3 (52·1–54·6) 81·6 (80·5–82·7)
Rhode Island 84·6 (82·8–86·4) 64·7 (60·9–68·7) 63·5 (60·0–67·2) 60·1 (54·5–66·3) 59·9 (54·5–65·8) 63·3 (60·2–66·7) 62·8 (59·8–65·8) 90·8 (88·4–93·2)
Seattle,† WA 88·6 (87·5–89·7) 63·7 (61·3–66·2) 64·1 (61·9–66·5) 60·7 (57·2–64·4) 65·4 (61·9–69·2) 63·0 (60·9–65·1) 64·8 (62·9–66·8) 95·0 (94·0–96·0)
Utah 85·8 (84·0–87·7) 60·8 (56·8–65·1) 58·6 (54·5–63·0) 59·9 (54·2–66·2) 61·3 (55·0–68·2) 61·1 (57·8–64·6) 59·6 (56·2–63·3) 93·7 (92·2–95·2)
Wyoming 84·3 (80·9–87·8) 59·5 (52·5–67·4) 58·5 (52·2–65·6) 46·5 (37·3–57·9) 52·3 (42·7–64·0) 56·0 (50·1–62·5) 57·8 (52·4–63·7) 92·2 (89·3–95·3)
Asia
Japanese registries 81·6 (79·7–83·5) 63·0 (61·3–64·8) 57·1 (55·5–58·8) 58·2 (55·9–60·5) 57·6 (55·2–60·1) 61·1 (59·7–62·5) 57·3 (55·9–58·6) 50·4 (46·3–54·9)
Fukui 83·1 (78·3–88·2) 68·5 (64·2–73·0) 62·8 (58·8–67·0) 59·6 (54·1–65·7) 61·6 (56·0–67·8) 65·3 (61·8–68·9) 62·4 (59·1–65·9) 54·1 (46·6–61·6) R
Osaka 79·4 (77·1–81·9) 59·6 (57·3–62·0) 52·5 (50·4–54·7) 54·4 (51·3–57·7) 55·2 (51·9–58·7) 57·6 (55·7–59·5) 53·3 (51·5–55·2) 51·1 (46·1–56·6)
Yamagata 87·3 (83·4–91·4) 67·5 (64·3–70·8) 63·7 (60·7–66·8) 63·7 (59·8–67·9) 61·8 (57·6–66·3) 66·0 (63·5–68·5) 63·0 (60·5–65·5) 49·4 (43·2–55·6) R
Europe
European registries 73·1 (72·9–73·4) 46·8 (46·3–47·2) 48·4 (48·0–48·8) 43·2 (42·7–43·7) 47·4 (46·9–48·0) 45·3 (45·0–45·6) 48·1 (47·7–48·4) 57·1 (56·7–57·6)
Austria (Tirol) 74·9 (71·9–78·1) 57·0 (51·5–63·0) 59·3 (54·3–64·7) 45·8 (39·1–53·8) 45·2 (37·6–52·8) R 52·7 (48·2–57·6) 55·1 (50·8–59·7) 86·1 (82·9–89·4)
Czech Republic
(West Bohemia)
62·9 (58·9–67·1) 37·7 (33·0–43·0) 37·6 (33·3–42·5) 29·3 (25·2–34·1) 39·1 (33·8–45·2) 33·8 (30·5–37·6) 38·3 (34·9–42·0) 50·7 (44·4–58·0)
Denmark 73·6 (72·5–74·7) 44·7 (42·7–46·7) 48·6 (46·8–50·4) 43·4 (41·2–45·6) 45·9 (43·6–48·3) 44·2 (42·7–45·7) 47·7 (46·3–49·2) 38·4 (36·3–40·6)
Estonia 61·3 (57·9–64·8) 38·5 (33·7–44·1) 39·1 (35·3–43·2) 33·6 (28·4–39·7) 30·2 (26·0–35·1) 36·4 (32·8–40·4) 35·5 (32·6–38·6) 56·5 (52·3–60·9)
(Continues on next page)
Articles
8
www.thelancet.com/oncology Published online July 17, 2008 DOI:10.1016/S1470-2045(08)70179-7
Breast Colon Rectum Colorectum Prostate
Women RS (%)
(95% CI)
Men RS (%)
(95% CI)
Women RS (%)
(95% CI)
Men RS (%)
(95% CI)
Women RS (%)
(95% CI)
Men RS (%)
(95% CI)
Women RS (%)
(95% CI)
RS (%) (95% CI)
(Continued from previous page)
Finland 80·2 (79·0–81·4) 54·6 (51·6–57·8) 54·7 (52·5–57·1) 49·8 (46·8–53·0) 52·6 (49·7–55·6) 52·5 (50·4–54·7) 54·0 (52·2–55·8) 62·9 (60·6–65·2)
French registries 79·8 (78·2–81·4) 57·4 (54·4–60·7) 60·1 (57·2–63·2) 52·8 (49·3–56·7) 63·9 (60·1–67·8) 55·6 (53·3–58·1) 61·5 (59·2–64·0) 73·7 (70·5–77·1)
Bas-Rhin 82·2 (79·7–84·7) 57·8 (53·5–62·5) 62·7 (58·8–66·9) 57·9 (52·6–63·7) 61·7 (56·0–67·9) 57·8 (54·4–61·4) 63·0 (59·6–66·6) 73·8 (69·4–78·4)
Calvados 75·6 (72·5–78·8) 62·0 (56·0–68·5) 61·3 (56·0–67·1) 52·2 (45·6–59·8) 67·9 (62·0–74·5) 57·6 (53·1–62·5) 64·2 (60·1–68·5) 73·1 (68·4–78·2)
Côte d’Or 78·1 (74·1–82·3) 50·6 (44·6–57·5) 52·6 (46·7–59·4) 45·3 (38·8–53·0) 61·3 (53·3–70·5) 48·7 (44·1–53·7) 55·3 (50·5–60·6) ··
Isère 81·9 (78·6–85·2) ··
Germany
(Saarland)
75·5 (73·3–77·8) 52·0 (48·2–56·0) 56·2 (52·9–59·7) 47·8 (43·0–53·1) 52·5 (48·1–57·3) 50·1 (47·2–53·2) 55·0 (52·3–57·9) 76·4 (72·7–80·4)
Iceland 79·0 (73·5–85·0) 48·1 (39·0–59·3) 54·9 (45·2–66·6) 52·1 (31·9–71·4) R 48·4 (31·7–64·6) R 49·5 (41·0–59·9) 54·0 (45·9–63·6) 69·7 (62·2–78·1)
Ireland 69·6 (66·1–73·3) 49·1 (44·0–54·8) 48·5 (43·7–53·8) 41·1 (35·0–48·2) 52·5 (44·6–60·3) R 46·0 (42·0–50·4) 50·0 (45·9–54·5) 62·8 (58·0–68·0)
Italian registries 79·5 (78·8–80·3) 52·4 (51·1–53·8) 53·8 (52·6–55·0) 47·4 (45·7–49·2) 50·4 (48·6–52·3) 50·7 (49·7–51·8) 52·7 (51·7–53·8) 65·4 (63·7–67·2)
Ferrara 78·8 (75·6–82·2) 48·5 (43·2–54·5) 54·9 (49·8–60·5) 44·6 (37·1–53·6) 48·0 (40·5–57·0) 47·3 (42·8–52·2) 53·6 (49·2–58·4) 69·8 (63·2–76·0) R
Genoa 80·6 (78·3–83·0) 49·9 (45·9–54·2) 51·2 (47·5–55·3) 40·5 (35·2–46·6) 45·4 (40·0–51·5) 46·8 (43·5–50·3) 49·5 (46·3–52·9) 66·2 (61·0–71·9)
Latina 81·8 (76·4–87·5) 52·7 (45·3–61·3) 57·4 (49·9–65·9) 46·3 (36·3–56·2) R 45·1 (34·7–58·5) 51·2 (45·0–58·2) 53·3 (47·1–60·3) 61·0 (53·9–69·1)
Macerata 77·5 (73·0–82·4) 48·9 (42·8–55·9) 57·9 (51·7–65·0) 42·0 (34·1–51·8) 52·1 (41·2–62·6) R 46·7 (41·6–52·3) 56·8 (51·4–62·7) 69·7 (63·1–76·0) R
Modena 83·1 (80·4–85·8) 55·0 (50·5–59·9) 52·0 (47·7–56·5) 48·4 (42·5–55·1) 45·3 (39·0–52·5) 52·8 (49·2–56·7) 49·8 (46·2–53·7) 68·7 (61·7–76·6)
Parma 81·2 (78·1–84·4) 50·7 (45·6–56·4) 53·7 (48·3–59·7) 47·4 (39·9–54·9) R 41·6 (34·7–49·7) 49·8 (45·6–54·5) 49·3 (44·9–54·2) 56·1 (48·0–65·6)
Ragusa 68·9 (63·2–75·1) 39·5 (32·0–48·8) 44·0 (36·8–52·6) 50·3 (40·8–61·9) 37·8 (26·0–50·3) R 44·9 (38·7–52·1) 41·9 (35·9–48·9) 49·9 (41·0–58·9) R
Romagna 87·4 (84·4–90·4) 51·4 (46·2–57·1) 58·7 (54·0–63·8) 51·0 (42·9–59·0) R 57·9 (50·8–65·9) 50·9 (46·6–55·5) 58·4 (54·4–62·7) 73·3 (67·9–79·2)
Sassari 76·4 (71·3–81·9) 39·9 (31·2–51·0) 41·5 (32·0–51·0) R 44·5 (34·2–54·8) R 42·8 (31·5–58·0) 42·3 (35·8–50·1) 43·5 (36·5–51·8) 52·2 (42·8–61·5) R
Turin 79·4 (77·1–81·7) 50·1 (46·1–54·5) 51·4 (47·8–55·4) 43·7 (39·0–49·0) 54·0 (48·8–59·6) 47·8 (44·7–51·2) 52·4 (49·3–55·6) 63·2 (58·1–68·8)
Tuscany 80·8 (78·9–82·7) 55·6 (52·5–58·9) 54·4 (51·4–57·5) 50·8 (46·9–55·0) 48·7 (44·6–53·2) 53·8 (51·4–56·4) 52·5 (50·1–55·1) 66·4 (62·4–70·7)
Varese 77·6 (75·2–80·0) 55·3 (51·0–59·9) 55·1 (51·1–59·5) 52·4 (46·5–59·0) 53·4 (47·8–59·6) 54·5 (51·1–58·2) 54·5 (51·1–58·1) 72·2 (66·7–78·2)
Veneto 77·6 (76·2–79·1) 53·7 (50·9–56·7) 54·6 (52·0–57·3) 48·4 (44·6–52·5) 55·7 (51·7–60·0) 52·0 (49·8–54·4) 55·0 (52·8–57·2) 61·8 (58·5–65·3)
Malta 73·5 (66·7–81·1) 38·0 (25·9–50·7) R 58·0 (46·5–72·4) 34·7 (20·8–49·9) R 52·5 (31·9–71·4) R 35·7 (27·0–47·1) 55·5 (46·1–66·8) 44·3 (32·3–56·9) R
Netherlands
registries
77·6 (76·6–78·6) 52·7 (50·1–55·4) 55·4 (53·2–57·7) 55·0 (51·6–58·6) 54·5 (51·3–57·9) 53·6 (51·5–55·7) 55·1 (53·3–57·0) 69·5 (67·2–71·9)
Amsterdam 78·0 (76·5–79·4) 52·1 (49·1–55·2) 54·1 (51·6–56·7) 51·5 (47·6–55·7) 56·4 (52·7–60·3) 51·9 (49·5–54·3) 54·8 (52·7–57·0) 68·1 (65·4–70·8)
Netherlands
(North)
77·8 (76·2–79·4) ·· ·· ·· ··
Netherlands
(South)
75·7 (72·9–78·5) 54·2 (49·2–59·8) 59·4 (54·9–64·2) 62·1 (56·6–68·1) 49·2 (43·1–56·1) 58·0 (54·2–62·2) 56·1 (52·5–60·0) 74·9 (70·3–79·8)
Norway 76·3 (75·1–77·6) 50·8 (48·7–53·0) 54·4 (52·5–56·3) 51·3 (48·9–53·9) 56·9 (54·3–59·6) 51·1 (49·5–52·8) 55·3 (53·8–56·9) 63·0 (60·9–65·1)
Polish registries 62·9 (60·6–65·3) 28·5 (25·3–32·1) 30·9 (28·0–34·2) 28·4 (24·7–32·7) 30·2 (26·7–34·1) 28·6 (26·1–31·3) 30·6 (28·3–33·0) 37·1 (33·0–41·6)
Cracow 54·7 (50·6–59·1) 24·6 (18·8–32·1) 23·4 (17·9–30·7) 25·0 (18·9–33·3) 22·9 (16·8–31·1) 25·7 (21·5–30·8) 22·5 (18·3–27·6) 21·3 (15·2–29·9)
Warsaw 66·1 (63·4–68·9) 29·7 (26·1–33·9) 33·6 (30·3–37·4) 29·2 (24·9–34·2) 32·6 (28·6–37·3) 29·6 (26·8–32·7) 33·0 (30·3–35·8) 41·4 (36·5–46·8)
Portugal (South) 72·2 (68·2–76·5) 48·6 (42·6–55·4) 44·8 (39·1–51·3) 42·3 (35·5–50·4) 44·5 (37·8–52·4) 46·5 (41·8–51·8) 44·7 (40·2–49·7) 47·7 (40·7–54·8) R
Slovakia 57·9 (55·9–59·9) 40·1 (37·7–42·7) 44·1 (41·7–46·7) 27·6 (25·5–29·8) 32·3 (29·9–34·8) 34·0 (32·3–35·8) 38·7 (37·0–40·5) 45·7 (42·7–49·0)
Slovenia 66·3 (63·8–68·9) 37·3 (33·5–41·5) 39·8 (36·3–43·6) 34·0 (30·5–38·0) 35·6 (32·1–39·5) 35·7 (33·1–38·5) 37·7 (35·3–40·4) 43·7 (39·4–48·4)
Spanish registries 77·7 (76·4–79·0) 54·2 (52·2–56·3) 56·3 (54·2–58·4) 50·0 (47·7–52·4) 51·8 (49·1–54·6) 52·5 (51·0–54·1) 54·7 (53·1–56·4) 60·5 (57·6–63·6)
Basque Country 79·5 (77·6–81·5) 59·0 (55·8–62·3) 58·3 (55·0–61·8) 53·3 (49·6–57·3) 52·2 (47·8–56·9) 56·5 (54·1–59·0) 56·2 (53·5–58·9) 63·0 (58·8–67·4)
Granada 71·8 (67·0–77·0) 50·6 (44·3–57·8) 50·9 (44·5–58·2) 45·7 (38·1–54·8) 51·1 (43·0–60·8) 48·2 (43·3–53·7) 51·1 (46·0–56·8)
Mallorca 80·1 (77·2–83·2) 51·4 (46·4–57·1) 57·4 (52·2–63·0) 48·9 (42·5–56·2) 51·7 (44·5–59·9) 50·9 (46·9–55·3) 56·1 (51·8–60·7) 68·2 (60·7–76·6)
Murcia 72·8 (69·1–76·8) 49·7 (44·4–55·7) 54·8 (50·2–59·9) 49·2 (43·4–55·8) 47·8 (42·0–54·4) 49·7 (45·5–54·3) 52·3 (48·7–56·3) 52·0 (45·4–59·4)
Navarra 78·3 (74·9–81·8) 50·6 (45·1–56·8) 53·3 (46·8–60·8) 42·7 (36·4–50·1) 58·1 (49·1–66·5) R 47·7 (43·4–52·4) 55·6 (50·4–61·3) 54·6 (47·2–63·0)
Tarragona 76·4 (73·0–80·0) 49·2 (43·9–55·1) 52·8 (47·8–58·3) 50·1 (43·2–58·0) 49·8 (40·9–58·4) R 49·6 (45·4–54·3) 51·7 (47·4–56·4) 54·6 (46·3–64·3)
Sweden 82·0 (81·2–82·7) 52·5 (50·9–54·2) 54·8 (53·3–56·3) 53·0 (51·2–55·0) 58·2 (56·3–60·2) 52·8 (51·6–54·1) 56·2 (55·0–57·4) 66·0 (64·7–67·3)
Swiss registries 76·0 (74·3–77·7) ·· ·· ··
Basel 78·2 (75·1–81·4) ·· ·· ··
Geneva 79·1 (76·0–82·4) ·· ·· ··
(Continues on next page)
Articles
www.thelancet.com/oncology Published online July 17, 2008 DOI:10.1016/S1470-2045(08)70179-7
9
very few registries was it greater than 1% (available on-
line
34
). Such patients are described as censored from the
analysis.
Statistical analysis
We estimated relative survival up to 5 years after diagnosis
from the individual tumour data, using the Hakulinen
approach
44
embedded in the US National Cancer Institute’s
publicly accessible SEER*Stat software.
45
SEER*Stat is
the standard tool used for cancer-survival estimation by the
SEER Program cancer registries, and we used it to ensure
that survival estimates for US registries would be seen as
comparable with those already published by the SEER
Program. Survival estimates were also derived by race for
the USA (black and white).
Relative survival is the ratio of the survival noted in the
patients with cancer and the survival that would have been
expected had they been subject only to the mortality rates
of the general population (background mortality). It is a
measure of the excess mortality in patients with cancer
over and above the background mortality, and can be inter-
preted as survival from the cancer after correction for other
causes of death. This approach is crucial for international
comparisons of cancer survival, because the background
risks of death from all causes in adults often differ very
widely. Background mortality was taken from life tables
developed specially for the CONCORD study, specific for
sex, calendar year, region, and race.
46
The probability of survival in successive years after
diagnosis was estimated in survivors to the start of each
year. We report the cumulative relative survival at 5 years.
Survival was not estimated if fewer than five patients with
a given cancer were available for analysis in any category
defined by age, sex, and race. Relative survival was adjusted
Breast Colon Rectum Colorectum Prostate
Women RS (%)
(95% CI)
Men RS (%)
(95% CI)
Women RS (%)
(95% CI)
Men RS (%)
(95% CI)
Women RS (%)
(95% CI)
Men RS (%)
(95% CI)
Women RS (%)
(95% CI)
RS (%) (95% CI)
(Continued from previous page)
Graubunden-
Glarus
71·7 (66·8–77·0) ·· ·· ··
St Gallen-
Appenzell
71·7 (68·1–75·5) ·· ·· ··
Valais 75·3 (70·4–80·6) ·· .· ·· ··
UK 69·7 (69·4–70·1) 43·5 (42·9–44·1) 44·4 (43·8–45·0) 40·6 (39·9–41·3) 45·3 (44·5–46·1) 42·3 (41·8–42·8) 44·7 (44·3–45·2) 51·1 (50·4–51·8)
England (national) 69·8 (69·5–70·2) 43·4 (42·8–44·1) 44·3 (43·7–45·0) 40·4 (39·6–41·2) 45·4 (44·6–46·3) 42·2 (41·7–42·7) 44·7 (44·2–45·3) 50·9 (50·1–51·7)
East Anglia 70·8 (69·2–72·4) 43·6 (40·8–46·7) 42·9 (40·2–45·8) 46·0 (42·4–49·8) 49·8 (46·1–53·9) 44·6 (42·4–47·0) 45·2 (43·0–47·6) 51·9 (48·4–55·7)
Mersey 69·4 (67·8–71·1) 43·8 (41·0–46·9) 43·6 (41·0–46·4) 41·2 (38·1–44·5) 44·5 (41·0–48·2) 43·0 (40·9–45·1 ) 44·0 (41·8–46·2) 52·6 (49·3–56·1)
Oxford 71·1 (69·6–72·6) 44·8 (42·1–47·8) 45·0 (42·4–47·8) 43·1 (39·8–46·6) 45·6 (41·8–49·7) 44·3 (42·1–46·6) 45·3 (43·2–47·6) 50·4 (47·4–53·6)
South Thames 73·9 (73·0–74·9) 45·5 (43·6–47·6) 48·3 (46·5–50·2) 45·3 (43·0–47·8) 51·1 (48·6–53·6) 45·5 (44·0–47·1) 49·3 (47·9–50·8) 56·1 (54·0–58·2)
South West 73·4 (72·5–74·2) 51·5 (49·8–53·1) 51·6 (50·1–53·2) 48·6 (46·7–50·6) 52·0 (49·8–54·2) 50·3 (49·0–51·5) 51·8 (50·5–53·1) 55·8 (53·9–57·9)
Trent 68·2 (67·2–69·3) 40·3 (38·3–42·5) 42·2 (40·2–44·2) 39·3 (37·1–41·6) 43·8 (41·3–46·5) 39·8 (38·3–41·4) 42·9 (41·3–44·5) 47·0 (44·8–49·4)
West Midlands 75·4 (74·2–76·5) 48·0 (46·2–49·9) 48·4 (46·6–50·2) 44·4 (42·2–46·7) 46·9 (44·3–49·6) 46·6 (45·2–48·1) 48·0 (46·5–49·5) 55·4 (53·2–57·7)
Yorkshire 71·4 (70·1–72·8) 45·5 (43·1–48·1) 45·4 (43·1–47·8) 43·8 (41·1–46·7) 49·8 (46·8–53·0) 44·7 (42·9–46·6) 47·0 (45·1–48·9) 53·3 (50·5–56·4)
Northern Ireland 72·0 (68·9–75·3) 47·3 (42·1–53·0) 49·0 (44·3–54·3) 48·2 (41·6–55·8) 43·8 (37·0–51·9) 47·8 (43·7–52·3) 47·8 (43·8–52·2) 54·0 (48·7–59·9)
Scotland 70·6 (69·5–71·8) 45·9 (44·0–47·9) 47·8 (46·1–49·6) 42·3 (39·9–44·9) 46·9 (44·4–49·6) 44·6 (43·1–46·2) 47·7 (46·2–49·2) 54·2 (52·0–56·5)
Wales 67·1 (65·8–68·4) 39·9 (37·5–42·6) 38·0 (35·7–40·4) 39·5 (36·8–42·3) 41·9 (38·8–45·2) 39·8 (38·0–41·8) 39·3 (37·5–41·3) 47·9 (44·9–51·1)
Oceania
Australia (national) 80·7 (80·1–81·3) 57·8 (56·8–58·8) 57·7 (56·7–58·6) 54·8 (53·6–56·1) 59·2 (57·8–60·6) 56·7 (55·9–57·5) 58·2 (57·4–58·9) 77·4 (76·6–78·2)
Australian Capital
Territory
80·4 (74·3–87·0) 62·0 (53·8–71·5) 59·1 (51·2–68·2) 57·2 (45·5–68·1) R 61·3 (49·8–75·5) 56·5 (49·1–65·1) 59·8 (53·0–67·5) 78·7 (72·5–85·5)
New South Wales 80·4 (79·4–81·5) 60·8 (59·1–62·6) 58·2 (56·6–59·9) 56·9 (54·7–59·1) 59·6 (57·3–61·9) 59·3 (57·9–60·7) 58·7 (57·4–60·0) 78·3 (77·0–79·6)
Northern Territory 71·9 (58·7–88·0) 53·5 (36·3–69·4) R 51·7 (34·2–67·5) R 46·3 (28·9–63·4) R 66·5 (39·6–86·0) R 52·1 (38·6–70·5) 53·2 (39·9–70·9) 63·7 (49·0–77·0) R
Queensland 80·5 (79·0–82·0) 59·8 (57·5–62·3) 60·6 (58·6–62·8) 53·7 (50·7–56·9) 61·2 (57·7–64·8) 57·7 (55·8–59·6) 60·7 (58·9–62·5) 75·7 (73·9–77·6)
Southern Australia 80·0 (78·0–82·0) 56·3 (53·0–59·8) 58·6 (55·5–61·8) 55·2 (51·3–59·4) 59·2 (55·1–63·6) 55·8 (53·3–58·4) 58·6 (56·1–61·2) 77·1 (74·3–80·1)
Tasmania 77·1 (73·4–81·1) 52·4 (46·8–58·6) 50·0 (44·9–55·6) 44·9 (37·5–53·6) 55·0 (46·8–64·6) 50·2 (45·7–55·1) 51·8 (47·4–56·6) 70·2 (65·8–74·8)
Victoria 81·5 (80·4–82·7) 54·7 (52·7–56·7) 56·1 (54·3–57·9) 54·9 (52·5–57·4) 59·0 (56·5–61·6) 54·8 (53·3–56·4) 57·2 (55·7–58·6) 76·8 (75·2–78·4)
Western Australia 81·4 (79·3–83·5) 53·2 (49·7–56·9) 54·5 (51·4–57·8) 50·9 (46·8–55·3) 54·8 (50·3–59·7) 52·5 (49·8–55·3) 54·8 (52·1–57·5) 80·0 (77·7–82·3)
RS=relative survival. R=raw (not age-standardised) survival estimate: too few cases in one or more age groups. *International Cancer Survival Standard (see text). †No state-wide data available for this city.
‡Survival truncated if greater than 1·0 (100%). 95% CIs were calculated by use of a logarithmic transformation (see text).
Table 2: 5-year relative survival (%), age-standardised to ICSS weights* with 95% CIs for adults (aged 15–99 years) diagnosed with cancer of the breast (women), colon, rectum, or
prostate during 1990–94 and followed up to Dec 31, 1999: continent, country, and region
Articles
10
www.thelancet.com/oncology Published online July 17, 2008 DOI:10.1016/S1470-2045(08)70179-7
for heterogeneity in the withdrawal of patients from follow-
up and consequent changes in the age-sex-race distribution
of patients with cancer in successive calendar years, by use
of the exact method.
44
Expected survival was derived from complete life tables
that contained the probabilities of death or the central
death rates for the general population of the registry’s
territory, by single year of age, sex and (where possible)
race, and single calendar year between 1990 and 1999.
Many registries provided complete life tables. For some
registries, complete life tables were constructed from
raw data obtained from published sources on the
numbers of deaths by age, sex, and race in the relevant
year(s) or period, and the corresponding populations.
For the remaining registries, abridged (5-year or 10-year
age groups) life tables from published sources were
smoothed to produce complete life tables. In some
registries, life tables were interpolated, as required, to
provide life tables by single calendar year throughout the
decade 1990–99. Details are provided in an accompanying
paper.
46
Cancer survival is known to vary with race,
47–55
and we
assessed racial differences in survival where possible.
Individual tumour records were coded by race only in the
data from the USA (black, white, other). Race-specific
estimates of relative survival were produced with separate
life tables for each race, constructed from the raw data on
populations and the number of deaths.
46
In the USA, race-specific mortality in the general
population also varies between states.
36
We developed
separate sets of complete life tables for each state and
metropolitan area and for each sex. This approach was
designed to enable the closest possible adjustment of
relative survival estimates in the USA for geographic
variation in background mortality in both blacks and
whites, by age, sex, and calendar period. Race-specific life
tables for both blacks and whites were developed for 11 of
the 16 states and all six metropolitan areas. Where race-
specific life tables were available, they were used in the
estimation of relative survival for patients of that race. For
other patients, the all-races life table for that population
was used. For five less populous states (Hawaii, Idaho,
New Mexico, Utah, and Wyoming: 6% of the 109 million
population covered by participating registries; webtable),
only the life tables for whites were sufficiently robust, and
relative survival estimates for blacks are not separately
presented.
Relative survival measures the extent to which patients
with cancer have a higher death rate than the general
population of the country or region in which they live.
56
Occasionally, despite use of the most appropriate life table,
this excess death rate can be negative in a given time
interval since diagnosis, implying that the death rate of
cancer survivors during that interval is actually lower than
that of the general population. This situation can arise
from random variation in the death rate when the number
of deaths in the interval is small,
57
either because the
interval is very short, or because survival is poor and most
patients have already died before the start of the interval, or
because survival is high and there are very few deaths. In
such situations, we present by default the estimate derived
by use of the SEER*Stat option to constrain the excess
mortality rate to zero, which imposes a plateau in the
relative survival curve. The unconstrained estimate was
also obtained for comparison.
Even though relative survival is already adjusted for age-
specific differences in background mortality, robust
international comparison of relative survival requires age-
standardisation,
23
because the age distribution of patients
with cancer varies between countries, and because relative
survival also varies widely by age, at least in Europe.
27
Conventional age-specific weights used to standardise
incidence or mortality rates (eg, the national population or
the hypothetical world standard population
58
) are unsuitable
because patients with cancer have a very different age
profile from that of the general population.
A cancer-survival comparison of such wide scope has not
been done before and the choice of weights for age-
standardisation was not straightforward. International
standard cancer-patient populations have been proposed,
with different sets of weights in 5-year or 10-year age bands
for each of 20 common cancers, derived from their world-
wide distribution.
59
The weights used for the EUROCARE-3
study were derived from the age distribution of all patients
included in that study for each cancer, and were thus
cancer-specific.
43
The disadvantage of these standards is
either that a unique set of weights is required for each cancer
(cancer-specific), or else that the standards are arbitrary
(study-specific), vitiating comparison between studies.
We chose the recently developed International Cancer
Survival Standard (ICSS) weights.
60
These comprise just
three sets of age weights, derived from discriminant
analysis to find the smallest number of sets of standard
age weights that enable adequate standardisation of
survival. Each standard is applicable to a range of different
cancers, and provides age-standardised survival estimates
that are not too different from the unstandardised
estimates. The first ICSS standard applies to cancers for
which incidence rises rapidly with age, and we used this in
all analyses. For cancers of the breast, colon, and rectum,
we used five age groups: 15–44, 45–54, 55–64, 65–74, and
75–99 years. For prostate cancer, which occurs mainly in
older men, we used four age groups: 15–54, 55–64, 65–74,
and 75–99 years. Where data were too sparse for
standardisation, the raw (unstandardised) survival estimate
is presented, flagged with “R”.
The same age weights were used for men and women,
and for each race, enabling direct comparison of age-
standardised relative survival between patient groups
defined by sex and race. Because identical weights were
used for breast, colon, and rectal cancer, the age-
standardised estimates of survival for these cancers can
also be directly compared. This would not be possible if
cancer-specific weights were used.
See Online for webtable
Articles
www.thelancet.com/oncology Published online July 17, 2008 DOI:10.1016/S1470-2045(08)70179-7
11
Font reference and special characters
Keys Labels
Graph marks Arrows
ONC_COLEMAN_
1
Editor:
Wan Li
Author:
Name of illustrator
03/04/08
€$£¥∆Ωµ∏π∑Ωαβχδεγηκλμτ†‡
∞�婧¶√+−±×÷≈<>≤≥↔←↑→
↓
Tick Marks
Error ba
r
Axis break
Key 1
Key
2
Key
3
Key
4
Key
5
Key
6
Key
7
Key
1
Key
2
Key
3
Key
4
Key
5
Key
6
Key
7
C
E
G
D
F
H
21·3 5
Urgent
Text type
d
Image redrawn
Checked by
Africa
America, Central and South
Data covering less than 100% of country
Japan
Cuba†
US
A
Australia
France
Canada
Netherlands
Sweden
Austri
a
Spai
n
Finlan
d
Norwa
y
Italy
Germany
Iceland
Northern Irelan
d
Brazil
Portugal
Ireland
Scotland
Denmark
England
Wa
les
Estoni
a
Slovenia
Malta
Slovakia
Czech Republic
Poland
Algeria
US
A
Austri
a
Canada
Australi
a
Germany
France
Iceland
Cuba†
Netherlands
Sweden
Italy
Norwa
y
Finlan
d
Ireland
Spai
n
Estoni
a
Scotland
Northern Irelan
d
England
Czech Republic
Japan
Brazil
Wa
les
Portugal
Slovakia
Malta
Slovenia
Denmark
Poland
Algeria
Cuba†
France
US
A
Canada
Australia
Japan
Sweden
Malta
Norwa
y
Netherlands
Austri
a
German
y
Spain
Iceland
Finland
Italy
Ireland
Northern Irelan
d
Denmark
Scotland
England
Portugal
Brazi
l
Wales
Slovakia
Czech Republic
Slovenia
Estoni
a
Poland
Algeria
Cuba†
US
A
Canada
Sweden
Japan
Australia
Finland
France
Italy
Iceland
Spain
Netherlands
Norwa
y
Switzerland
German
y
Austri
a
Denmark
Malta
Portugal
Northern Irelan
d
Scotland
England
Ireland
Wales
Slovenia
Poland
Czech Republic
Estoni
a
Brazi
l
Slovakia
Algeria
0 20 40 60 80 100 0 20 40 60 80 100
1·0
5·
6
41·7
50·7
2·2
7·
1
43·
0
46·9
7·0
26·
3
65·
6
2·
7
7·7
43·
3
45·7
Breast (women)
Colorectum (women) Colorectum (men)
Prostate
America, North
Asia
Europe
Oceania
5-year relative survival (%)
5-year relative survival (%)
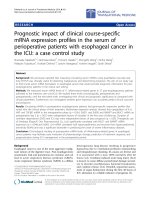
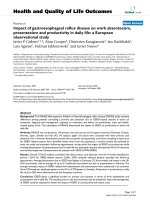
Figure 1: 5-year relative
survival (%), age-
standardised to the ICSS
weights* with 95% CIs for
adults (aged 15–99 years)
diagnosed with cancer of the
breast (women), colorectum,
or prostate during 1990–94
and followed up to Dec 31,
1999: country
Vertical bar on the right of
each graphic shows the
contribution (%) of each
continent to the total number
of cases analysed
(contributions under 1% are
not labelled). Red vertical line
represents mean survival for
the 22 European countries
that participated in
EUROCARE-3, age-
standardised to ICSS weights.
Switzerland only provided
data for breast cancer. *Age-
standardised to ICSS weights,
except for Sétif, Algeria (all
cancers), Malta (prostate), and
Portugal (prostate), which
were unstandardised values
(see text). †Problems with
data quality might have led
to over-estimation (see text).
Articles
12
www.thelancet.com/oncology Published online July 17, 2008 DOI:10.1016/S1470-2045(08)70179-7
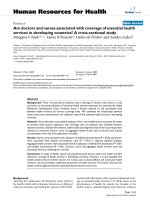
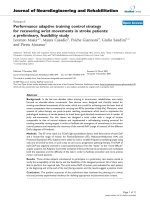
Figure 2: 5-year relative
survival (%), using state-
specific and race-specific life
tables and age-standardised
to the ICSS weights* for
adults (aged 15–99 years)
diagnosed with cancer of the
breast (women), colon,
rectum, colon and rectum
combined, or prostate
during 1990–94 and
followed up to Dec 31, 1999:
16 US States and six
metropolitan areas
Vertical lines represent mean
survival for SEER (red) and
NPCR (green) registries, age-
standardised to ICSS weights
(see text). *Age-standardised
to ICSS weights (see text).
†Problems with data quality
might have led to over-
estimation (see text).
Font reference and special characters
Keys Labels
Graph marks Arrows
ONC_COLEMAN_
2
Editor:
Wan Li
Author:
Name of illustrator
03/04/08
€$£¥∆Ωµ∏π∑Ωαβχδεγηκλμτ†‡
∞�婧¶√+−±×÷≈<>≤≥↔←↑→
↓
Tick Marks
Error bar
Axis break
Key 1
Key
2
Key
3
Key
4
Key
5
Key
6
Key
7
Key
1
Key
2
Key
3
Key
4
Key
5
Key
6
Key
7
C
E
G
D
F
H
21·3 5
Urgent
Text type
d
Image redrawn
Checked by
SEER registries
Michigan†
Seattle
Atlant
a
Detroit
Utah
Colorad
o
Nebraska
Iowa
New Mexico
Wyoming
Connecticut
Hawaii
Los
Angeles
Idah
o
New Jersey
California
Rhode Island
San Francisco
Florida
Louisian
a
New York State
New Yo
rk City
Hawaii
Seattle
Colorado
San Francisco
Iowa
Idah
o
Utah
Connecticut
Atlant
a
Nebraska
California
New Mexico
Rhode Islan
d
Wyoming
Florid
a
Los Angeles
New Jersey
Detroit
Michigan
New York State
Louisian
a
New Yo
rk City
Hawaii
Iowa
Nebraska
Seattle
Connecticut
Rhode Islan
d
Idah
o
Colorado
New Mexico
New Jersey
Florida
Atlant
a
San Francisc
o
California
Michiga
n
Louisiana
Los Angeles
Utah
Wyoming
Detroit
New York State
New York City
Hawaii
Rhode Islan
d
Atlanta
Seattle
Connecticut
New Mexico
Los Angeles
Colorado
New Jersey
Idah
o
Utah
California
Iowa
Detroit
Nebraska
Florid
a
Louisian
a
San Francisc
o
Wyoming
Michiga
n
New York State
New York City
Seattle
Atlant
a
Iow
a
Connecticu
t
Hawaii
Utah
Florid
a
Nebraska
San Francisco
California
Idah
o
Rhode Island
Colorad
o
Michigan
New Mexico
Los Angele
s
Louisiana
New Jerse
y
Detroit
New York Stat
e
New York City
Wyomin
g
Idaho
Connecticu
t
Seattle
Rhode Islan
d
Utah
Hawaii
Iow
a
Nebrask
a
California
Louisiana
Florid
a
San Francisco
Atlant
a
Los Angeles
New Jerse
y
Detroit
Colorad
o
Michigan
New York Stat
e
New Mexico
New York City
Wyomin
g
Hawaii
Seattle
Iow
a
Nebraska
Connecticu
t
Idaho
Rhode Islan
d
Atlant
a
Colorad
o
Florida
New Mexico
New Jerse
y
San Francisco
California
Utah
Michigan
Louisiana
Los Angele
s
Detroit
Wyomin
g
New York Stat
e
New York City
Hawaii
Idaho
Rhode Islan
d
Seattle
Atlant
a
Connecticu
t
Utah
Iow
a
Los Angeles
Nebraska
California
Colorad
o
New Jerse
y
Florida
Louisiana
Detroit
New Mexico
San Francisco
Michigan
New York Stat
e
Wyomin
g
New York City
0
Breast (women
)
Prostate
Rectum (women)
Rectum (men
)
Colon (women)
Colon (men
)
Colorectum (women)
Colorectum (men
)
20
40 60
80 100
0 2
0
40
60 80 100
0 2
0
40 60 80 100
0 20 40 60 80 100
NPCR registries
5-year relative survival (%) 5-year relative survival (%) 5-year relative survival (%)
5-year relative survival (%)
Articles
www.thelancet.com/oncology Published online July 17, 2008 DOI:10.1016/S1470-2045(08)70179-7
13
For countries represented by more than one regional
cancer registry, we provide a survival estimate derived from
the pooled data for all contributing registries, age-
standardised in the same way. This is an overall estimate of
survival in the combined territories providing data from
that country, not a weighted mean of the various regional
estimates. The combined estimate should not be
considered as necessarily representative of survival in the
country as a whole, except where the regional registries
cover the entire country.
Breast Colon Rectum Colorectum Prostate
Women RS (%)
(95% CI)
Men RS (%)
(95% CI)
Women RS (%)
(95% CI)
Men RS (%)
(95% CI)
Women RS (%)
(95% CI)
Men RS (%)
(95% CI)
Women RS (%)
(95% CI)
RS (%) (95% CI)
Atlanta, GA (all races), S 85·7 (84·0–87·4) 64·1 (60·5–68·0) 60·9 (58·0–63·9) 56·6 (51·0–62·8) 64·5 (59·5–69·8) 62·5 (59·4–65·8) 62·2 (59·6–64·9) 94·0 (92·4–95·6)
Black 71·1 (67·1–75·4) 59·9 (52·3–68·5) 52·6 (47·2–58·6) 45·5 (35·3–58·6) 52·1 (42·5–63·7) 56·8 (50·3–64·2) 52·9 (48·1–58·2) 86·5 (83·3–89·8)
White 89·6 (87·8–91·5) 65·4 (61·3–69·8) 63·9 (60·5–67·6) 59·4 (52·9–66·7) 67·9 (62·3–74·1) 64·1 (60·6–67·8) 65·4 (62·4–68·4) 96·1 (94·4–97·9)
California (all races), N 84·9 (84·5–85·3) 60·8 (59·9–61·6) 59·8 (59·0–60·6) 57·5 (56·3–58·8) 60·3 (59·0–61·6) 59·8 (59·1–60·5) 60·1 (59·4–60·8) 91·1 (90·6–91·5)
Black 73·4 (71·4–75·6) 54·8 (51·4–58·4) 51·1 (48·3–54·2) 50·3 (44·9–56·4) 50·9 (45·9–56·4) 53·6 (50·7–56·7) 51·2 (48·7–53·8) 84·5 (82·9–86·1)
White 85·3 (84·9–85·7) 60·7 (59·8–61·6) 60·1 (59·2–61·0) 57·4 (56·1–58·7) 60·4 (59·0–61·8) 59·7 (58·9–60·4) 60·3 (59·6–61·0) 90·8 (90·3–91·2)
Los Angeles, CA (all
races), N
83·8 (83·0–84·6) 61·9 (60·2–63·6) 58·8 (57·3–60·3) 56·2 (53·8–58·6) 58·8 (56·4–61·3) 60·0 (58·7–61·4) 58·8 (57·6–60·2) 91·7 (90·9–92·6)
Black 72·5 (69·6–75·6) 58·9 (54·5–63·8) 52·1 (48·2–56·3) 49·8 (42·3–58·7) 50·1 (43·4–57·9) 57·0 (53·2–61·2) 51·7 (48·2–55·3) 84·8 (82·5–87·3)
White 84·7 (83·9–85·5) 61·5 (59·7–63·4) 59·4 (57·6–61·2) 55·4 (52·8–58·2) 58·5 (55·7–61·4) 59·6 (58·0–61·1) 59·2 (57·7–60·7) 92·3 (91·4–93·2)
San Francisco, CA (all
races), S
86·6 (85·6–87·6) 59·8 (57·6–62·0) 60·3 (58·2–62·5) 57·0 (53·8–60·3) 60·6 (57·4–64·0) 58·9 (57·2–60·8) 60·5 (58·8–62·3) 90·5 (89·4–91·6)
Black 77·2 (73·2–81·4) 47·4 (41·0–54·7) 50·0 (44·4–56·4) 54·7 (43·7–68·5) 52·3 (41·5–66·0) 49·7 (44·2–56·0) 50·6 (45·6–56·2) 83·7 (80·4–87·1)
White 87·5 (86·5–88·6) 60·3 (57·9–62·9) 61·1 (58·7–63·6) 56·8 (53·2–60·5) 61·5 (57·9–65·4) 59·3 (57·3–61·4) 61·4 (59·4–63·5) 90·2 (88·9–91·4)
Colorado (all races), N 87·0 (85·8–88·2) 61·7 (59·1–64·5) 62·0 (59·6–64·6) 55·6 (51·7–59·9) 59·8 (55·9–64·0) 59·8 (57·6–62·1) 61·7 (59·6–63·9) 92·9 (91·8–94·1)
Black 81·6 (74·1–89·9) 45·0 (34·3–58·8) 48·0 (36·9–62·5) 76·8 (44·8–97·7) R 39·6 (16·2–64·9) R 49·7 (39·3–63·0) 46·7 (36·2–60·2) 80·7 (74·6–87·4)
White 87·0 (85·8–88·2) 62·1 (59·4–65·0) 62·3 (59·8–65·0) 54·9 (50·9–59·2) 60·6 (56·6–64·9) 59·8 (57·6–62·2) 62·1 (60·0–64·4) 92·8 (91·6–94·0)
Connecticut (all races), S 85·7 (84·7–86·8) 62·4 (60·2–64·7) 63·5 (61·4–65·7) 61·3 (58·1–64·6) 62·4 (59·1–65·9) 62·1 (60·3–64·0) 63·4 (61·6–65·2) 91·9 (90·7–93·2)
Black 75·2 (69·3–81·6) 51·1 (41·9–62·3) 52·7 (44·8–61·9) 63·5 (47·5–85·0) 73·3 (56·8–86·2) R 54·4 (46·0–64·3) 56·5 (49·4–64·6) 82·3 (77·6–87·2)
White 86·3 (85·3–87·3) 62·9 (60·6–65·3) 64·1 (61·9–66·4) 61·3 (58·1–64·7) 61·9 (58·5–65·5) 62·4 (60·5–64·3) 63·7 (61·9–65·6) 92·3 (91·0–93·6)
Florida (all races), N 84·0 (83·5–84·5) 60·2 (59·2–61·2) 61·0 (60·0–62·1) 57·0 (55·5–58·6) 61·0 (59·4–62·7) 59·4 (58·5–60·2) 61·2 (60·4–62·1) 89·2 (88·7–89·8)
Black 72·7 (70·1–75·3) 54·4 (50·0–59·1) 54·3 (50·9–57·9) 44·8 (37·7–53·1) 54·5 (48·4–61·3) 51·6 (47·8–55·6) 54·8 (51·9–58·0) 84·7 (82·7–86·7)
White 84·7 (84·2–85·2) 60·5 (59·4–61·6) 61·6 (60·5–62·7) 57·8 (56·2–59·5) 61·3 (59·6–63·1) 59·8 (59·0–60·8) 61·7 (60·8–62·6) 89·7 (89·1–90·3)
Hawaii (all races), S 90·2 (88·1–92·3) 68·4 (64·7–72·3) 67·2 (63·3–71·3) 59·6 (54·5–65·2) 61·5 (55·1–68·6) 65·4 (62·4–68·6) 66·2 (62·8–69·7) 91·8 (89·6–94·1)
White 90·2 (86·5–94·1) 67·9 (61·2–75·2) 61·6 (54·1–70·1) 54·0 (44·3–65·8) 66·0 (50·8–79·0) R 64·6 (58·6–71·1) 62·9 (56·2–70·3) 92·4 (89·0–96·0)
Idaho (all races), N 86·3 (84·2–88·5) 61·4 (56·9–66·3) 63·4 (59·1–68·0) 66·9 (60·8–73·6) 60·0 (53·3–67·6) 63·6 (59·9–67·6) 62·8 (59·1–66·7) 91·7 (89·8–93·7)
White 86·3 (84·2–88·5) 61·4 (56·8–66·4) 63·4 (59·1–68·1) 66·7 (60·5–73·4) 59·9 (53·1–67·5) 63·6 (59·8–67·5) 62·8 (59·1–66·8) 91·5 (89·5–93·5)
Iowa (all races), S 86·6 (85·5–87·7) 60·8 (58·4–63·3) 64·8 (62·7–67·0) 59·0 (55·6–62·6) 63·8 (60·2–67·6) 60·3 (58·3–62·3) 64·7 (62·9–66·6) 92·7 (91·5–93·9)
Black 60·1 (46·6–77·5) 66·8 (39·0–89·6) R 75·2 (51·7–94·1) R 56·5 (17·3–91·4) R 40·7 (12·5–71·8) R 66·9 (43·7–86·2) R 65·9 (46·5–82·8) R 85·8 (72·3–97·6) R
White 86·8 (85·7–87·8) 60·8 (58·4–63·3) 64·6 (62·5–66·8) 58·7 (55·3–62·4) 63·8 (60·2–67·7) 60·2 (58·2–62·2) 64·6 (62·7–66·5) 92·6 (91·4–93·8)
Louisiana (all races), N 81·0 (79·8–82·1) 59·9 (57·6–62·2) 58·8 (56·9–60·8) 57·2 (53·8–60·9) 58·7 (55·5–62·1) 59·2 (57·3–61·1) 58·9 (57·2–60·6) 88·6 (87·4–89·9)
Black 69·9 (67·2–72·7) 54·2 (49·6–59·3) 53·1 (49·6–56·9) 48·0 (40·8–56·4) 48·2 (41·9–55·4) 53·1 (49·2–57·2) 52·4 (49·2–55·8) 80·6 (78·1–83·2)
White 84·0 (82·8–85·3) 61·6 (59·1–64·3) 60·6 (58·4–63·0) 58·4 (54·6–62·4) 61·4 (57·8–65·3) 60·7 (58·6–62·9) 61·1 (59·2–63·1) 91·0 (89·6–92·4)
Michigan (all races)‡, N 82·3 (81·6–82·9) 58·8 (57·5–60·2) 59·3 (58·1–60·6) 55·2 (53·2–57·2) 59·2 (57·2–61·3) 57·8 (56·7–59·0) 59·5 (58·4–60·6) 100 (99·8–100)
Black‡ 69·6 (67·2–72·1) 47·9 (44·2–51·9) 51·8 (48·5–55·4) 45·1 (39·1–51·9) 45·1 (39·3–51·8) 47·1 (43·9–50·6) 50·5 (47·6–53·6) 100 (99·3–100)
White‡ 83·3 (82·6–84·0) 59·7 (58·3–61·2) 60·2 (58·9–61·6) 55·9 (53·8–58·1) 60·2 (58·1–62·4) 58·7 (57·5–59·9) 60·4 (59·3–61·6) 100 (99·8–100)
Detroit, MI (all races), S 83·0 (81·9–84·0) 60·6 (58·4–62·9) 58·2 (56·2–60·3) 55·7 (52·5–59·0) 57·4 (54·2–60·9) 59·2 (57·3–61·0) 58·0 (56·3–59·8) 93·8 (92·8–94·8)
Black 71·7 (68·9–74·6) 50·6 (45·9–55·8) 51·3 (47·6–55·4) 48·4 (40·9–57·2) 44·5 (37·4–53·0) 49·8 (45·7–54·2) 50·5 (47·1–54·3) 88·7 (86·4–91·1)
White 85·4 (84·3–86·5) 62·7 (60·2–65·3) 60·7 (58·3–63·2) 57·4 (53·9–61·0) 59·6 (55·9–63·4) 61·1 (59·1–63·2) 60·3 (58·3–62·4) 95·3 (94·2–96·4)
Nebraska (all races), N 85·4 (84·0–86·8) 60·4 (57·3–63·7) 64·3 (61·4–67·2) 58·3 (53·9–63·0) 60·6 (55·9–65·7) 59·8 (57·3–62·5) 63·6 (61·1–66·1) 92·9 (91·3–94·4)
Black‡ 83·1 (72·7–94·9) 69·6 (46·5–88·2) R 48·2 (29·9–66·4) R 60·0 (24·9–90·5) R 77·4 (22·6–100) R 66·9 (47·5–83·5) R 52·6 (34·9–69·7) R 78·7 (68·4–90·6)
White 85·4 (83·9–86·8) 59·9 (56·7–63·2) 64·9 (62·1–67·9) 57·8 (53·4–62·6) 60·5 (55·7–65·7) 59·3 (56·7–62·0) 64·0 (61·5–66·6) 93·1 (91·6–94·7)
New Jersey (all races), N 83·4 (82·7–84·1) 61·5 (60·1–62·9) 61·2 (59·9–62·6) 56·1 (54·1–58·3) 58·4 (56·4–60·6) 59·7 (58·6–60·9) 60·6 (59·5–61·7) 91·2 (90·4–91·9)
Black 73·1 (70·2–76·1) 51·6 (46·4–57·4) 51·5 (47·7–55·6) 46·4 (38·3–56·2) 45·1 (38·5–53·0) 50·3 (45·8–55·2) 50·3 (46·9–53·9) 81·0 (78·5–83·5)
White 83·8 (83·1–84·6) 61·4 (60·0–62·9) 61·8 (60·4–63·2) 56·0 (53·9–58·3) 58·9 (56·7–61·1) 59·6 (58·4–60·9) 61·1 (59·9–62·3) 90·8 (90·0–91·7)
(Continues on next page)
See Online for webpanel
Articles
14
www.thelancet.com/oncology Published online July 17, 2008 DOI:10.1016/S1470-2045(08)70179-7
The proportion of survivors is constrained in the range
zero to one (or 0 to 100%), but confidence intervals (CIs)
for relative survival derived in the usual way, from the
Normal approximation, can produce implausible values
(<0 or >1). SEER*Stat provided the standard error of the
cumulative relative survival based on the Greenwood
formula,
61
but did not provide CIs. We used these
standard errors to estimate CIs on the logarithmic scale
(webpanel).
For the USA, we constructed funnel plots of relative
survival for each cancer and sex, to obtain further insight
into the variability of survival by race and state, and to
avoid spurious ranking of the survival estimates.
62
The
plots show how much a particular survival estimate
deviates from the pooled US value, given the precision of
each estimate. The precision depends on the number of
deaths included in the analysis, which depends in turn
on the size of the population and the frequency and
lethality of the cancer in that population. 5-year relative
survival estimates for each population, age-standardised
and adjusted for race-specific and state-specific
background mortality, were plotted against the precision
of the estimates, taken as the inverse square of their
standard errors (webpanel). The horizontal line in each
plot, the target, was estimated as the pooled 5-year relative
survival for all participating US populations, age-
standardised to the same weights. Raw survival estimates
were not plotted. The 99·8% control limits superimposed
on each plot represent about three standard deviations
from the pooled US survival at each level of precision.
Breast Colon Rectum Colorectum Prostate
Women RS (%)
(95% CI)
Men RS (%)
(95% CI)
Women RS (%)
(95% CI)
Men RS (%)
(95% CI)
Women RS (%)
(95% CI)
Men RS (%)
(95% CI)
Women RS (%)
(95% CI)
RS (%) (95% CI)
(Continued from previous page)
New Mexico (all races), S 84·6 (82·8–86·4) 62·1 (58·1–66·3) 61·7 (57·9–65·7) 52·6 (47·2–58·7) 59·1 (53·0–65·8) 59·0 (55·8–62·4) 61·0 (57·8–64·4) 92·4 (90·7–94·2)
White 84·7 (82·8–86·6) 61·7 (57·7–66·0) 61·4 (57·5–65·6) 52·7 (47·1–58·9) 59·0 (52·8–65·9) 58·9 (55·6–62·4) 60·9 (57·6–64·4) 92·7 (91·0–94·4)
New York State (all
races), N
81·0 (80·5–81·5) 56·8 (55·8–57·8) 56·5 (55·6–57·5) 55·0 (53·5–56·5) 56·7 (55·2–58·3) 56·3 (55·4–57·1) 56·7 (55·9–57·5) 85·9 (85·3–86·5)
Black 67·2 (65·4–69·1) 45·9 (42·8–49·2) 46·0 (43·5–48·6) 42·8 (37·6–48·7) 46·8 (42·2–51·9) 45·1 (42·4–47·9) 46·2 (44·0–48·5) 75·9 (74·2–77·7)
White 82·1 (81·5–82·6) 57·3 (56·2–58·4) 57·2 (56·2–58·2) 55·8 (54·2–57·4) 57·4 (55·8–59·1) 56·9 (56·0–57·8) 57·4 (56·5–58·2) 86·5 (85·8–87·2)
New York City, NY (all
races), N
77·6 (76·8–78·4) 54·5 (52·9–56·2) 53·8 (52·3–55·3) 50·9 (48·4–53·5) 52·6 (50·2–55·1) 53·5 (52·1–54·9) 53·5 (52·3–54·8) 82·3 (81·2–83·4)
Black 65·8 (63·7–67·9) 45·2 (41·7–49·1) 45·0 (42·2–48·0) 44·4 (38·3–51·4) 46·5 (41·3–52·3) 45·0 (41·9–48·3) 45·3 (42·8–48·0) 74·0 (71·9–76·1)
White 79·6 (78·7–80·6) 55·6 (53·7–57·6) 54·9 (53·1–56·7) 51·9 (49·1–54·9) 53·3 (50·5–56·3) 54·5 (52·9–56·2) 54·5 (53·0–56·1) 83·3 (81·8–84·7)
Rhode Island (all races), N 84·6 (82·7–86·4) 64·7 (60·9–68·7) 63·4 (60·0–67·1) 60·1 (54·5–66·3) 59·9 (54·5–65·7) 63·4 (60·2–66·7) 62·7 (59·8–65·8) 90·9 (88·5–93·3)
Black‡§ 82·9 (65·8–100) 58·6 (28·5–85·9) R 45·0 (16·5–71·8) R NA 79·6 (28·8–100) R 65·5 (35·6–90·7) R 57·5 (31·4–78·5) R 75·5 (59·5–89·0) R
White 84·9 (83·1–86·8) 64·9 (61·1–69·0) 63·7 (60·2–67·4) 60·2 (54·5–66·4) 59·3 (53·9–65·3) 63·6 (60·4–66·9) 62·8 (59·8–65·9) 91·4 (89·0–93·9)
Seattle, WA (all races), S 88·7 (87·6–89·8) 63·9 (61·5–66·4) 64·2 (61·9–66·6) 60·8 (57·4–64·5) 65·5 (61·9–69·3) 63·2 (61·1–65·3) 64·9 (62·9–66·9) 95·3 (94·3–96·4)
Black 64·7 (55·5–75·3) 54·9 (42·5–71·0) 63·9 (45·4–80·2) R 46·9 (26·6–67·1) R 48·7 (20·1–75·1) R 51·9 (41·0–65·6) 54·9 (42·1–71·8) 89·6 (84·0–95·4)
White 89·3 (88·2–90·4) 64·4 (61·9–67·0) 64·1 (61·7–66·5) 61·7 (58·1–65·6) 65·7 (61·9–69·6) 63·8 (61·7–66·0) 64·8 (62·8–66·9) 95·4 (94·3–96·4)
Utah (all races), S 85·8 (84·0–87·7) 60·8 (56·8–65·1) 58·6 (54·5–63·0) 59·9 (54·2–66·2) 61·3 (55·0–68·2) 61·1 (57·8–64·6) 59·6 (56·2–63·3) 93·7 (92·1–95·2)
White 85·9 (84·0–87·9) 60·7 (56·6–65·1) 58·7 (54·6–63·2) 59·7 (53·8–66·2) 62·6 (56·3–69·8) 61·0 (57·6–64·6) 60·2 (56·6–63·9) 93·5 (91·9–95·1)
Wyoming (all races), N 84·2 (80·8–87·7) 59·5 (52·5–67·4) 58·5 (52·1–65·6) 46·4 (37·2–57·9) 52·2 (42·7–63·9) 55·9 (50·1–62·4) 57·7 (52·2–63·8) 92·2 (89·2–95·2)
White 84·3 (80·9–87·8) 60·5 (53·5–68·4) 58·1 (51·7–65·3) 46·2 (37·0–57·9) 52·5 (42·7–64·4) 56·5 (50·6–63·0) 57·5 (52·0–63·7) 92·1 (89·2–95·1)
NPCR (all races) 83·1 (82·8–83·4) 59·8 (59·3–60·4) 59·6 (59·1–60·1) 56·3 (55·5–57·1) 58·8 (58·0–59·7) 58·8 (58·3–59·2) 59·6 (59·1–60·0) 89·5 (89·2–89·8)
Black 70·7 (69·6–71·8) 52·1 (50·2–54·1) 50·5 (49·0–52·0) 46·9 (43·7–50·2) 49·1 (46·4–51·9) 50·7 (49·1–52·5) 50·3 (49·0–51·6) 81·1 (80·2–82·1)
White 84·0 (83·7–84·3) 60·1 (59·6–60·7) 60·4 (59·8–60·9) 56·7 (55·8–57·5) 59·4 (58·5–60·3) 59·1 (58·6–59·6) 60·2 (59·8–60·7) 90·0 (89·7–90·3)
SEER (all races) 86·1 (85·6–86·5) 61·9 (61·0–62·8) 62·1 (61·2–62·9) 58·5 (57·1–59·8) 61·8 (60·4–63·2) 60·9 (60·2–61·7) 62·2 (61·5–62·9) 93·1 (92·7–93·5)
Black 72·6 (70·8–74·5) 52·1 (48·9–55·5) 52·8 (50·2–55·5) 51·1 (45·8–56·9) 50·0 (45·1–55·6) 51·9 (49·2–54·9) 52·5 (50·2–55·0) 87·2 (85·7–88·7)
White 87·0 (86·6–87·5) 62·3 (61·3–63·3) 62·8 (61·9–63·8) 58·9 (57·5–60·4) 62·7 (61·2–64·2) 61·3 (60·5–62·2) 63·0 (62·2–63·8) 93·5 (93·0–93·9)
US registries (all races) 84·0 (83·8–84·2) 60·2 (59·8–60·6) 60·2 (59·8–60·6) 57·0 (56·4–57·6) 59·9 (59·2–60·5) 59·3 (58·9–59·6) 60·3 (60·0–60·6) 92·3 (92·1–92·5)
Black 70·9 (70·0–71·8) 51·5 (50·0–53·1) 51·0 (49·8–52·3) 47·4 (44·7–50·1) 49·4 (47·1–51·7) 50·5 (49·1–51·8) 50·8 (49·7–51·9) 85·8 (85·0–86·6)
White 84·7 (84·5–84·9) 60·5 (60·0–60·9) 60·8 (60·4–61·2) 57·3 (56·6–57·9) 60·4 (59·7–61·1) 59·6 (59·2–59·9) 60·8 (60·5–61·2) 92·4 (92·2–92·7)
RS=relative survival. S=Surveillance, Epidemiology and End Results (SEER) registry. N=National Program of Cancer Registries (NPCR) registry. See text for attribution of registries to NPCR and SEER.
R=raw (not age-standardised) survival estimate: too few cases in one or more age groups. *International Cancer Survival Standard (see text). †95% CIs were calculated by use of a logarithmic transformation (see
text). ‡Survival truncated if greater than 1·0 (100%). §Survival estimates based on fewer than five patients are not shown (NA=not applicable). Black populations are not shown separately for Hawaii, Idaho, New
Mexico, Utah, or Wyoming, because it was not possible to estimate relative survival for blacks in these states with race-specific life tables (see text).
Table 3: 5-year relative survival (%) by use of state-specific and race-specific life tables and age-standardised to ICSS weights* with 95% CIs† for adults (aged 15–99 years) diagnosed with
cancer of the breast (women), colon, rectum, or prostate during 1990–94 and followed up to Dec 31, 1999, by race: US populations
Articles
www.thelancet.com/oncology Published online July 17, 2008 DOI:10.1016/S1470-2045(08)70179-7
15
Differences between survival estimates are presented as
the absolute value, eg, 15% is given as 5% (not 50%) higher
than 10%.
We analysed individual data for almost 2 million adults
who were diagnosed with a first, primary, malignant,
invasive neoplasm of the breast (women), colon, rectum,
or prostate during the period 1990–94 and who had been
followed up to ascertain their vital status for at least 5 years
after diagnosis until the end of 1999 or later. Data were
contributed by 101 population-based cancer registries
covering a combined population of almost 300 million
persons living in 31 countries (table 1 and webfigure 1).
Canada and the USA contributed 1·07 million patients
(54% of the total) from a population base of 125 million.
The 24 European countries contributed 740 000 patients
(37%) from a population base of 126 million, indicating
lower mean incidence of cancer than in North America.
The smallest dataset came from Sétif (Algeria), covering
a population of 1·1 million, some 4% of the national popu-
lation. The registry could only provide data for the period
1992–94, the population is young, and cancer risks are
currently low on the global scale.
63
The dataset was there-
fore small, a total of 300 patients. This decreases the
statistical precision of survival estimates, but no patient was
detected solely at death certification or autopsy, and the
vital status of every patient was ascertained at a home visit
by registry staff, something no other registry could deliver.
Some of the datasets for black patients in US states were of
similar size (webtable). California provided the largest
single dataset of 240 000 patients diagnosed during 1990–94
in a population of 31 million (12% of the US population),
with a very high cancer risk on the global scale (table 1).
For 16 of the 31 countries, the data covered 100% of the
national population (table 1). The proportion of the national
population covered by the data for the other 15 countries
ranged from less than 10% (Algeria, Brazil, Japan, Austria,
Czech Republic, France, Germany, Poland) to 10–29%
(Italy, Portugal, Spain, Switzerland) and 30% or more
(Canada, USA, the Netherlands).
Most registries provided data on patients diagnosed
during the entire 5-year period 1990–94, but ten registries
provided data for shorter periods (table 1).
Data for all four index cancers were provided by 89 of the
101 registries. Two specialised registries in Côte-d’Or
(France) only collect data on cancers of the breast or
colorectum, respectively, whereas ten general registries
that collect data for all cancers only contributed data for
selected cancers: breast (Isère, France; northern Nether-
lands; all five Swiss registries); breast, colon, and prostate
(Campinas, Brazil; Nova Scotia, Canada), or breast, colon,
and rectum (Granada, Spain; table 1).
Ethical approval for the CONCORD study
33
was obtained
from the Istituto Superiore di Sanità, Rome, Italy (CE-ISS
02/03, May 20, 2002) and from the Institutional Review
Board of the CDC, Atlanta, GA, USA (IRB #3551, July 24,
2002). SEER data were obtained from the public-use
dataset.
38
For other registries, anonymised data were trans-
mitted to the CONCORD Data Analysis Centre at the
Istituto Superiore di Sanità by use of special courier
delivery of encrypted and password-protected CD-ROMs
with separate email transmission of the password, or pre-
planned deposition of password-protected files on a
specially created File Transfer Protocol (FTP) site from
which the data were immediately removed in Rome. Each
tumour record included a serial number for the purposes
of quality control with the originating cancer registry.
Role of the funding source
The pilot study (January, 2000 to March, 2000) was funded
by the UK Department of Health (£75 000). The CDC
funded data collection and the costs of linkage to the
National Death Index for the phase I study in participating
registries in the National Program of Cancer Registries
(US$3 million). The Cancer Survival Group (including BR,
MQ) in the London School of Hygiene and Tropical
Medicine, London, UK, has been funded by Cancer
Research UK (grant C1336/A5735) since April, 2005. Fund-
ing applications were open and competitive. None of the
funding sources had any role in design, data collection,
analysis, interpretation of the data, or writing of this article.
MPC, MQ, RdA, RC, SF, MSantaquilani, and AV had
access to the raw data. The corresponding author had full
access to all of the data and the final responsibility to
submit for publication.
Results
The background risk of death in the general population
varied widely between the participating countries and
regions. The mean life expectancy at birth during the
decade 1990–99 ranged from 63·7 to 77·6 years in men
and from 70·9 to 83·7 years in women.
46
In the USA, the
range of life expectancies in white and black populations
did not overlap at all in the states and metropolitan areas
for which life tables could be constructed for both groups.
The ranges for men were 64·0–70·1 years in blacks and
71·1–75·9 years in whites, whereas the ranges in women
were 73·3–76·5 years in blacks and 78·8–80·9 years in
whites.
The cumulative risk of death from all causes over the age
range 15–59 years in the general population of the partici-
pating countries and regions ranged widely, from 9% to
34% in men and from 5% to 17% in women. Over the age
range 60–84 years, the cumulative risk of death ranged from
60% to 86% in men and from 40% to 75% in women.
46
Of 785 255 records of breast cancer submitted for
analysis, 45 020 (6%) related to women registered with a
previous primary cancer, and were excluded (available on-
line
34
) Of the 740 235 eligible first primary invasive breast
cancers, 9215 records were excluded as death-certificate-
only (DCO) registrations (1%), 239 as autopsy-detected
tumours (<1%) and 2064 with major errors (<1%), leaving
728 717 patients for analysis (98% of those eligible), of
whom 370 000 (51%) were resident in North America and
304 000 (42%) in Europe (table 1). Almost all (97%) of the
Articles
16
www.thelancet.com/oncology Published online July 17, 2008 DOI:10.1016/S1470-2045(08)70179-7
tumours included in the analyses were microscopically
verified, less than 1% of patients were censored from the
analysis within 5 years of diagnosis, and 2·3% died within
1 month of diagnosis.
Relative survival at 5 years, age-standardised to the
International Cancer Survival Standard weights, ranged
from 80% or over in North America, Sweden, Japan,
Finland, and Australia to less than 60% in Brazil and
Slovakia, and below 40% in Algeria (table 2 and figure 1).
Survival in the 24 European countries that contributed to
CONCORD was mostly in the range 70–79%.
The survival estimate of 38·8% (95% CI 31·4–46·2) for
Sétif (Algeria) is based on 180 patients, and it is not age-
standardised because there were too few patients for
analysis in some age groups, but age-standardisation
for breast cancer in other datasets rarely altered the raw
estimate by more than 5% in either direction (data not
shown), and survival from breast cancer was undoubtedly
much lower in Algeria than in all the other countries.
The pooled estimate of 5-year survival for the two
Brazilian registries was 58·4%, but the estimate for
Goiânia (65·4%) is more reliable than the very low figure
for Campinas (36·6%), where high proportions of patients
were excluded as DCO or with major errors (available
online
34
). The proportion of metastatic tumours was higher
in Campinas, however. The 5-year survival estimate for
Cuba was 84·0%, but this was likely to be an over-estimate:
some 28% of records were excluded because they were
registered solely from a death certificate.
The pooled estimate of 5-year survival for Canada was
82·5%, with a narrow range from 79·3% in Nova Scotia to
85·4% in British Columbia (table 2 and figure 1). In the
USA, 5-year relative survival for all races combined ranged
from 78–81% in New York City, New York State, and
Louisiana to 89–90% in Hawaii and Seattle, WA (table 2),
but most of the estimates were within a fairly narrow
range, from 82% to 87% (figure 2). Survival in metropolitan
areas covered by SEER registries was similar to that in the
respective states: Detroit, MI 83·0% and Michigan State
82·3%; San Francisco, CA 86·2% and California
State 84·6%. 5-year survival was 77·4% for residents of
New York City, NY (with 40% of the state population),
slightly lower than for New York State as a whole, 81·0%.
Survival was lower for blacks than for whites in all
17 populations in the USA for which this could be assessed
with race-specific life tables (webfigure 2). The age-adjusted
pooled estimate of 5-year survival was 84·7% for whites
(range 80–90%) and 70·9% for blacks (table 3). The range
in survival was wider for blacks (60–83%), but the values at
both extremes of the range were based on relatively few
patients and have wider CIs. Within a given US population,
the absolute difference in age-adjusted relative survival be-
tween blacks and whites ranged from 2% (Rhode Island,
Nebraska) to 25–27% (Iowa and Seattle, WA; table 3 and
webfigure 2). Even in areas where blacks comprise 25% or
more of the population, survival for black women was
8–14% below the lowest estimate for white women (79·6%)
in any of the participating areas: Atlanta, GA (71·1%),
Detroit, MI (71·7%), New York City, NY (65·8%), and
Louisiana (69·9%). The pooled estimate of 5-year survival
for the USA was 84·0%, with 86·1% in areas covered by
SEER and 83·1% in areas covered by NPCR (table 3).
Survival in black women was always lower than the mean
survival for all US populations included, and often more
than three standard deviations below it (below the 99·8%
control limits), after controlling for the precision of the
estimates. Survival in white women is generally within or
above the upper control limits, especially in territories
covered by the SEER Program. A notable exception is for
white women in New York State, including New York City,
where the survival estimates are precise, but well below the
lower control limits (webfigure 3).
The pooled estimate of 5-year survival for breast cancer
in Japan was 81·6%. Survival in Osaka (79·4%) was lower
than in Fukui (83·1%) and Yamagata (87·3%; table 2 and
figure 1).
5-year relative survival for breast cancer in Europe, age-
standardised to the ICSS weights, ranged from 57·9% in
Slovakia to 82·0% in Sweden (table 2 and figure 1), whereas
the pooled estimate derived from the data of 58 registries
in the 24 participating European countries was 73·1%.
Survival estimates for most of these countries have been
reported.
27
The CONCORD study includes additional data
from four countries: 5-year survival was 69·6% in Ireland
and 72·0% in Northern Ireland, similar to the UK
mean value of 69·7% (table 2). In Switzerland, 5-year
survival in the cantons of St Gallen-Appenzell, Grau-
bunden-Glarus, and Valais was 72–75%, about 4–7% lower
than in Geneva or Basel. 5-year survival was 77·8% in
northern Netherlands, similar to that in Amsterdam and
southern Netherlands (76–78%).
The national estimate of 5-year survival for breast cancer
in Australia was 80·7%. Survival was virtually identical
in the six largest states (96% of the national population), in
the range 80–82%, but notably lower in the two smallest
regions: 71·9% in Northern Territory (1·0% of the
population) and 77·1% in Tasmania (2·6%).
Of 488 741 colon cancer records submitted for analysis,
45 862 records (9%) were excluded for a previous cancer,
leaving 442 879 first, primary, invasive colon cancers
eligible for analysis (available online
34
). A further 13 102 (3%)
were excluded as DCO registrations, 1534 (<1%) as autopsy-
detected tumours, and 1144 (<1%) as major errors, leaving
427 099 patients for inclusion in the analyses (96% of those
eligible). Of these, 214 000 (50%) were resident in North
America, 170 000 (40%) in Europe, and 30 300 (7%) in
Australia. Cancers of the colon comprised 67% of all
colorectal tumours (table 1). Microscopic verification was
high (94%), and less than 1% of patients were censored
from the analysis within 5 years of diagnosis. Almost 11%
of patients died within the first month after diagnosis.
Relative survival at 5 years, age-standardised to the ICSS
weights, ranged from about 60% in North America, Japan,
Australia, and some western European countries down to
See Online for webfigures 2 and 3
Articles
www.thelancet.com/oncology Published online July 17, 2008 DOI:10.1016/S1470-2045(08)70179-7
17
40% or less in Algeria, Brazil, Czech Republic, Estonia,
Poland, Slovenia, and Wales (table 2 and figure 3).
The survival estimates of 11·4% (95% CI 0·7–40·9) for
men and 30·6% (9·5–56·1) for women in Sétif (Algeria)
were based on fewer than 20 patients, and are not age-
standardised, but survival was clearly lower in Algeria than
in all the other countries.
The estimate of 5-year relative survival for Goiânia
(48·1% in men, 44·8% in women) was more plausible for
Brazil than the low estimates for Campinas, where 26% of
patients had to be excluded with errors.
34
5-year survival in
Cuba was about 60% in both sexes, although more than
half the patients were excluded from analysis as DCOs.
34
In Canada, the pooled estimate of 5-year survival was
56·1% for men and 58·7% for women. Variation between
provinces was small, from 54–57% in men and 58–60%
in women (table 2 and figure 3). In the USA, 5-year
relative survival for all races combined was 60·1% in both
sexes, with a range from 53·6% for women in New York
City to 67·9% for men in Hawaii (table 2 and figure
2). Again, most of the estimates were within a narrow
range, 59–64%.
5-year survival for colon cancer among blacks in the USA
was lower than among whites. In 34 paired observations of
this difference in survival (men and women in 17 popu-
lations), only three exceptions were noted, in men and
women in Iowa and men in Nebraska. The estimates for
blacks in those three areas were based on fewer than
50 patients, have wide confidence intervals and were not
age-standardised (table 3 and webfigure 4). The pooled
estimate of age-adjusted 5-year relative survival for the
USA was 61% for white men and women, and 51–52% for
black men and women. Within a given population, the
absolute difference between blacks and whites ranged from
2·6% in men and 7·3% in women in Los Angeles, CA to
14·3–17·2% in Colorado. The geographical range in
black–white differences in survival is affected by small
populations to some extent, but even in areas where blacks
comprise 25% or more of the population (Atlanta, GA,
Detroit, MI, New York City, NY, Louisiana), 5-year survival
from colon cancer in blacks was 6–12% lower than for
whites in the same population (table 3). The pooled
estimate of 5-year survival in areas covered by NPCR was
59·8% for men and 59·6% for women, and 61·9% for men
and 62·1% for women in SEER areas.
Age-standardised survival in whites ranged from 54·9%
to 67·9% (table 3 and webfigure 4). The range of age-
standardised survival for blacks was 45·0% to 59·9%.
Survival in blacks was generally lower than the mean value
for all included US populations and often more than three
standard deviations below the mean, after controlling for
precision of the survival estimates. Survival in whites was
generally within the control limits. The main exception
was for white women in New York State, including New
York City, NY, where survival estimates were precise, but
more than three standard deviations below the lower control
limits around the pooled US estimate (webfigure 3).
In Japan, the pooled survival estimate was 63·0% in
men and 57·1% in women, although survival was about
10% lower in Osaka prefecture than in Fukui or Yamagata
(table 2 and figure 3).
In Europe, 5-year relative survival for colon cancer in
men ranged from 28·5% in Poland to 54–57% in Spain,
Finland, Austria, and France. In women, the lowest
estimate was also for Poland (30·9%), while survival was
in the range 55–60% in nine countries (table 2 and
figure 3). The pooled estimates for the 51 contributing
registries in 23 European countries were 46·8% in men
and 48·4% in women. Data on colon cancer were not
available for the five Swiss registries, Isère (France), or
northern Netherlands. Survival estimates for most of
these countries have been published elsewhere.
27
This
study included additional data from two countries. 5-year
survival in Ireland was 49·1% in men and 48·5% in
women. The estimates for Northern Ireland were 47·3%
in men and 49·0% in women, slightly higher than the
pooled estimate for the UK, 43·5% in men and 44·4% in
women (table 2).
The national estimate of 5-year survival for colon cancer
in Australia was 57·8% in men and 57·7% in women.
Survival ranged from 50–62% in the eight states and
territories: it was highest in New South Wales, the
Australian Capital Territory, and Queensland, and lowest
in Tasmania, Northern Territory, and Western Australia
(9·6% of the population; table 1).
Of 233 176 rectal-cancer records submitted for analysis,
15 731 records (7%) were excluded for a previous cancer,
leaving 217 445 first, primary, invasive rectal cancers eligible
for analysis (available online
34
). A further 3213 (1%) were
excluded as DCO registrations, 517 (<1%) as autopsy-
detected tumours and 574 (<1%) as major errors, leaving
213 141 patients for inclusion in the analyses (98% of those
eligible). Of these, 83 000 (39%) were resident in North
America, 106 000 (50%) in Europe, and 16 800 (8%) in
Australia. Cancers of the rectum comprised 33% of all
colorectal tumours (table 1). Microscopic verification was
high (96%). Less than 1% of patients were censored from
the analysis within 5 years of diagnosis. Almost 8% died
within the first month after diagnosis.
5-year relative survival from rectal cancer, age-
standardised to the ICSS weights, ranged from about 60%
to around 20% in both sexes, with Japan, Canada, the
USA, France, the Netherlands, Sweden, and Australia at
the upper end of the range, and Algeria, Estonia, Poland,
and Slovakia at the lower end (table 2 and figure 3).
The 5-year survival estimates of 25·9% (95% CI
11·4–43·7) for men and 18·2% (6·6–34·6) for women in
Sétif (Algeria) were each based on 30 patients, and were
not age-standardised because data were too sparse in some
age groups.
5-year relative survival in Goiânia, Brazil, was 49·3% in
men and 38·4% in women. No data were available for
Campinas. 5-year survival in Cuba was 59·2% in men and
62·8% in women, based on analysis of about 700 patients
See Online for webfigure 4
Articles
18
www.thelancet.com/oncology Published online July 17, 2008 DOI:10.1016/S1470-2045(08)70179-7
Font reference and special characters
Keys Labels
Graph marks Arrows
ONC_COLEMAN_
5
Editor:
Wan Li
Author:
Name of illustrator
03/04/08
€$£¥∆Ωµ∏π∑Ωαβχδεγηκλμτ†‡
∞�婧¶√+−±×÷≈<>≤≥↔←↑→
↓
Tick Marks
Error ba
r
Axis break
Key 1
Key
2
Key
3
Key
4
Key
5
Key
6
Key
7
Key
1
Key
2
Key
3
Key
4
Key
5
Key
6
Key
7
C
E
G
D
F
H
21·3 5
Urgent
Text type
d
Image redrawn
Checked by
Cuba†
Japan
USA
Netherlands
Australi
a
Canada
Sweden
France
Iceland
Norwa
y
Spain
Finlan
d
Brazi
l
Northern Irelan
d
German
y
Italy
Austri
a
Denmark
Portuga
l
Scotland
Ireland
England
Wale
s
Malta
Sloveni
a
Estoni
a
Czech Republic
Poland
Slovakia
Algeria
France
Cuba†
US
A
Australia
Canada
Sweden
Japan
Norwa
y
Netherlands
Finland
Malta
Ireland
German
y
Spain
Italy
Iceland
Scotland
Denmark
England
Austri
a
Portugal
Northern Irelan
d
Wales
Czech Republic
Brazi
l
Slovenia
Slovakia
Estoni
a
Poland
Algeria
Cuba†
France
US
A
Austri
a
Canada
Malta
Australia
Japan
Spain
German
y
Netherlands
Iceland
Sweden
Finland
Norwa
y
Italy
Northern Irelan
d
Denmark
Ireland
Scotland
Portugal
England
Slovakia
Slovenia
Estoni
a
Wales
Czech Republic
Brazi
l
Poland
Algeria
Japan
USA
Cuba†
Australi
a
Franc
e
Austria
Canada
Finlan
d
Spai
n
Netherlands
Sweden
Ital
y
German
y
Norwa
y
Ireland
Portuga
l
Iceland
Northern Irelan
d
Scotlan
d
Denmark
Englan
d
Slovakia
Wales
Estoni
a
Malta
Czech Republic
Sloveni
a
Brazi
l
Poland
Algeria
0 20 40 60 8
0 100 0 20 40 60 80 100
2·1
6·9
40·2
50
2·4
7·
4
49·
3
39·
9
7·0
39·
4
50
2·
7
8·
2
49·7
38·5
Colon (women)
Rectum (women) Rectum (men)
Colon (men)
Africa
America, Central and South
Data covering less than 100% of country
America, North
Asia
Europe
Oceania
5-year relative survival (%) 5-year relative survival (%)
Figure 3: 5-year relative
survival (%), age-
standardised to the ICSS
weights* with 95% CIs for
adults (aged 15–99 years)
diagnosed with cancer of the
colon or rectum during
1990–94 and followed up to
Dec 31, 1999: country
Vertical bar on the right of
each graphic shows the
contribution (%) of each
continent to the total number
of cases analysed
(contributions under 1% are
not labelled). Red vertical line
represents mean survival for
the 22 European countries
that participated in
EUROCARE-3, age-
standardised to the ICSS
weights. *Age-standardised to
ICSS weights, except for Sétif,
Algeria (all cancers), Austria
(rectum [women]), Iceland
(rectum [men and women]),
Ireland (rectum [women]),
Malta (colon [men] and
rectum [men and women]),
which were unstandardised
values (see text). †Problems
with data quality might have
led to over-estimation (see
text).
Articles
www.thelancet.com/oncology Published online July 17, 2008 DOI:10.1016/S1470-2045(08)70179-7
19
in each sex, although 782 (36%) patients had been excluded
as DCO (available online
34
).
In Canada, the pooled estimate of 5-year survival was
58·7% for women and 53·1% for men, slightly lower in
the global range than for cancers of the breast, colon, or
prostate in Canada. Survival in men ranged from 51·1%
(Ontario) to 64·6% (British Columbia), and from 57·8% to
62·8% in women. In the USA, 5-year relative survival for all
races combined was 56·9% in men and 59·8% in women,
with a range from 46–67% in men and 52–66% in
women (table 2 and figure 2). Again, most of the estimates
were within a narrow range, from 55–60% in men and
57–62% in women. By contrast with colon cancer, survival
from rectal cancer was slightly higher in women than in
men.
5-year survival for rectal cancer in the USA was generally
lower for blacks than for whites, in both sexes (webfigure 4).
The overall estimate of 5-year survival in men was 47·4%
for blacks and 57·3% for whites; for women, the estimates
were 49·4% for blacks and 60·4% for whites (table 3).
When survival for blacks was above 60%, or higher than
for whites in the same population (Colorado, Connecticut,
Nebraska, Rhode Island), the estimates for blacks were
based on around 50 or fewer patients, with wide CIs, and
were usually not age-standardised (table 3 and webfigure 4).
Even where blacks comprised 25% or more of the
population (Atlanta, GA, Detroit, MI, New York City, NY,
Louisiana), 5-year survival was 6–16% lower than for
whites in the same area. The pooled estimate of 5-year
survival in areas covered by NPCR was 56·3% for men
and 58·8% for women, some 2–3% lower than for SEER
areas (58·5% men, 61·8% women; table 3 and figure 2).
5-year survival ranged from 46·2% to 67·9% in whites;
in blacks, the range of age-standardised survival was from
42·8% to 63·5% (table 3 and webfigure 4). Survival in
blacks was generally lower than the mean value for all
included US populations, although more often within the
control limits. Survival for whites was also generally within
the control limits, with the exception of New York City, NY,
where survival was below the control limits (webfigure 3).
In Japan, the pooled survival estimate for colon cancer
was 58·2% for men and 57·6% for women, although
survival was lower in Osaka (54–55%) than in Fukui or
Yamagata (60–64%; table 2 and figure 3).
In Europe, the geographical pattern for age-standardised
5-year survival was similar to that for colon cancer. For
men, the range was from 28–30% in Poland, West
Bohemia (Czech Republic), and Slovakia to 53–55% in
France, Sweden, and the Netherlands; whereas for
women, the range was from 30–32% in Poland, Estonia,
and Slovakia up to 63·9% in France, where three of the
four contributing registries ranked the highest in Europe
(table 2 and figure 3). The pooled estimates for the
51 contributing registries in 23 European countries were
43·2% in men and 47·4% in women. Data on rectal
cancer were not available for Isère (France), northern
Netherlands, or the five Swiss registries. 5-year survival
in Ireland was 41·1% in men and 52·5% in women. The
estimate for women is not age-standardised, but it is
based on over 200 patients (table 1), and similarity
between the raw and standardised estimates for cancers
of the colon and colon and rectum combined (less than
1%, data not shown) suggests that an age-standardised
estimate for rectal cancer would not have been very
different. In Northern Ireland, the estimates were 48·2%
in men and 43·8% in women (pooled UK estimates were
40·6% in men and 45·3% in women; table 2).
The national estimate of age-standardised 5-year survival
for rectal cancer in Australia was 54·8% in men and 59·2%
in women. Survival ranged from 45–57% in men and from
55–61% in women.
Of 663 621 men with prostate cancer, 35 934 (5%) were
excluded for a previous cancer, leaving 627 687 eligible first,
primary, invasive cancers of the prostate (available online
34
).
After 11 163 (2%) exclusions for DCO, 1640 (<1%) for
autopsy-detection and 801 (<1%) for major error,
614 083 men were included in the analyses (98% of those
eligible). Of these, 403 000 (66%) were resident in North
America, 162 000 (26%) in Europe, and 43 000 (7%) in
Australia (table 1). Microscopic verification was available
for 96% of the tumours. Less than 1% of men were cen-
sored from the analysis within 5 years of diagnosis, but
3·2% died within 1 month of diagnosis.
5-year relative survival, age-standardised to the ICSS
weights, ranged from 80% or higher in the USA (92%),
Canada and Austria to less than 40% in Denmark, Poland,
and Algeria (table 2 and figure 1).
The 5-year survival estimate of 21·4% (95% CI 8·7–38·9)
in Sétif (Algeria) was based on 36 patients, and was not
age-standardised.
In Brazil, 5-year survival was 34·4% in Campinas and
55·7% in Goiânia. Some 30% of tumour records in
Campinas were excluded with major errors. Notably,
20 (13·4%) men in Campinas and 71 (21·8%) men in
Goiânia died within 1 month of diagnosis, which are the
highest proportions of any of the participating registries
(available online
34
). 5-year survival in Cuba was 69·7%
(table 3). This estimate was based on 4300 patients, but
54% of the original data set of 9500 patients had been
excluded as DCO (table 1 and data available online
34
).
The pooled estimate of 5-year survival for prostate cancer
in Canada was 85·1%, ranging from 77·5% in Saskatchewan
to 89·3% in British Columbia (table 2 and figure 1). In the
USA, 5-year relative survival from prostate cancer was
91·9% for all races combined, with a range from 81·6% in
New York City, NY up to 95·0% in Seattle, WA (table 2 and
figure 2), but most of the estimates were within a fairly
narrow range, from 88·6% (Louisiana) to 94·0% (Atlanta,
GA). The relative survival estimate for the state of Michigan
was 100%, although in the city of Detroit, MI, with 42% of
the state population (webtable), survival from prostate
cancer in the same period was 93·8%.
Age-standardised 5-year relative survival for prostate
cancer in blacks was lower than for whites in all
Articles
20
www.thelancet.com/oncology Published online July 17, 2008 DOI:10.1016/S1470-2045(08)70179-7
populations for which this could be separately assessed
with race-specific life tables (webfigure 2). The overall
estimate of 5-year survival was 85·8% for blacks and
92·4% for whites, with an overall difference of 6·6%
(table 3). The difference in survival between blacks and
whites ranged from 5·0% (Florida) to 14–16% (Nebraska,
Rhode Island), and although the largest differences arise
where the black populations are smallest, each survival
estimate was based on at least 70 patients (webtable).
Survival in whites ranged from 83·3% (New York City,
NY) to 96·1% (Atlanta, GA), and in blacks from 74·0%
(New York City, NY) to 89·6% (Seattle, WA). The pooled
estimate of 5-year survival was 89·5% in areas covered
by NPCR, and 93·1% in SEER areas (table 3).
Survival in blacks was usually lower than the pooled US
estimate, and often more than three standard deviations
below it, after controlling for precision (webfigure 3).
Survival in whites was generally within the control limits.
5-year survival for whites was above the upper 99·8%
control limit in three SEER populations (Atlanta, GA,
Seattle, WA, and Detroit, MI). Survival in whites was below
the lower control limit in four NPCR populations, but for
California and Florida the difference was small (2–3%). In
New York State, including New York City, NY, survival
estimates are precise, but 6–9% below the pooled US
estimate of 92·3% and well below the lower control limit
(webfigure 3).
The 5-year relative survival estimates for Michigan State
(100% in both blacks and whites) were too high, and they
are not shown in webfigure 3, although the data were
included in the pooled estimate. Information about the
death had not been linked to the tumour record for some
of the apparent 5-year survivors from prostate cancer in
Michigan State, leading to an inflated estimate. This error
did not affect the survival estimates for prostate cancer in
Detroit, MI or those for other cancers in Michigan State.
The pooled estimate of 5-year survival in Japan was
50·4%, much lower on the global scale than for cancers of
the breast, colon, or rectum in Japan. Survival estimates
were similar in all three prefectures (table 2 and figure 1).
The range of 5-year survival in Europe was especially
wide for prostate cancer, from less than 40% in Poland and
Denmark to more than 80% in Austria (table 2 and figure 1).
The pooled estimate for the 49 contributing registries in 23
European countries was 57·1%. Data were not available for
nine registries: Switzerland (five registries), Isère and Côte
d’Or (France), Granada (Spain), and northern Netherlands.
5-year survival in the Ireland was 62·8%. In Northern
Ireland, the estimate was 54·0%, slightly higher than the
pooled estimate of 51·1% for the UK (table 2).
The national estimate of age-standardised 5-year
survival for prostate cancer in Australia was 77·4%.
Survival was closely similar in the six largest states, in
the range 76–80%, but notably lower in the two smallest
regions: 63·7% in Northern Territory (based on
78 patients, estimate not age-standardised) and 70·2% in
Tasmania (1321 patients).
Discussion
To our knowledge, the CONCORD study is the first attempt
to provide directly comparable data on cancer survival from
many countries around the world by use of central quality-
control procedures, standard analytic methods, and a
single, centralised analysis of individual tumour records
from population-based cancer registries. The findings
should eventually complement the international data series
on cancer incidence
63,64
and mortality
65–67
that have been
available for several decades. Cancer-mortality statistics
have often been used for international comparisons of pro-
gress against cancer,
68–72
but they are also affected by well-
known problems of comparability, both between countries
and between successive revisions of the ICD.
72–75
The
findings presented here should help joint consideration of
trends in incidence, survival, and mortality as indicators of
cancer control. None of these indicators is perfect, but
none is adequate on its own.
76–78
Around 2800 life tables were created to enable the esti-
mation of relative survival by age, sex, country, and race.
46
The life tables are available on the CONCORD website.
34
5-year relative survival for breast, colorectal, and prostate
cancers was generally higher in North America, Australia,
Japan, and northern, western, and southern Europe, and
lower in Algeria, Brazil, and eastern Europe.
Exclusions for a previous cancer (5–9%) were not un-
expected. Population-based cancer survival analyses are
usually restricted to patients with a first, primary invasive
cancer, therefore, to the extent that patients with a previous
cancer have been completely excluded in this study, this
improves the comparability of the findings with other
studies. Participating registries began operation between
1950 and 1990. The data from newer registries are more
likely to include unrecognised second and subsequent
cancers, because any previous cancer(s) in a given patient
might have been diagnosed before the registry began
operation.
The main indices of data quality for cancer survival are
the proportions of registered patients known to the registry
by DCO, or lost to follow-up, and histologically verified.
Data quality varied between registries (available online
34
),
but was high overall: very few records were excluded with a
major error. Exclusions for major errors were high in Cam-
pinas, Brazil (26–47%). The overall proportion of patients
who died within 1 month of diagnosis was low for breast
cancer (2·3%) and prostate cancer (3·2%), but higher for
colon (10·9%) and rectal cancers (7·8%). These values
varied between registries, but the overall pattern is plaus-
ible; up to a third of colorectal cancers present as an emer-
gency with bowel obstruction. Fewer than 1% of patients
were censored from the analysis within 5 years of
diagnosis.
Three registries were excluded after quality control,
because of high losses to follow-up or inefficient regional
or national linkage of information on the deaths of patients
with cancer. The data for three other registries, Cuba,
Campinas (Brazil) and, for prostate cancer, Michigan State
Articles
www.thelancet.com/oncology Published online July 17, 2008 DOI:10.1016/S1470-2045(08)70179-7
21
(USA), are less reliable than those from other registries,
although for different reasons, discussed below. As with
the first global compilation of cancer incidence data, in the
1960s, retention of the two registries from Central and
South America was partly prompted by the paucity of
information on cancer survival from that region: “in this
situation, even incomplete data have value”.
64
Overall, the exclusion of DCO registrations accounted
for only 1% (9215) of the eligible records for breast cancer,
3% (13 102) for colon cancer, 1% (3213) for rectal cancer, and
2% (11 163) for prostate cancer (available online
34
). The per-
centage was less than 1% in Algeria, USA, Canada, and
Australia, and in the range 0–5% in most European coun-
tries and in Brazil, but higher in Osaka (Japan; 5–22%),
79
south Thames (UK); 10–16%), and Cuba (28–60%).
80
The proportion of DCOs is not particularly useful as a
comparative index of data quality,
81
but a high proportion
of DCO records does suggest that routine data-collection
systems might not be complete. The relevance of this
index also varies with the system of data collection.
Sweden does not use DCOs because the registration of
patients with cancer at the time of diagnosis is close to
100%; by contrast, hospitals in Cuba are not allowed
to retain the clinical records of deceased persons for more
than 5 years.
80
The different proportions of DCO records are unlikely to
explain the differences in survival between Europe and
North America, however. The survival of patients whose
tumour is registered as a DCO is generally lower than the
mean for all registered cancer patients,
82
so if they could
have been included, the transatlantic differences in survival
would have been slightly greater. Furthermore, most DCO
records in the European data are for patients aged 75 years
or over,
43
where the survival differences are in any case
more marked.
9
By contrast, if a high proportion of DCO
records is taken to suggest under-registration of long-term
survivors, this might produce lower survival estimates.
Adjustment for both DCOs and incompleteness of
registration in Thames (UK) and Finland had surprisingly
little effect on survival, however, even when 10–20% of
registrations were DCOs, because the two corrections
tended to off-set one another.
83
Under-reporting of incident
tumours by up to 5% has been shown not to affect
international comparisons of survival greatly.
84
A plateau was imposed on the relative survival curve at
some point during the first 5 years after diagnosis in about
7% of the 6500 age-specific survival estimates by registry,
cancer, sex, and race (data not shown). The effect on the
age-standardised survival estimates at national level was
almost always less than 1%.
Diagnostic variability between pathologists might contri-
bute to international differences in cancer survival. Thus,
survival from colorectal cancer in Japan is among the highest
reported here, especially for men. In western countries,
invasive colorectal carcinoma is diagnosed when neoplastic
tissue invades beyond the submucosa of the bowel. Severe
cytological or architectural changes confined to the mucosa
(in situ or intramucosal carcinoma) have no metastatic
potential, and are often labelled high-grade dysplastic aden-
oma. Japanese pathologists rely more on cytological fea-
tures, however, and do not consider evidence of invasion
into the submucosal layer as a mandatory requirement for
the diagnosis of colorectal carcinoma.
85
Pathological practice
on this issue might vary substantially between western
pathologists. Islands of dysplastic tissue might also be
displaced or herniated beyond the muscularis mucosae
without implying invasive potential (pseudo-invasion), and
differential diagnosis can be very difficult.
86,87
Assessment of the extent to which international survival
differences might be attributable to differences in the
pathological definition of disease would need blinded
review of pathological diagnoses of a sample of patients by
an international panel of expert pathologists. Such reviews
are invaluable, but rare.
88
Survival in Sétif (Algeria) was the lowest of all the popu-
lations in the CONCORD study for each cancer. Even though
the dataset was small, and covers only 4% of the national
population, there is little doubt that survival in Algeria is
very low. The age distribution of patients was younger than
in most populations (available online
34
) and it cannot
explain the low overall survival. Survival in Sétif was similar
to or even lower than survival in blacks diagnosed during
1993–97 in Harare, the Zimbabwean capital, where the very
low survival was attributed to inadequate access to facilities
for early diagnosis, clinical investigation, and treatment.
89
Survival in the two Brazilian registries was generally low,
although rectal-cancer survival in Goiânia was close to the
European mean. Data quality issues prevented the
inclusion of data from three of the 20 population-based
registries in state capitals: these registries should be used
to provide a broader picture of cancer survival in Brazil.
Relative survival reported here for patients with cancer
diagnosed in Cuba during 1990–94 was about 20% higher
than estimates for those diagnosed during 1988–89, just a
few years earlier.
80
Cancer survival for children diagnosed
in Cuba during 1988–89 was lower than in more developed
countries.
90
The high proportion of DCOs in the 1988–89
data was considered less likely to be biased with respect to
survival than in other registries, because of the way data
were collected,
80
but the survival estimates for Cuba
reported here are still likely to be considerably inflated, and
should be interpreted accordingly.
National estimates of survival for patients with cancer
diagnosed in Japan during 1993–96 were slightly higher
than the estimates for 1990–94 reported here.
79
They were
based on data from seven prefectures, including the three
reported here (Yamagata, Fukui, and Osaka). As in the
CONCORD data, survival in Osaka was generally lower
than the mean survival for Japan.
Variation in survival between the provinces of Canada
and the states and territories of Australia was generally
small, and overall survival was high: this suggests health
care of a high standard in most areas. Variation between
the countries of Europe was much wider.
Articles
22
www.thelancet.com/oncology Published online July 17, 2008 DOI:10.1016/S1470-2045(08)70179-7
The substantial differences in survival between Australia
and the UK have been noted before.
91
They are unlikely to
be because of differences in data quality. For breast cancer,
survival from both localised and regional disease was
higher in Australia, but survival from metastatic disease
was similar. Elderly women in England had especially poor
survival. More effective treatment in Australia is a plausible
explanation.
92
Comparisons of cancer survival between Europe and the
USA since 2000 have identified wide differences, with
survival usually higher in the USA.
9
Closer assessment of
these differences with more detailed data, not routinely
collected by all registries, has enabled the explanatory effect
of clinical variables such as stage at diagnosis, investigative
approach, anatomical site, and morphology to be quantified
for colorectal cancer
12,93
and breast cancer,
10
and for a range
of cancers in children.
11
In those studies, the USA has
always been represented by data from the SEER Program
registries, representing some 10% of the US population at
that time, because no other data have been available. The
availability of data from a large number of state-wide
population-based cancer registries that began operation
around 1990, and meet data quality standards comparable
with those of the SEER registries, now enables a larger
proportion of the US population to be included in national
and international comparisons of cancer survival. The
CONCORD study provided the first opportunity for
the cancer registries of 11 US states in the NPCR to follow
up all their patients for vital status and to undertake
analyses of cancer survival, and 42% of the US population
is included in these analyses.
The survival differences between US and European
patients with cancer, especially in the oldest patients, seem
unlikely to be attributable to artefacts of cancer registration.
The CONCORD study has nonetheless identified two
methodological issues that probably do explain some of
the well-known differences in survival between Europe
and the USA, from which only SEER data have been
available until now.
First, relative survival was about 2–4% higher in SEER-9
areas than in participating NPCR areas of the USA.
Consequently, cancer survival in the 42% of the US
population covered by the CONCORD study was 1–3%
lower than survival in the SEER areas alone (10% of the
US population). Direct estimation of cancer survival for
other areas of the USA would be desirable.
Second, census-derived US national life tables give
higher estimates of all-cause mortality than are noted in
the SEER areas, especially with the gradual decline of
mortality in the decade after a census.
46
Use of census-
derived national life tables to estimate relative survival
(the SEER approach) therefore produces estimates that
are almost always higher than those obtained with state-
specific life tables for each calendar year in the decade
(CONCORD approach), which we believe to be more
appropriate because it provides tighter control for
changes over time in background mortality. With the
CONCORD approach, age-standardised 5-year survival
in the 22 participating areas of the USA was up to 3%
lower than with the SEER approach for breast cancer in
women, up to 4% lower for colorectal cancer, and up to
5% lower for prostate cancer (available online
34
).
The differences in cancer survival between blacks and
whites of both sexes in the USA are large, and remarkably
consistent in 16 states and six metropolitan areas—more
populations than it has been possible to study in the past.
94
The differences were adjusted for age and for differences
in background mortality between blacks and whites within
each state or metropolitan area. It would be interesting to
know if the differences were attributable to artefact, or
differences between blacks and whites in tumour biology,
in stage at diagnosis, in access to health care, or in com-
pliance with treatment. The survival differences seen in
this study are consistent with those in other studies.
47–53
Data-collection systems were identical for all races. The
black–white differences in relative survival that we report
would have been even larger if we had used race-specific
national life tables instead of race–state life tables, because
background mortality is higher (and expected survival
lower) in blacks than in whites in all the populations
studied.
23,95
Survival from cancers of the breast, colorectum, and
prostate varied with the type of health insurance in a
population-based study:
96
survival was highest in patients
who had private insurance, intermediate with federal
insurance, and lowest with no insurance. Another study
97
suggested that prostate cancer is not more biologically
aggressive in blacks than whites. Late stage,
98
less treat-
ment, and higher mortality seem to be associated with
black race, low socioeconomic status, and poor survival in
the USA.
99–101
Extensive reviews have led to the conclusion
that racial disparities in cancer treatment, which are not
explained by clinical factors, lead to worse outcomes in
blacks.
102,103
Analysis of SEER data suggested that some
racial differences in treatment and cause-specific survival
persist after adjustment for poverty.
104
By contrast, the racial
difference in survival from colorectal cancer was almost
absent in patients managed under the equal-access,
integrated health-care Veterans’ Affairs system.
105
Finally,
overviews of race, socioeconomic status, and cancer
outcomes strongly suggest that equal treatment yields
equal outcome, irrespective of race.
53,106
The data presented
here extend the evidence that cancer survival in the USA is
lower in blacks than in whites.
Simple ranking of countries by overall survival can be
misleading. Survival is very similar in many European
countries, at the centre of the global range, and a small
shift in the survival estimate in either direction can entail a
large change in the rank. Thus, even the national survival
estimates for Iceland and Malta have wide confidence
intervals and unstable rankings because they are based on
populations of around 250 000 (figures 1 and 3). The
detailed data by country and region are tabulated by
continent, country, and region, rather than ranked: some
Articles
www.thelancet.com/oncology Published online July 17, 2008 DOI:10.1016/S1470-2045(08)70179-7
23
estimates, based on sparse data, could not be age-
standardised (table 2).
The numbers of patients included in the analysis varied
widely, as did the proportion of the national population
covered by the data. These proportions affect the extent to
which the survival estimates can be deemed representative
of the country concerned. For example, in Algeria, Brazil,
and Germany, only 1–4% of the national populations were
covered by the data. Population coverage of participating
registries in Italy was about 15%, but they were concentrated
in the wealthier north of the country.
22,30
The same point
also applies to the USA, however, because the data pre-
sented here confirm suggestions
107
that cancer survival in
the SEER Program areas (10% population coverage during
the 1990s) was higher than in other parts of the country. By
contrast, regional variation in survival in Australia and
Canada was much less marked than in the USA. Similarly,
survival for 1990–94 in the four French départements
reported here (6% national coverage) was high on the
European scale for most cancers,
27
and a much larger study
for the same period in 14 départements (20% coverage)
showed similar patterns of survival.
108,109
For countries with more than one contributing registry
but less than 100% population coverage, we have
presented estimates of survival derived from the pooled
data, not weighted means of the regional estimates of
survival. The question of whether pooled survival esti-
mates derived from regional registries with less than
100% national coverage can properly be considered
representative of cancer survival in the whole country has
been discussed elsewhere.
22
If population-based estimates
of cancer survival are deemed reliable, however, they do
suggest a potentially achievable level of survival, irrespec-
tive of whether the estimate is for a whole country or only
one region in that country. Regional variation in survival
within a country tends to prompt efforts to improve
survival in regions where it is low. The same argument
should apply on an international scale. This has already
happened in Europe.
110
No overall worldwide estimate for cancer survival has
been presented. The proportionate contributions from
each continent to the CONCORD study are very different
from the worldwide distribution of cancers of the breast,
colon, rectum, and prostate. The national data for Australia
alone represented 63% of the population of Oceania in
1995,
111
and the survival estimates for North America
included 44% of the combined populations of USA and
Canada around 1992, but for Africa, Asia, and South
America, the population coverage of these data was much
lower. The survival data for Europe were based on 25% of
the continental population of 512 million in 1992,
112
but the
EUROCARE study (ongoing since 1989) is the largest and
most widely cited international study of cancer survival,
and all 57 cancer registries in that study, and six others,
contributed to CONCORD. To provide an international
summary measure of cancer survival for visual comparison,
we therefore used the overall estimates for 23 countries in
EUROCARE-3, but age-standardised to the ICSS weights
used in CONCORD, instead of the weights used in
EUROCARE-3.
113
We have presented pooled estimates of
survival for Europe and North America (table 3), but not
for other continents.
The size of the population covered by the data affects the
statistical precision of the survival estimates. This is
shown by 95% CIs, but ranked graphics do not provide
visual appreciation of the extent to which the survival
estimate for a given country or region falls outside the
distribution of survival estimates that might be expected,
under the hypothesis that survival should be the same in
all areas. In that situation, regional variation in relative
survival should arise only from random variation around
some underlying average. We used funnel plots
62
to
provide that visual effect for geographical and racial
variation in survival in the USA, with the target value as
the pooled estimate for the USA, age-standardised to the
ICSS weights.
60
These plots display striking geographical
and racial variation in survival.
Clinical practice has continued to evolve in the 15 years
or so since the patients included in this study were
diagnosed. Changes in diagnosis, screening, and treatment
have undoubtedly improved the prognosis for cancer
patients, at least in wealthier countries.
Survival has increased substantially for cancers of
the breast (women), colon, rectum, and prostate in the
17 areas of the USA covered by the SEER Program during
1996–2003,
114
and in Canada (1996–98)
115
and Australia
(1994–2004).
116,117
Smaller increases have been reported in
11 of the 47 Japanese prefectures.
118
These estimates of
relative survival, published for national purposes, cannot
be compared with the data reported here, however, because
of differences in the quality control of incidence data or
completeness of follow-up, and in methods of analysis.
Some estimates were not age-standardised for international
comparison, whereas others were standardised to country-
specific age weights, rather than the ICSS age weights that
we used.
The only recent international study of cancer survival is
EUROCARE-4, which included patients diagnosed in
23 countries during all or part of 1995–2002 and followed
up to 2003.
29,30
Survival increased substantially in eastern
European countries, where it was much lower than in
other parts of Europe during 1990–94. This narrowing of
the east–west gap suggests substantial improvements in
cancer care. The rise in breast cancer survival in several
countries was associated with a fall in mortality, possibly
because of improved care and screening programmes; the
rise in prostate-cancer survival (and incidence) might be a
result of more widespread PSA testing. In western Europe,
survival in the UK and Denmark was still low for several
cancers in the late 1990s.
CONCORD is, by chance, reasonably well-timed to
provide a baseline for international comparisons of
cancer survival to assess the effect of several major
public health initiatives for the control of breast,
Articles
24
www.thelancet.com/oncology Published online July 17, 2008 DOI:10.1016/S1470-2045(08)70179-7
colorectal, and prostate cancers. In 1990, mass
population screening for breast cancer with
mammography was beginning in many (but not all)
participant countries. At that time, intense early
diagnostic activity with prostate-specific antigen (PSA)
had recently become widespread in the USA, but was
little used elsewhere. In Denmark, for example, the 50-
year increase in prostate cancer incidence is considered
real,
119
but the Danish Society for Urology assessed the
evidence in 1990
120
and decided not to advocate PSA
testing in asymptomatic men, because the therapeutic
benefit was very small;
121
only symptomatic patients
were offered treatment. Mass screening for colorectal
cancer with faecal occult blood (FOB) testing or
endoscopy had not begun during 1990–94 in any
contributing country as far as we are aware. Opportunistic
screening with the FOB test began in Japan in 1992; by
2004, about 20% of people aged 40 years or over had
been tested within the previous year.
122
Opportunistic
endoscopy had already become widespread in some
parts of the US population by 1990.
The CONCORD study was planned in three phases. The
study reported here (phase I, low resolution) was designed
to quantify international differences in population-based
relative survival by age, sex, country, or region for patients
diagnosed during 1990–94 with a cancer of the breast,
colon, rectum, or prostate. Phase II (high resolution) was
designed to help interpret those international differences
in survival, by use of a subset of registries that could re-
abstract detailed clinical data, including stage at diagnosis
and treatment, from the original medical records for large
random samples of patients diagnosed with one of the
same cancers during 1996–98. Findings will be reported in
due course. Phase III was designed as a blinded, expert
review of the pathological diagnosis for a subset of patients
from the phase II study, to assess the extent to which
international survival differences might be attributable to
differences in the pathological definition of disease in
participating countries.
The range of survival estimates for each cancer is very
wide. Population-based cancer registries are increasingly
important in the comparative assessment of cancer
outcomes,
123
and even allowing for differences in data
quality or statistical robustness, there is little doubt that the
chances of survival after a cancer diagnosis vary hugely on
a global scale.
The comparability of cancer survival estimates between
countries is criticised far more often than the comparability
of cancer incidence data from the same registries. There is
no statistical basis for this distinction. National sensitivities
about cancer survival seem to be much greater than
sensitivities about cancer incidence. Cancer survival is a
measure of the overall effectiveness of cancer treatment
services, whereas cancer incidence is a measure of the
long-term effect of prevention policies, which are less
visible on a day-to-day basis and can, incorrectly, be seen as
less important.
Cancer survival is a valuable indicator for international
comparison of progress in cancer control,
76,124,125
despite the
fact that part of the variation in cancer survival identified in
this study could be attributable to differences in the
intensity of diagnostic activity (case-finding) in participating
populations. Notably, the very same point applies to
international comparisons of cancer incidence. If over-
diagnosis—which depends on diagnostic intensity—is
more marked in one country than another, then it will
certainly be harder for researchers to compare incidence,
mortality, and survival in those countries. But over-diag-
nosis has different connotations for health-care systems
and patients. In each country, the health-care system will
have to be funded, staffed, and equipped to cope with the
diagnostic and therapeutic burden of all patients with
cancer, however they are diagnosed. The health-care
system must make provision accordingly, and monitor the
outcome of that provision; cancer survival is one such
overall indicator.
Furthermore, a patient with cancer is still a patient with
cancer, whether or not they represent over-diagnosis. If it
were possible to distinguish the one from the other reliably,
it would be done routinely. As it is, a cancer diagnosis
represents the best that medicine has to offer in a given
country at a given time, and that best is variable. PSA
testing for prostate cancer is an example. No matter how a
patient with cancer is diagnosed, they have to cope with
the consequences, both psychological and physical, and
will usually want to be treated. Such patients cannot be
excluded from either incidence or survival analyses. We do
not know who they are. In this sense, cancer incidence and
survival estimates describe as accurately as possible the
occurrence and the outcome, respectively, of cancer as it is
diagnosed and treated at a given time in a given
population.
Most of the wide global range in survival is probably
attributable to differences in access to diagnostic and
treatment services.
3,82,89,91,126
International variation in
survival in Europe has been associated with national levels
of economic development, as measured by total national
expenditure on health.
29
Survival is positively associated
with gross domestic product and the amount of investment
in health technology such as CT scanners.
124
Part of the
international variation in survival is thus probably
attributable to under-investment in health resources.
127,128
The variation in survival might be considered intuitively
obvious, given wide global variation in expenditure on
health care, whether that is expressed in absolute terms or
as a proportion of national resources. A parallel could be
drawn with differences in survival between rich and poor
patients with cancer in a given country, which have
frequently been reported.
129,130
Until now, however, direct international comparisons of
cancer survival between high-income and low-income
countries have not generally been available. The infor-
mation provided here might therefore be a useful stimulus
for change.
Articles
www.thelancet.com/oncology Published online July 17, 2008 DOI:10.1016/S1470-2045(08)70179-7
25
Contributors
All authors were involved in the study design. JML, MPC, GG, and
MSant undertook the pilot study. RC, SF, RdA, MSantaquilani, MQ, GG,
MSant, FB, JML, TH, SK, and AV were involved in data preparation and
quality control. MQ, RdA, BR, FB, PB, TH, JLY, and MPC did the data
analyses. MPC, FB, JLY, TH, HW, JML, MQ, BR, RdA, AM, PB, JME, SK,
GAS, and HHS contributed to interpretation of findings. MPC, MQ, BR,
FB, PB, HW, JLY, JML, TH, AM, GG, MSant, GAS, HHS, and HT
drafted the report. All authors revised the report.
Conflicts of interest
The authors declared no conflicts of interest.
Acknowledgments
We are grateful to the many cancer registry staff around the world whose
meticulous and sustained efforts at data collection, linkage, and quality
control have enabled the survival of patients to be analysed and compared
in this study. We thank Dee Bhakta and Adrian Cousins (London School
of Hygiene and Tropical Medicine, London, UK) for help in undertaking
the pilot study and for producing webfigure 1, respectively. The findings
and conclusions in this report are those of the authors and do not
necessarily represent the views of the US CDC.
References
1 Hakulinen T. A comparison of nationwide cancer survival statistics
in Finland and Norway. World Health Stat Q 1983; 36: 35–46.
2 Engeland A, Haldorsen T, Dickman PW, et al. Relative survival of
cancer patients: a comparison between Denmark and other Nordic
countries. Acta Oncol 1998; 37: 49–59.
3 Gorey KM, Holowaty EJ, Laukkanen E, Fehringer G, Richter NL.
An international comparison of cancer survival: advantage of
Toronto’s poor over the near-poor of Detroit. Rev Canad Santé Publ
1998; 89: 102–04.
4 Sankaranarayanan R, Black RJ, Parkin DM, eds. Cancer survival in
developing countries. Lyon: IARC Scientific Publications No 145,
1998.
5 Verdecchia A, Mariotto A, Gatta G, Bustamente-Teixeira MT,
Ajiki W. Comparison of stomach cancer incidence and survival in
four continents. Eur J Cancer 2003; 39: 1603–09.
6 Coleman MP, Babb P, Damiecki P, et al. Cancer survival trends in
England and Wales 1971-1995: deprivation and NHS Region.
(Studies on Medical and Population Subjects No 61).
London: The Stationery Office, 1999: 55–106.
7 Sant M, EUROCARE Working Group. Overview of EUROCARE-2
results on survival of cancer patients diagnosed 1985-89. In:
Berrino F, Capocaccia R, Estève J, et al, eds. Survival of cancer
patients in Europe: the EUROCARE-2 study. Lyon: IARC Scientific
Publications No 151, 1999: 525–41.
8 SEER*Stat—cancer incidence public use database 1973–95.
Version 1.1. Bethesda, MD: National Cancer Institute, 1998.
9 Gatta G, Capocaccia R, Coleman MP, et al. Toward a comparison of
survival in American and European cancer patients. Cancer 2000;
89: 893–900.
10 Sant M, Allemani C, Berrino F, et al. Breast carcinoma survival in
Europe and the USA: a population-based study. Cancer 2004;
100: 715–22.
11 Gatta G, Capocaccia R, Coleman MP, Gloeckler Ries LA, Berrino F.
Childhood cancer survival in Europe and the United States.
Cancer 2002; 95: 1767–72.
12 Gatta G, Ciccolallo L, Capocaccia R, et al. Differences in colorectal
cancer survival between European and US populations: the
importance of sub-site and morphology. Eur J Cancer 2003;
39: 2214–22.
13 McDavid K, Schymura MJ, Armstrong L, et al. Rationale and design
of the National Program of Cancer Registries’ Breast, Colon, and
Prostate Cancer Patterns of Care Study. Cancer Causes Control 2004;
15: 1057–66.
14 Allemani C, Sant M, De Angelis R, Marcos-Gragera R,
Coebergh JWW, EUROCARE Working Group. Hodgkin disease
survival in Europe and the US: prognostic significance of
morphologic groups. Cancer 2006; 107: 352–60.
15 Capocaccia R, Sant M, Berrino F, et al. Hepatocellular carcinoma:
trends of incidence and survival in Europe and the United States at
the end of the 20th Century. Am J Gastroenterol 2007; 102: 1661–70.
16 Sant M, Allemani C, De Angelis R, et al. Influence of morphology
on survival for non-Hodgkin lymphoma in Europe and the United
States. Eur J Cancer 2008; 44: 579–87.
17 Cutler SJ, ed. International symposium on end results of cancer
therapy. NCI Monograph 15. Bethesda MD: National Cancer
Institute, 1964.
18 Berkson J, Gage RP. Calculation of survival rates for cancer.
Proc Staff Meet Mayo Clinic 1950; 25: 270–86.
19 Cutler SJ, Ederer F. Maximum utilisation of the life table method in
analyzing survival. J Chron Dis 1958; 8: 699–712.
20 Ederer F, Axtell LM, Cutler SJ. The relative survival: a statistical
methodology. Natl Cancer Inst Monogr 1961; 6: 101–21.
21 Farrow DC, Samet JM, Hunt WC. Regional variation in survival
following the diagnosis of cancer. J Clin Epidemiol 1996; 49: 843–47.
22 Coleman MP, Gatta G, Verdecchia A, et al. EUROCARE-3
summary: cancer survival in Europe at the end of the 20th century.
Ann Oncol 2003; 14 (suppl 5): 128–49.
23 Coleman MP, Babb P, Damiecki P, et al. Cancer survival trends in
England and Wales 1971–1995: deprivation and NHS Region.
(Studies on Medical and Population Subjects No. 61).
London: The Stationery Office, 1999: 1–695.
24 EUROCARE Working Group. Publications from the EUROCARE
study. EUROCARE Working Group.
(accessed June 15, 2007).
25 Berrino F, Sant M, Verdecchia A, Capocaccia R, Hakulinen T,
Estève J, eds. Survival of cancer patients in Europe: the EUROCARE
study. Lyon: IARC Scientific Publications No 132, 1995.
26 Berrino F, Capocaccia R, Estève J, et al, eds. Survival of cancer
patients in Europe: the EUROCARE-2 study. Lyon: IARC Scientific
Publications No 151, 1999.
27 Sant M, Aareleid T, Berrino F, et al. EUROCARE-3: survival of
cancer patients diagnosed 1990–94—results and commentary.
Ann Oncol 2003; 14 (suppl 5): 61–118.
28 Berrino F, Capocaccia R, Coleman MP, et al, eds. EUROCARE-3:
the survival of cancer patients diagnosed in Europe during 1990–94.
Ann Oncol 2003; 14 (suppl 5): 1–155.
29 Berrino F, De Angelis R, Sant M, et al. Survival for eight major cancers
and all cancers combined for European adults diagnosed in 1995–99:
results of the EUROCARE-4 study. Lancet Oncol 2007; 8: 773–83.
30 Verdecchia A, Francisci S, Brenner H, et al. Recent cancer survival
in Europe: a 2000–02 period analysis of EUROCARE-4 data.
Lancet Oncol 2007; 8: 784–96.
31 Parkin DM, Whelan SL, Ferlay J, Raymond L, Young JL, eds. Cancer
incidence in five continents, volume VII. Lyon: IARC Scientific
Publications No 143, 1997.
32 Chen VW, Wu XC, Andrews PA, eds. Cancer in North America
1991–1995, Vol 1. Incidence. Sacramento, CA: North American
Association of Central Cancer Registries, 1999.
33 Coleman MP, Berrino F, Capocaccia R, et al. The CONCORD
protocol (rev. 2001). CONCORD Steering Committee.
/>CONCORD%20Protocol.pdf (accessed July 3, 2008).
34 CONCORD Working Group. CONCORD study. Cancer Research
UK Cancer Survival Group. />cancersurvival/concord/phase1/index.htm (accessed July 3, 2008).
35 United Nations. Countries and states by UN region. United
Nations.
(accessed July 3, 2008).
36 US Cancer Statistics Working Group. United States Cancer
Statistics: 2004 Incidence and Mortality. Atlanta GA: US
Department of Health and Human Services, Centers for Disease
Control and Prevention and National Cancer Institute, 2007.
37 National Cancer Institute. Surveillance research. National Cancer
Institute. />html (accessed July 3, 2008).
38 National Cancer Institute. Incidence—SEER 9 public-use data,
2002: cases diagnosed 1973–2000. National Institutes of Health.
www.seer.cancer.gov/seerstat (accessed July 3, 2008).
39 World Health Organization. International Classification of
Diseases, 1975, 9th revision. Geneva: WHO, 1977.
40 World Health Organization. International Classification of
Diseases for Oncology (ICD-O). Geneva: World Health
Organization, 1976.