Monetary Policy Actions and Long-Term Interest Rates doc
Bạn đang xem bản rút gọn của tài liệu. Xem và tải ngay bản đầy đủ của tài liệu tại đây (142.05 KB, 17 trang )
Monetary Policy Actions
and Long-Term Interest Rates
By V. Vance Roley and Gordon H. Sellon, Jr.
I
t is generally believed that monetary policy
actions are transmitted to the economy through
their effect on market interest rates. According
to this standard view, a restrictive monetary policy
by the Federal Reserve pushes up both short-term
and long-term interest rates, leading to less spend-
ing by interest-sensitive sectors of the economy
such as housing, consumer durable goods, and busi-
ness fixed investment. Conversely, an easier policy
results in lower interest rates that stimulate eco-
nomic activity.
Unfortunately, this description of the monetary
policy process is difficult to reconcile with the
actual behavior of interest rates. Although casual
observation suggests a close connection between
Federal Reserve actions and short-term interest
rates, the relationship between policy and long-term
interest rates appears much looser and more vari-
able. In addition, empirical studies that attempt to
measure the impact of policy actions on long-term
rates generally find only a weak relationship. Taken
together, the empirical studies and the observed
behavior of interest rates appear to challenge the
standard view of the monetary transmission mecha-
nism and raise questions about the effectiveness of
monetary policy.
This article attempts to reconcile theory and real-
ity by reexamining the connection between mone-
tary policy and long-term interest rates. Using a
framework that emphasizes the importance of mar-
ket expectations of future monetary policy actions,
the article argues that the relationship between pol-
icy actions and long-term rates is likely to vary over
the business cycle as financial market participants
alter their views on the persistence of policy actions.
Accordingly, the standard view of the monetary
transmission mechanism appears to provide an
overly simplistic view of the policy process. In
addition, by capturing the tendency of market rates
to anticipate policy actions, the article finds a larger
response of long-term rates to monetary policy than
reported in previous research.
The first section of the article describes the stand-
ard view of the monetary transmission mechanism
and examines its consistency with actual interest
rate behavior. The second section uses the expecta-
tions theory of the term structure to show how the
impact of monetary policy on long-term rates de-
pends on market expectations about the future di-
V. Vance Roley is the Hughes M. Blake Professor of Business
Administration at the University of Washington, and a visit-
ing scholar at the Federal Reserve Bank of Kansas City.
Gordon H. Sellon, Jr., is an assistant vice president and
economist at the bank. The authors would like to thank Craig
Hakkio and Charles Morris for comments. Doug Rolph, a
research associate at the bank, assisted in the preparation of
the article.
rection of policy. The third section presents new
empirical estimates of the relationship between pol-
icy actions and long-term rates.
MONETARY POLICY AND
LONG-TERM RATES: THEORY VS.
REALITY
The standard view of the monetary policy trans-
mission mechanism suggests a close relationship
between Federal Reserve policy actions and market
interest rates. However, while there is considerable
evidence that monetary policy has predictable ef-
fects on short-term rates, the connection between
policy actions and long-term rates appears to be
weaker and less reliable.
The monetary transmission mechanism
Changes in the stance of monetary policy take
place in the market for reserves held by depository
institutions. The Federal Reserve can alter the sup-
ply of reserves either by using open market opera-
tions to buy or sell government securities or by
altering the amount of reserves borrowed through
the discount window. Providing fewer reserves than
desired by depository institutions puts upward pres-
sure on the price of reserves—the federal funds
rate—while supplying more reserves than institutions
desire puts downward pressure on the funds rate.
In recent years, the Federal Reserve has imple-
mented monetary policy by using open market op-
erations to maintain a desired level of the federal
funds rate (Lindsey). This “short-run operating tar-
get” is derived from longer term objectives for price
stability and economic activity, and is adjusted
when the Federal Reserve believes the stance of
policy should be altered to better achieve its long-
run objectives (Davis, Meulendyke). For example,
in a period of moderate economic growth and low
inflation, the Federal Reserve may keep the desired
federal funds rate unchanged for a considerable
period of time. However, in the event of stronger
economic activity and higher inflation the Federal
Reserve may tighten policy by reducing reserve
growth to push the federal funds rate up to a new
and higher desired level.
Although the Federal Reserve can directly influ-
ence the reserves market and the federal funds rate,
to affect economic activity, monetary policy must
also be able to alter the entire spectrum of short-
term and long-term interest rates. The standard view
of the monetary transmission mechanism relies on
a simple version of the expectations theory of the
term structure of interest rates. In this theory, long-
term rates are an average of current short-term rates
and expected future short-term rates. Monetary pol-
icy affects long-term rates to the extent that it
influences current and expected short-term rates.
In the standard view of the transmission mecha-
nism, the relationship between policy actions and
long-term rates is assumed to be straightforward.
An increase in the desired level of the federal funds
rate causes current short-term rates and expected
future short-term rates to rise, which pushes up
interest rates across all maturities. Similarly, a de-
crease in the desired funds rate causes current and
expected future short-term rates to fall and leads to
lower short-term and long-term rates.
Evidence on the relationship between policy
actions and interest rates
In the standard view of the monetary transmission
mechanism, monetary policy actions are expected
to have a strong, positive effect on long-term rates.
In contrast to this theory, the actual relationship
between policy actions and long-term rates appears
weaker and more variable.
Casual observation suggests the Federal Re-
serve’s ability to influence interest rates diminishes
as the maturity of the security lengthens. In the
overnight market for reserves, for example, the
Federal Reserve achieves close control over the
74 FEDERAL RESERVE BANK OF KANSAS CITY
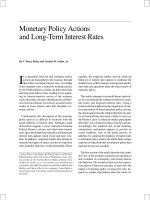
federal funds rate. Chart 1 compares an estimate of
the Federal Reserve’s desired value for the federal
funds rate and the observed daily funds rate over a
recent period of monetary policy actions, from the
beginning of 1994 through July 1995.
1
The esti-
mated funds rate target is shown as the darker line.
Beginning in February 1994, the funds rate target
was raised in a series of seven steps from 3 percent
to 6 percent and was then lowered to 5.75 percent
in July 1995. While the actual federal funds rate
shown in the chart is very volatile on a daily basis,
it follows the funds rate target closely over time,
suggesting the trend in the funds rate is largely
determined by policy actions.
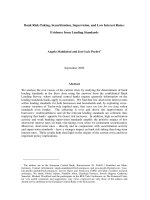
Other short-term rates also show a close relation-
ship to the estimated funds rate target. Although the
3-month bill rate deviates occasionally from the
estimated funds target over this recent period, it still
follows the target quite closely (Chart 2). As shown
in the chart, the principal difference between the
3-month rate and the funds rate target over this
period is the tendency for the bill rate to move up
or down somewhat in advance of policy actions.
In contrast, the connection between long-term
rates and the funds rate target appears to be much
looser. As shown in Chart 2, in the early stages of
the recent policy tightening, the 30-year Treasury
bond rate first rose much faster than the funds target.
Then, in the latter part of 1994 and early 1995, the
30-year rate actually declined substantially while
the funds target continued to rise. While the reaction
of long-term rates in the beginning of 1994 was
2
8
6
5
4
1994
RELATIONSHIP BETWEEN FEDERAL FUNDS RATE AND
FUNDS RATE TARGET
Chart 1
Percent
7
Federal funds rate
3
1995
Funds rate target
ECONOMIC REVIEW • FOURTH QUARTER 1995 75
considerably greater than expected, the downward
trend of long-term rates at the end of 1994 and early
1995 was exactly opposite to that suggested by the
standard view of the transmission mechanism.
2
More sophisticated empirical analysis of the re-
lationship between policy actions and interest rates
also casts doubt on the standard view. For example,
studies by Cook and Hahn (1989b) and by Radecki
and Reinhart examined the response of short-term
and long-term rates to changes in a measure of the
funds rate target in the days surrounding policy
actions.
3
Using a similar approach, Dale measured
the short-run response of UK market rates to mone-
tary policy actions by the Bank of England. Al-
though all three studies found that policy actions
have a significant positive effect on interest rates of
all maturities, these effects decline as maturity
lengthens. Indeed, the estimated response of long-
term rates to policy actions in these studies is ex-
tremely small. For example, long-term rates
increase only four to ten basis points in response to
a 100-basis-point increase in the interest rate target
in the days surrounding the policy change. The
small estimated effect of policy actions on long-
term rates found in these studies is difficult to
reconcile either with the actual behavior of long-
term rates shown in Chart 2 or with the standard
view of the transmission mechanism. If these esti-
mates are accurate, the influence of monetary policy
actions on long-term interest rates would appear to
be very limited.
6
4
3
2
1994
RELATIONSHIP BETWEEN MARKET RATES AND FUNDS RATE TARGET
Chart 2
Percent
5
1995
8.0
Percent
7.5
7.0
8.5
6.0
6.5
3-month T-bill rate
(left scale)
Funds rate target
(left scale)
30 year T-bond rate
(right scale)
76 FEDERAL RESERVE BANK OF KANSAS CITY
THE ROLE OF EXPECTATIONS IN
THE MONETARY TRANSMISSION
MECHANISM
Reconciling the actual behavior of long-term in-
terest rates with the standard view of the monetary
transmission mechanism requires a framework for
understanding how policy actions affect the term
structure of interest rates. The expectations theory
of the term structure suggests that monetary policy
affects long-term rates by directly influencing
short-term rates and by altering market expectations
of future short-term rates. In this framework, there
is no simple relationship between policy actions and
long-term rates. Rather, the reaction of long-term
rates to policy actions can be highly variable de-
pending on changing views of market participants
as to the future direction of monetary policy.
The expectations theory of the term structure
In the expectations theory, long-term interest
rates are related to short-term rates through market
expectations of future short-term rates. In the sim-
plest version of the expectations theory, long-term
interest rates equal an average of current and ex-
pected future short-term interest rates. For example,
consider a simple investment opportunity in which
an investor with a two-year time horizon has the
option of buying a 1-year bond now and a second
1-year bond in one year’s time, versus the alterna-
tive of buying a 2-year bond now. Suppose further
that a 1-year bond is currently trading with an
annualized yield of 6 percent and market partici-
pants expect a new 1-year bond issued a year from
now will yield 7 percent. In this case, under the
expectations theory, the current yield on a 2-year
bond will be 6.5 percent, a simple average of the
current and expected future 1-year yields.
The reasoning behind the expectations theory is
that two equivalent investment options should have
the same expected return. If not, investors will
arbitrage away any differences. Hence, if the cur-
rent 2-year yield were 6 percent instead of 6.5
percent, investors would be reluctant to buy the
2-year bond. Rather, they would prefer holding the
1-year bond and then purchasing another 1-year
bond at the end of the first year to receive a higher
expected return. In this situation, investors would
sell the 2-year bond, thereby reducing its price and
raising its yield until the two investment strategies
have the same expected returns.
This basic approach can be easily extended to
longer term securities. For example, the current
yield on a 3-year bond will equal the average of
three rates: the current 1-year rate, the expected
1-year rate one year in the future, and the expected
1-year rate two years in the future. Similarly, the
current yield on a 30-year bond will equal the
average of the current 1-year rate and a series of 29
expected 1-year rates.
4
In this simple form of the expectations theory,
changes in a long-term interest rate can arise from
two sources: factors that change the current short-
term rate and factors that change market expecta-
tions of future short-term rates. To study the
reaction of long-term rates to monetary policy ac-
tions, measures of both current short-term rates and
expected future short-term rates must be obtained.
Unfortunately, while current short-term rates are
observable, measures of expected future rates are
not readily available.
5
In the framework of the expectations theory, esti-
mates of expected future short-term rates can be
obtained by calculating the “forward rates” that are
implied in the existing term structure. The construc-
tion of forward rates can be illustrated using the
preceding example. Suppose the observed yield on
the current 1-year bond is 6 percent, while the
2-year bond currently yields 6.5 percent. Because
the 2-year bond yield is an average of the current
1-year yield and the expected 1-year yield one year
from now, under the expectations theory the im-
plied value of the expected 1-year yield is 7 percent
ECONOMIC REVIEW • FOURTH QUARTER 1995 77
(2 x 6.5 - 6 = 7). This implied value is the one-year
ahead, 1-year forward rate. In a similar manner, the
yield of a bond of any maturity can be decomposed
into a current short-term rate and a series of forward
rates.
6
Monetary policy and long-term rates
In the framework of the expectations theory,
monetary policy can affect long-term rates by di-
rectly affecting short-term rates or by changing
forward rates. Depending on how market partici-
pants interpret policy changes, the reaction of for-
ward rates to policy changes may differ over time,
resulting in a variable response of long-term rates
to policy actions.
Policy scenarios. To see the connection between
policy actions and long-term rates, consider a sim-
plified example in which an investor has a four-year
investment horizon and the option of purchasing a
1-year, 2-year, 3-year, or 4-year security. In this
model, the 1-year security is the short-term bond,
the 2-year and 3-year securities are medium-term
bonds, and the 4-year security is the long-term
bond. This model can be used to examine the reac-
tion of the long-term rate in five stylized policy
scenarios incorporating different assumptions
about how forward rates react to anticipated policy
actions. In each scenario, current and future mone-
tary policy actions are assumed to be the only
factors influencing interest rates. The analysis
abstracts from other factors that might affect in-
terest rates by altering real interest rates or infla-
tionary expectations. The examples also ignore the
existence of a term premium or risk premium in
interest rates.
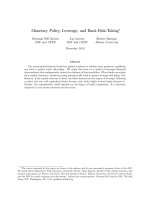
The first scenario (I) is the case of an unchanged
monetary policy in which investors foresee no
change in the funds rate target over the four-year
horizon. Suppose that the current 1-year rate is 4
percent. Because market participants believe that
policy will not change, all forward rates will be
unchanged and the term structure will be flat with
a 4 percent rate at all maturities (Chart 3).
Now consider a second scenario (II) in which a
policy action that increases the funds rate target by
1 percent also raises the 1-year rate from 4 to 5
percent. In addition, assume investors expect this
new higher rate will persist throughout the four-year
investment horizon. In this case, the one-year, two-
year, and three-year ahead, 1-year forward rates will
all rise to 5 percent, and there will be a parallel shift
in the yield curve as short-term, medium-term, and
long-term rates all move up to 5 percent (Chart 3).
Thus, if investors believe a policy action will be
persistent or permanent over the entire investment
horizon, there will be a one-for-one movement of
the funds target and the long-term rate.
7
Next consider a third scenario (III) in which the
funds rate target and 1-year rate again rise by 1
percent. In this case, however, investors interpret
the policy action as only the first stage in tightening
and so expect a further increase in the funds target
by 1 percent in the second year, followed by no
further change in years three and four. In this situ-
ation, while the current 1-year rate rises to 5 percent,
each of the three 1-year forward rates rises to 6
percent. As a result, medium-term and long-term
rates will actually increase more than short-term
rates in response to the policy action and the yield
curve will steepen (Chart 3).
8
The fourth scenario (IV) differs from the previous
ones because the initial policy action is expected to
be only temporary. That is, while the funds rate
target and 1-year rate rise by 1 percent, investors see
the policy tightening as only temporary and expect
the policy action to be offset in the next year. In this
situation, although the 1-year rate rises to 5 percent,
the three 1-year forward rates remain at 4 percent,
giving a response pattern of medium-term and long-
term rates that declines as maturity lengthens. Ac-
cordingly, medium-term and long-term rates rise
less than short-term rates in response to the monetary
78 FEDERAL RESERVE BANK OF KANSAS CITY
policy action and the yield curve becomes nega-
tively sloped (Chart 3). Note that, in this scenario,
all of the change in longer term rates comes from
the increase in the current short-term rate since all
forward rates are unchanged.
Finally, in the fifth scenario (V) the funds target
and 1-year rate again increase by 1 percent, but
investors are assumed to believe that policy tight-
ening now will not only be temporary but will also
lead to a significant easing of policy in the future.
9
In this example, forward rates one year ahead are
assumed to fall to 4 percent, then 3 percent, then 2
percent. As a result, even though the 1-year rate
increases by the full amount of the policy action, the
long-term rate actually falls as the funds target is
increased and the yield curve becomes sharply in-
verted (Chart 3).
Policy implications. The analysis of these five
policy scenarios highlights the crucial role market
expectations of future policy actions play in the
response of interest rates to monetary policy. Sev-
eral important conclusions can be drawn from these
examples.
First, the direction in which interest rates move
when policy is changed depends on investors’ views
on the likelihood of future policy actions. Most of
the scenarios give a positive response of both short-
term and long-term rates to a policy action as sug-
gested in the standard view of the transmission
No change in current or future policy.
Permanent change in policy.
Additional tightening expected in Year 2.
Temporary tightening.
Current tightening followed by future easing.
I:
II:
III:
IV:
V:
6.0
4.0
INTEREST RATE RESPONSES TO POLICY ACTIONS
Chart 3
Percent
5.0
III
3 Yr.
II
IV
V
I
1 Yr. 4 Yr.2 Yr.
ECONOMIC REVIEW • FOURTH QUARTER 1995 79
mechanism. Thus, whether policy actions are seen
as highly persistent (Scenarios II and III) or tempo-
rary (Scenario IV), long-term rates rise in response
to an increase in the funds rate target. According to
these examples, however, a negative or inverse
relationship between long-term rates and policy
actions is also possible and is entirely consistent
with the expectations theory. Such a relationship
requires that some forward rates fall in response to
an increase in the funds rate target. This pattern can
occur if investors believe a current policy action
will be fully offset and ultimately reversed in the
future.
Second, the magnitude of the response of long-
term rates to policy actions depends on the expected
persistence of policy actions. If policy actions are
seen as relatively permanent or as the first in a series
of future actions (Scenarios II and III), the change
in long-term rates may fully reflect or even exceed
the current change in the funds rate target. Con-
versely, if a policy action is viewed as only tempo-
rary (Scenario IV), the response of long-term rates
is likely to be muted.
Third, these examples suggest the reaction of
long-term rates to monetary policy is likely to be
much more variable than the response of short-term
rates. While expectations of future policy actions
play only a small role in determining short-term
rates, the importance of expectations increases as
maturity lengthens. In Chart 3, the response of the
2-year rate to a 100-basis-point increase in the
current funds rate target ranges from an increase of
50 basis points to a 150-basis-point increase across
Scenarios II to V. In contrast, the response of the
4-year rate shows much greater variation, from an
increase of 175 basis points to a decrease of 50 basis
points.
The variable response of long-term rates to policy
actions has important implications for monetary
policy. If this variability is systematic and related to
the business cycle, the effectiveness of policy as
measured by the ability of policy to influence long-
term rates may vary over the business cycle.
10
For
example, in the early stages of policy tightening,
investors may see policy actions as highly persistent
or as the first phase of a sequence of policy actions.
Such a response might occur because investors
foresee a strengthening economy and higher infla-
tion. If so, investors may also believe a significant
tightening of policy is necessary to moderate eco-
nomic activity and lower future inflation. In these
circumstances, long-term rates are likely to react to
a policy action as much as or more than short-term
rates. Such an explanation could account for the
sharp response of long-term rates in response to the
initial tightening of policy in the spring of 1994, as
shown in Chart 2. This explanation suggests policy
actions may be particularly effective in influencing
long-term rates early in the business cycle because
investors believe these actions are likely to be
highly persistent.
Later in the business cycle, though, investors may
foresee a slowing of economic activity and lower
inflation. If so, they may view any additional policy
tightening as only temporary and likely to be re-
versed if the economy weakens. In this situation,
while short-term rates may react fully to a policy
tightening, long-term rates may show little response
or even decline.
11
This explanation could account
for the behavior of interest rates in late 1994 and
early 1995 when short-term rates rose in response
to an increase in the funds rate target while long
rates actually declined. If correct, this explanation
suggests policy actions may have only limited ef-
fectiveness late in the business cycle because finan-
cial market participants may not believe the current
stance of policy is likely to persist.
Taken as a whole, these examples suggest that the
standard view of the monetary transmission mecha-
nism is not incorrect but is greatly oversimplified.
According to the expectations theory, both the di-
rection and magnitude of the response of long-term
rates to monetary policy depend on market percep-
80 FEDERAL RESERVE BANK OF KANSAS CITY
tions of future policy actions. In this framework, a
strong, positive connection between long-term rates
and policy actions is certainly possible. However,
other patterns may also occur depending on inves-
tors’ views as to the persistence of policy actions.
At the same time, because the relationship between
policy actions and long-term rates is likely to be
highly variable, the effectiveness of policy actions
may vary over time.
12
MEASURING THE IMPACT OF
POLICY ON LONG-TERM RATES
The expectations theory also has implications for
measuring the effect of policy actions on market
interest rates. Using a model that captures the ten-
dency of market rates to anticipate policy actions,
this article finds evidence of a stronger and more
persistent response of long-term rates to policy
actions than found in previous research.
The choice of measurement interval
As discussed above, a key part of the response of
long-term rates to policy actions in the expectations
theory arises from the impact of anticipated future
policy actions on expected future short-term rates.
At any point in time, the term structure of interest
rates implicitly incorporates investors’ best forecast
as to the likelihood and magnitude of future policy
actions. That is, forward rates already contain infor-
mation about anticipated future policy actions based
on investors’ reaction to previous policy actions and
their outlook for economic activity.
13
As a result,
when the Federal Reserve changes policy, the
observed response of long-term rates will depend
partly on how accurately investors have anticipated
the policy action and partly on revisions to their
expectations of future policy actions. On the one
hand, if investors are surprised at the timing or
magnitude of the policy change, there may be a
large response of long-term rates because the policy
action causes market participants to alter their expec-
tations of future policy actions. On the other hand,
if market participants have anticipated the policy
action correctly and see no need to revise their
expectations of future policy actions, there may be
little response of interest rates to the policy change.
The key role that anticipations play is illustrated
in the following two examples. First, suppose in-
vestors do not foresee a change in monetary policy
over an extended time horizon, but the funds rate
target is unexpectedly increased by 25 basis points.
In this situation, the full 25-basis-point “policy
surprise” is likely to be immediately incorporated
into market rates. Moreover, medium-term and
long-term rates may rise by more than 25 basis
points if market participants see the policy action as
the first in an extended series of policy changes. In
contrast, consider a second example in which mar-
ket rates have already incorporated a 25-basis-point
tightening of policy. In this case, there may be little
immediate response to a 25-basis-point increase in
the funds rate target because the change has been
anticipated by investors and does not cause them to
revise their expectations of future policy actions.
If policy actions are anticipated, there are impor-
tant implications for the choice of a time interval
over which the interest rate response is measured.
As shown in the preceding examples, the immediate
response of interest rates to a policy action may
underestimate the total response to the extent that
the policy action is anticipated. Hence, the choice
of a measurement interval that is too narrow may
fail to capture these anticipation effects, resulting in
a measured interest rate response that is too small.
The correct choice of a measurement interval is a
difficult issue. Previous studies of the reaction of
market rates to policy actions have tended to use a
rather narrow time interval for measuring the re-
sponse of interest rates (Cook and Hahn 1989a;
Radecki and Reinhart; and Dale). These studies
have generally examined only the immediate inter-
est rate response on the day of a policy change and
in an interval of a few days surrounding the policy
ECONOMIC REVIEW • FOURTH QUARTER 1995 81
action. However, the actual behavior of interest
rates suggests a wider measurement interval may be
appropriate. For example, during 1994 and early
1995, both short-term and long-term rates appear to
have anticipated Federal Reserve policy actions
well in advance of the day of the policy change
(Chart 2).
To better capture these anticipation effects, this
article measures the response of market rates over
a time interval extending from the day after the
previous policy action to the day after the current
policy action.
14
The rationale for this particular
measurement interval is that investors are likely to
have revised their expectations of future policy
actions after the previous policy change. In addi-
tion, incoming information about the economy is
likely to have caused participants to further revise
their expectations about the likelihood of future
policy actions. For example, if the economic out-
look strengthened unexpectedly after the previous
policy action, market participants may have antici-
pated a further tightening of monetary policy well
in advance of the current policy action. As a result,
both short-term and long-term rates could have
moved up weeks ahead rather than days ahead of
the current policy move.
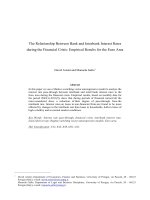
The significance of the choice of a measurement
interval is highlighted in Chart 4. This chart com-
pares the change in the 30-year Treasury bond rate
over two different measurement intervals for each
of the seven increases in the estimated federal funds
rate target during 1994 and 1995.
15
The immediate
response is the change in the 30-year rate occurring
on the day of and the day after the policy action, an
interval similar to that used in previous studies. The
total response is the change in the 30-year rate
measured from the day after the last policy change
to the day after the current policy action. As shown
in this chart, the immediate change in the days
surrounding the policy action is generally very
small. In contrast, use of the wider interval shows
the total change is generally much larger than the
immediate response. This suggests much of the
movement in the 30-year rate during this period
occurred in anticipation of monetary policy actions.
Estimates of the relationship between
long-term rates and policy actions
New estimates of the relationship between mone-
tary policy actions and long-term interest rates were
obtained by examining the response of the 30-year
Treasury bond yield to changes in an estimate of the
federal funds rate target over the period from Octo-
ber 28, 1987, through July 6, 1995.
16
During this
period there were 47 policy actions as measured by
changes in the estimated funds rate target. The
interest rate response is estimated over both the
narrow time interval used in previous studies and
over the wider time interval discussed above.
The estimated response of the 30-year Treasury
bond yield to effective federal funds rate target
changes is presented in Table 1.
17
The total response
of the 30-year rate over the entire interval, from the
day after the previous policy action to the day after
the current change, is shown in the bottom row of
the table. This total effect is broken down into three
sub-intervals. The first row, labeled “before the
change,” shows the part of the total response that
occurred from the day after the previous policy
change to the day before the current policy action.
This effect measures the extent to which policy
actions are anticipated. The second row shows the
response on the day of the current policy action. The
third row reports the response on the day after the
current policy action.
Although the estimates reported in Table 1 share
some similarities with previous work, they also
show important differences. The immediate reac-
tion of long-term rates to policy actions is very
similar to the previous work. The response of the
30-year bond on the day of and day after the policy
change, the sum of rows two and three, is only 0.10.
According to this estimate, a 100-basis-point in-
82 FEDERAL RESERVE BANK OF KANSAS CITY
crease in the funds target is associated with a small,
ten-basis-point increase in the 30-year rate in the
days surrounding the policy action.
18
In addition to the small immediate response, there
is evidence that market rates anticipate policy
moves well in advance of the current policy action.
Moreover, the magnitude of this anticipation effect
(0.28) is much greater than the immediate response.
When these two responses are combined, the total
response of the 30-year rate (0.38) is considerably
larger than previous estimates, reflecting the fact
that almost three-quarters of the movement in the
30-year rate appears to occur well in advance of the
policy action.
19
According to the expectations theory, this re-
sponse of long-term rates to monetary policy can be
separated into changes in current short-term rates
and market expectations of future short-term rates
as measured by forward rates. Such a decomposition
provides an indication of whether market participants
view policy actions as temporary or more persistent.
The impact of policy actions on current short-
term rates and forward rates is shown in Table 2.
20
In this table, the current short-term rate is taken to
be the 1-year constant maturity Treasury security
yield. Because the Treasury does not issue bonds
for all maturities, it is difficult to derive all 29
forward rates imbedded in the 30-year bond. How-
ever, using constant maturity data for available
maturities, it is possible to calculate a set of combi-
nations of forward rates that span the 30-year bond.
Table 2 shows 2-year forward rates for periods one,
three, and five years ahead, the seven-year ahead,
3-year forward rate, and the ten-year ahead, 20-year
forward rate.
21
2.5
1.5
RESPONSE OF LONG-TERM RATES TO POLICY ACTIONS
Chart 4
Percent
2.0
Mar. ’94
Total response
1.0
.5
0
5
-1.0
Apr. ’94 May ’94 Aug. ’94 Nov. ’94 Feb. ’95Feb. ’94
Immediate response
ECONOMIC REVIEW • FOURTH QUARTER 1995 83
According to the results in Table 2, the estimated
effect of monetary policy actions on the 30-year
bond comes both from an increase in current short-
term rates and from an increase in forward rates.
The estimated total effects of policy on both the
current 1-year rate and the one-year ahead, 2-year
forward rate, shown in the bottom row of Table 2,
are approximately 1.0. That is, a change in the funds
rate target is fully reflected in market rates over a
one-to-three-year horizon.
22
In the framework of the
policy scenarios discussed earlier, these results sug-
gest market participants view monetary policy ac-
tions as very persistent over a three-year horizon.
The effects on other forward rates shown in Table
2 diminish with maturity, and the total effect is not
statistically significant beyond a five-year horizon.
This implies that, while policy actions are seen as
persistent, they are not viewed as permanent. At the
same time, there is no evidence in Table 2 that
forward rates systematically decline in response to
an increase in the funds rate target. Again, this
suggests market participants do not expect policy
actions to be more than offset even over a long
horizon. Finally, when the response of current and
forward rates is divided into the reaction before,
during, and after the policy action, as shown in the
first three rows of Table 2, it is clear most of the
movement in these rates occurs in anticipation of
the policy action.
Two principal conclusions emerge from these
empirical results. First, the average effect of mone-
tary policy actions on long-term rates is positive and
larger than found in previous studies. The larger
Table 1
RESPONSE OF THE 30-YEAR TREASURY BOND YIELD TO EFFECTIVE
FEDERAL FUNDS RATE TARGET CHANGES: 1987-95
Summary statistics
Response Response estimates R
2
SE DW
Before change .2793** .048 .341 1.50
(.1533)
Day of change .0437 .016 .073 2.10
(.0330)
Day after change .0570* .129 .045 2.15
(.0204)
Total .3799* .090 .357 1.50
(.1609)
* Significant at the 5 percent level.
** Significant at the 10 percent level.
Note: Estimated standard errors in parentheses.
R
2
= multiple correlation coefficient corrected for degrees of freedom.
SE = standard error.
DW = Durbin-Watson statistic.
84 FEDERAL RESERVE BANK OF KANSAS CITY
response is due to the fact that anticipated policy
actions seem to be built into market rates well in
advance of the policy action, an effect captured by
the wider measurement interval used in this article.
Second, much of the impact of policy actions on
market rates appears to come from the reaction of
forward rates. As a result, market participants seem
to view monetary policy actions as highly persistent
over a one-to-three-year horizon.
SUMMARY AND CONCLUSIONS
Standard views of the monetary transmission
mechanism rest on a reliable relationship between
monetary policy actions and market interest rates.
While there is considerable evidence that monetary
policy has a large impact on short-term interest
rates, the connection between policy actions and
long-term rates often appears weaker and less reliable.
The analysis presented in this article suggests a
stronger but more variable connection between
monetary policy actions and long-term rates. To a
considerable degree, long-term rates appear to an-
ticipate policy changes, moving well in advance of
policy actions. Previous studies, which focus on the
behavior of long-term rates only around the day of
the policy action, do not fully capture these antici-
pation effects and so understate the relationship
between policy actions and long-term rates.
Because market expectations play such an impor-
tant role in the response of long-term rates to mone-
tary policy, however, the connection between policy
Table 2
CURRENT AND FORWARD RATE RESPONSES
2-year forward rate in
3-year
forward
rate in
7 years
20-year
forward
rate in 10
years
Response 1-year rate 1 year 3 years 5 years
Before change .7710* .6285* .3626* .1447 .2413 .0829
(.1407) (.2022) (.2079) (.1917) (.1968) (.1626)
Day of change .2239* .1017* .0861** 0378 .0261 .0042
(.0419) (.0431) (.0459) (.0551) (.0388) (.0377)
Day after change .0301 .0880* .0460 .1423* .0102 .0506**
(.0219) (.0279) (.0312) (.0479) (.0391) (.0260)
Total 1.0249* .8182* .4947* .2492 .2776 .1377
(.1452) (.2153) (.2178) (.1892) (.2076) (.1765)
* Significant at the 5 percent level.
** Significant at the 10 percent level.
Note: Estimated standard errors in parentheses.
ECONOMIC REVIEW • FOURTH QUARTER 1995 85
actions and long-term rates is likely to be more
variable than suggested by the standard view of the
monetary transmission mechanism. Monetary pol-
icy actions are likely to be most effective in chang-
ing long-term rates when these actions are seen as
persistent. Consequently, to the extent that inves-
tors’ views about the persistence of monetary policy
actions change over the business cycle, the ability
of monetary policy to influence long-term rates may
vary over time.
ENDNOTES
1
The Federal Reserve does not publish an official series for
its short-run operating targets. Thus, any data for an
operating target must be constructed from declassified
historical data or from financial market estimates of the
operating target. The federal funds target series used in this
article was constructed by one of the authors from historical
data provided by the Federal Reserve Bank of New York
through 1992 and updated using the published record of
FOMC policy actions. Construction of this series required
some judgment as to the timing of policy actions so that this
series should be viewed as an estimate rather than an official
record of policy actions.
2
Additional anecdotal evidence supporting a weak linkage
between policy actions and long-term rates can be found in
the immediate reaction of long-term rates in the days
surrounding announcements of policy actions. In the past
year, market analysts have made note of instances in which
long-term rates fell rather than increased in response to an
announced increase in the funds target. This behavior of
long-term rates has also led some analysts to question the
ability of the Federal Reserve to influence long-term rates.
3
Cook and Hahn (1989a) studied the reaction of market rates
to changes in the Federal Reserve’s estimated federal funds
rate target over the period from September 1974 to September
1979. They derived their measure of the funds rate target from
Wall Street Journal discussions of policy actions. In a related
study, they found that the Wall Street Journal estimates
tracked the official record of policy actions quite closely
(Cook and Hahn 1989b). Radecki and Reinhart examined the
response of market rates to a series of funds target changes
over the period from June 1989 to September 1992. Their
measure of the funds rate target was obtained from
declassified information released by the Federal Reserve.
4
This discussion of the simple form of the expectations
theory ignores a term premium or risk premium. Because
expected future rates are uncertain, it is commonly believed
that investors demand a risk premium to hold longer term
securities. Thus, in the example in the text, the 2-year bond
yield is likely to be above 6.5 percent to compensate investors
for the risk of a possible capital loss. Early versions of the
expectations theory assume that the risk premium is constant
or even zero (Hicks). More recent versions allow the risk
premium to vary over time and to depend on more elaborate
sources of risk than that discussed above (Cox, Ingersoll; and
Ross; Engle, Lilien, and Rubins; Longstaff; Campbell and
Shiller).
5
For some maturities, the futures market is one possible
source to determine the market’s expectations about future
interest rates. However, the entire range of expected future
short-term rates comprising very long-term rates cannot be
observed directly in futures markets.
6
For example, the current yield on a 3-year bond can be
decomposed into a current 1-year rate and two 1-year forward
rates. Similarly, the yield on a 30-year bond can be broken
down into the yield on a current 1-year rate and 29 1-year
forward rates.
7
This scenario finds some support in the empirical literature
on the term structure. Mankiw and Miron suggest that after
the Federal Reserve was formed in 1914, short-term interest
rates followed a random walk. Consequently, each change in
short-term rates is expected to be permanent for the entire
maturity of a security.
8
In this example, the new 2-year rate is computed as the
average of the new 1-year rate and the new one-year ahead,
1-year forward rate (.5 x (5+6)). Similarly, the new yield on
the 3-year bond is calculated as (.333 x (5+6+6)) and the new
yield on the 4-year bond is calculated as (.25 x (5+6+6+6)).
This scenario is similar to the “excess sensitivity” of
long-term rates to policy changes examined by Mankiw and
Summers. While commentary by financial market
participants suggests that long-term rates may overreact to
monetary policy actions, Mankiw and Summers find no
systematic tendency of rates to overreact to policy changes.
9
This scenario is consistent with stories sometimes appearing
in the financial press that long-term interest rates may fall if
the Federal Reserve tightens policy. Goodfriend also
86 FEDERAL RESERVE BANK OF KANSAS CITY
discusses how credible policy tightening may result in lower
long-term rates by decreasing inflationary expectations.
10
The variable response of long-term rates to policy actions
has another implication for policy. If this variability is not
systematic, that is, market participants simply change their
outlook on future policy actions very frequently, estimates of
the response of long-term rates to policy actions may be very
imprecise. If so, policymakers may have difficulty in
accurately predicting the response of long-term rates to a
change in policy.
11
Long-term rates may already be on a downward trend if
the weaker economic outlook leads market participants to
lower inflationary expectations. In this situation, an increase
in the funds rate target will have little effect on long-term rates
because market participants believe that the funds target will
eventually be lowered as future inflation declines.
12
Explaining why expectations vary over the business cycle
is a more difficult issue that is beyond the scope of this article.
Clearly, policy actions are not the only factor determining
market expectations of future interest rates. Indeed, market
expectations of future interest rates are likely to depend on a
variety of factors influencing both real interest rates and
inflationary expectations. This article has highlighted the
importance of policy persistence. According to the
expectations theory, policy actions are likely to have a large
effect on long-term rates only to the extent that they are
viewed as persistent. However, policy actions are more likely
to be viewed as persistent when they are also seen as
compatible with other fundamental factors determining the
outlook for real interest rates and inflationary expectations.
Thus, the effectiveness of monetary policy in influencing
long-term rates may vary over time, depending on financial
market perceptions as to the consistency of policy actions and
other factors determining the economic outlook.
13 Other studies that examine the relationship between
Federal Reserve behavior and the term structure include
Mankiw and Milan, Cook and Hahn (1990), Rudebusch, and
Dotsey and Otrok, and McCallum.
14
Extending the interval to the day after the policy action is
consistent with previous studies which generally find a
significant response of interest rates a day or two after the policy
action. One explanation for this result is that until 1994, policy
actions by the Federal Reserve were not officially announced
and so it may have taken time for market participants to discern
the timing and magnitude of a policy change.
15
Since the size of the change in the funds rate target is not
constant across time, each change in the 30-year rate is
normalized by dividing by the change in the funds rate target.
Thus, if the reaction of the 30-year rate is equal to 1.0 in the
chart, this indicates that the 30-year rate rose by the same
amount as the funds rate target. Also, since the last policy
change prior to the February 1994 change occurred in 1992,
the beginning of the measurement interval for this change was
arbitrarily set at the last business day of 1993.
16
While data for the most recent period are available starting
in 1985, the sample used here starts in October 1987 for two
reasons. One is that the Federal Reserve appeared to focus
more directly on the federal funds rate in implementing
monetary policy after the October 1987 stock market crash
(Lindsey). Another, and perhaps related, factor is that the
empirical results reported below are significantly different for
the period before October 1987. Consequently, the model is
estimated from October 1987 to reflect the most recent
experience.
17
The equations are estimated in the following form:
∆ R
i
30y,t
= b
o
+ b
1
∗∆ r
ff,t
+ e
t
i = 1,2,3,4
∆R
1
30y,t
= change in the 30-year Treasury bond from the day
after the change in the effective federal funds rate
target at time t-1 to the day before the change at
time t.
∆R
2
30y,t
= change in the 30-year yield from the close on the
day before the change in the funds rate target at
time t to the close on the day of the change.
∆R
3
30y,t
= change in the 30-year yield from the close on the
day of the change in the funds rate target at time t
to the close on the day after the change.
∆R
4
30y,t
= ∆R
1
30y,t
+ ∆R
2
30y,t
+ ∆R
3
30y,t
= change in the 30-year rate from the day after the
change in the funds rate target at time t-1 to the
close on the day after the change in the funds rate
target at time t.
18
Estimates of the immediate response of long-term rates to
a 100-basis-point increase in the interest rate target range
from four to ten basis points (Cook and Hahn (1989a),
Radecki and Reinhart, Dale). Some studies use the 20-year
rate instead of the 30-year rate as the long-term bond. The
Federal Reserve began announcing policy actions in 1994.
None of the estimated results in this article differ in the
pre-1994 and post-1994 period.
19
The simple model used to obtain these estimates abstracts
from econometric issues that could affect the estimates. One
ECONOMIC REVIEW • FOURTH QUARTER 1995 87
issue raised in the previous section is that the response of
long-term rates may vary systematically over the business
cycle while the model estimated does not attempt to
incorporate this variability. The relatively short length of the
sample precludes a detailed examination of business-cycle
effects. If variability is important, the estimates reported in
Tables 1 and 2 are best viewed as measures of an average
response over the sample period. Thus, an estimated positive
response is consistent with either an average of large
responses at the beginning of an expansion and small
responses toward the end or a relatively stable moderate
response throughout an expansion. Without indicating any
particular pattern, however, the results do suggest that
responses are quite variable as indicated by the relative
imprecision of the response estimates. This variability is
consistent with the response pattern for the brief period
illustrated in Chart 4. A second issue is that there is no attempt
to model a term premium. Forward rates incorporate both
expectations of future short-term rates and term premia. If
these term premia depend upon the level of interest rates, the
estimates could be biased.
20
The equations in Table 3 are estimated in the following form:
Change in current or forward rate
t
i
=
b
0
+ b
1
∗∆ r
ff,t
+ e
t
i = 1,2,3,4
Change in current or forward rate
t
1
=
change in the rate
from the day after the change in the effective
funds rate target at time t-1 to the day before the
change at time t.
Change in current or forward rate
t
2
=
change in the rate
from the close on the day before the change in
the funds target at time t to the close on the day
of the change.
Change in current or forward rate
t
3
= change in the rate
from the close on the day of the change in the
funds target at time t to the close on the day
after the change at time t.
Change in current or forward rate
t
4
= change in the rate
from the day after the change in the funds rate
target at time t-1 to the close on the day after the
change at time t.
∆ r
ff,t
= change in the effective funds rate target from time
t-1 to time t.
21
Forward rates are calculated with the adjustments
suggested by Shiller, Campbell, and Schoenholtz. These
forward rates are adjusted for the durations of the different
securities that depend on the level of interest rates. The
responses of unadjusted forward rates (not reported), along
with the one-year spot rate, would sum to the response of the
30-year yield (0.38) as reported in Table 1. Because of the
duration adjustments, however, the sum of the adjusted
forward rates used in Table 3 implies a somewhat different
(0.25) response of the 30-year rate.
22
Of the three previous studies cited, only Radecki and
Reinhart look at the reaction of forward rates to policy
actions. These authors find a much smaller response of the
one-year rate than this study and find no significant response
of forward rates beyond a one-year horizon.
REFERENCES
Campbell, John Y., and Robert J. Shiller. 1991. “Yield
Spreads and Interest Rate Movements: A Bird’s Eye View,”
Review of Economic Studies, 58, May, pp. 495-514.
Cook, Timothy, and Thomas Hahn. 1989a. “The Effect of
Changes in the Federal Funds Target on Market Interest
Rates in the 1970s,” Journal of Monetary Economics, 24,
November, pp. 331-51.
Cook, Timothy, and Thomas Hahn, 1989b. “A Comparison
of Actual and Perceived Changes in the Federal Funds Rate
Target in the 1970s,” Federal Reserve Bank of Richmond,
Working Paper no. 1989-4.
Cook, Timothy, and Thomas Hahn. 1990. “Interest Rate
Expectations and the Slope of the Money Market Yield
Curve,” Federal Reserve Bank of Richmond, Economic
Review, 76 September/October, pp. 3-26.
Cox, John C., Jonathan E. Ingersoll, and Stephen A. Ross.
1985. “A Theory of the Term Structure of Interest Rates,”
Econometrica, 53, March, pp. 385-407.
Dale, Spencer. 1993. “The Effect of Changes in Official U.K.
Rates on Market Interest Rates Since 1987,” The Manches-
ter School, 61, June, pp. 76-94.
Davis, Richard. 1990. “Introduction” to Intermediate Targets
and Indicators for Monetary Policy: A Critical Survey,
Federal Reserve Bank of New York, July, pp. 1-19.
Dotsey, Michael, and Christopher Otrok. 1995. “The Rational
Expectations Hypothesis of the Term Structure, Monetary
Policy, and Time-Varying Term Premia,” Federal Reserve
Bank of Richmond, Quarterly Review, 81, Winter, pp.
65-81.
Engle, Robert F., David M. Lilien, and Russell P. Rubins.
88 FEDERAL RESERVE BANK OF KANSAS CITY
1987. “Estimating Time Varying Risk Premia in the Term
Structure: The ARCH-M Model,” Econometrica, 55,
March, pp. 391-407.
Goodfriend, Marvin. 1993. “Interest Rate Policy and the
Inflation Scare Problem: 1979-1992,” Federal Reserve Bank
of Richmond, Economic Quarterly, 79, Winter, pp. 1 -24.
Hicks, John R. 1939. Value and Capital. London: Oxford
University Press.
Lindsey, David. 1991. “Monetary Targeting: Lessons from
the U.S. Experience,” in G. Caprio and P. Honohan, eds.,
Monetary Policy Instruments for Developing Countries.
Washington: The World Bank, pp. 67-79.
Longstaff, Francis. 1990. “Time Varying Term Premia and
Traditional Hypotheses About the Term Structure,” Jour-
nal of Finance, 45, September, pp. 1307-14.
Mankiw, N. Gregory, and Jeffrey A. Miron. 1986. “The
Changing Behavior of the Term Structure of Interest
Rates,” Quarterly Journal of Economics, 101, May, pp.
211-28.
Mankiw, N. Gregory, and Lawrence H. Summers. 1984. “Do
Long-Term Interest Rates Overreact to Short-Term Interest
Rates?” Brookings Papers on Economic Activity, No. 1, pp.
223-43.
McCallum, Bennett T. 1994. “Monetary Policy and the Term
Structure of Interest Rates,” National Bureau of Economic
Research, Working Paper no. 4938, November.
Meulendyke, A., 1990. “A Review of Federal Reserve Policy
Targets and Operating Guides in Recent Decades,” Federal
Reserve Bank of New York, Intermediate Targets and
Indicators for Monetary Policy, July, pp. 452-73.
Radecki, Lawrence J., and Vincent Reinhart. 1994. “The
Financial Linkages in the Transmission of Monetary Policy
in the United States,” National Differences in Interest Rate
Transmission. Basle: Bank for International Settlements,
March.
Rudebusch, Glenn D. 1995. “Federal Reserve Interest Rate
Targeting, Rational Expectations, and the Term Structure,”
Journal of Monetary Economics, 35, April, pp. 245-74.
Sellon, Gordon H. Jr. 1994. “Measuring Monetary Policy,”
Federal Reserve Bank of Kansas City, Working Paper
94-12, December.
Shiller, Robert J., John Y. Campbell, and Kermit L. Schoen-
holtz. 1983. “Forward Rates and Future Policy: Interpret-
ing the Term Structure of Interest Rates,” Brookings Papers
on Economic Activity, No. 1, pp. 173-217.
ECONOMIC REVIEW • FOURTH QUARTER 1995 89