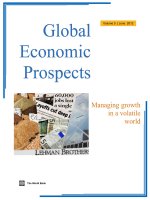
Global Economic Prospects - Uncertainties and vulnerabilities pot
Bạn đang xem bản rút gọn của tài liệu. Xem và tải ngay bản đầy đủ của tài liệu tại đây (10.44 MB, 165 trang )
Global
Economic
Prospects
Global
Economic
Prospects
Volume 4 | January 2012
Uncertainties
Vulnerabilities
AND
© 2012 The International Bank for Reconstruction and Development / The World Bank
1818 H Street NW
Washington DC 20433
Telephone: 202-473-1000
Internet: www.worldbank.org
E-mail:
All rights reserved
1 2 3 4 13 12 11 10
This volume is a product of the staff of the International Bank for Reconstruction and Development /
The World Bank. The findings, interpretations, and conclusions expressed in this volume do not neces-
sarily reflect the views of the Executive Directors of The World Bank or the governments they represent.
The World Bank does not guarantee the accuracy of the data included in this work. The boundaries, col-
ors, denominations, and other information shown on any map in this work do not imply any judgment on
the part of The World Bank concerning the legal status of any territory or the endorsement or acceptance
of such boundaries.
Rights and Permissions
The material in this publication is copyrighted. Copying and/or transmitting portions or all of this work
without permission may be a violation of applicable law. The International Bank for Reconstruction and
Development / The World Bank encourages dissemination of its work and will normally grant permis-
sion to reproduce portions of the work promptly.
For permission to photocopy or reprint any part of this work, please send a request with complete infor-
mation to the Copyright Clearance Center Inc., 222 Rosewood Drive, Danvers, MA 01923, USA; tele-
phone: 978-750-8400; fax: 978-750-4470; Internet: www.copyright.com.
All other queries on rights and licenses, including subsidiary rights, should be addressed to the Office of
the Publisher, The World Bank, 1818 H Street NW, Washington, DC 20433, USA. fax: 202-522-2422;
e-mail:
3
Global Economic Prospects
Uncertainties and vulnerabilities
January 2012
4
Acknowledgments
This report is a product of the Prospects Group in the Development Economics Vice Presidency of the World Bank.
Its principal authors were Andrew Burns and Theo Janse van Rensburg.
The project was managed by Andrew Burns, under the direction of Hans Timmer and the guidance of Justin Yifu
Lin. Several people contributed substantively to the report. The modeling and data team was lead by Theo Janse van
Rensburg assisted by Irina Kogay, Sabah Zeehan Mirza and Betty Dow. The projections, regional write-ups and
subject annexes were produced by Dilek Aykut (Finance, Europe & Central Asia), John Baffes & Shane Streifel
(Commodities) Annette De Kleine (South Asia, Exchange Rates and Current Accounts), Allen Dennis (Sub-Saharan
Africa, International Trade), Eung Ju Kim (Finance), Theo Janse van Rensburg (High-Income Countries), Elliot
(Mick) Riordan (East Asia & the Pacific, Middle-East & North Africa, and Inflation), Cristina Savescu (Latin
America & Caribbean, Industrial Production). Regional projections and annexes were produced in coordination with
country teams, country directors, and the offices of the regional Chief Economists and PREM directors. The short-
term commodity price forecasts were produced by John Baffes, Betty Dow, and Shane Streifel. The remittances
forecasts were produced by Sanket Mohapatra.
The accompanying online publication, Prospects for the Global Economy, was produced by a team led by Nadia
Islam Spivak and Sarah Crow, and comprised of Betty Dow, Kathy Rollins, and Sachin Shahria with technical sup-
port from David Horowitz and Roula Yazigi.
Indira Chand and Merrell Tuck-Primdahl managed media relations and the dissemination. Hazel Macadangdang
managed the publication process.
Several reviewers offered extensive advice and comments. These included Abebe Adugna, Zeljko Bogetic, Kevin
Carey, Jorg Decressin, Tatiana Didier, Hinh Dinh, Punam Chuhan-Pole, Tito Cordella, Doerte Doemeland, Willem
van Eeghen, Manuela Ferro, Caroline Freund, Michael Fuchs, Bernard Funck, David Gould, Santiago Herrera, Bert
Hofman, Shahrokh Fardoust, Elena Ianchovichina, Fernando Im, Kalpana Kochhar, Asli Demirguc-Kunt, Barbara
Mierau-Klein, Audrey Liounis, Stephen Mink, Thomas Losse-Muller, Cyril Muller, Antonio M. Ollero, Kwang
Park, Samuel Pienkagura, Bryce Quillin, Sergio Schmukler, Torsten Sløk, Francesco Strobbe, Hans Timmer,
Merrell Tuck-Primdahl, David Theis, Volker Trichiel, Ekaterina Vostroknutova, Makai Witte, and Juan Zalduendo.
The world economy has entered a very difficult
phase characterized by significant downside
risks and fragility.
The financial turmoil generated by the
intensification of the fiscal crisis in Europe has
spread to both developing and high-income
countries, and is generating significant
headwinds. Capital flows to developing
countries have declined by almost half as
compared with last year, Europe appears to have
entered recession, and growth in several major
developing countries (Brazil, India, and to a
lesser extent Russia, South Africa and Turkey)
has slowed partly in reaction to domestic policy
tightening. As a result, and despite relatively
strong activity in the United States and Japan,
global growth and world trade have slowed
sharply.
Indeed, the world is living a version of the
downside risk scenarios described in earlier
editions of Global Economic Prospects (GEP),
and as a result forecasts have been significantly
downgraded.
The global economy is now expected to
expand 2.5 and 3.1 percent in 2012 and 2013
(3.4 and 4.0 percent when calculated using
purchasing power parity weights), versus the
3.6 percent projected in June for both years.
High-income country growth is now expected
to come in at 1.4 percent in 2012 (-0.3 percent
for Euro Area countries, and 2.1 percent for
the remainder) and 2.0 percent in 2013, versus
June forecasts of 2.7 and 2.6 percent for 2012
and 2013 respectively.
Developing country growth has been revised
down to 5.4 and 6.0 percent versus 6.2 and 6.3
percent in the June projections.
Reflecting the growth slowdown, world trade,
which expanded by an estimated 6.6 percent in
2011, will grow only 4.7 percent in 2012,
before strengthening to 6.8 percent in 2013.
However, even achieving these much weaker
outturns is very uncertain. The downturn in
Europe and weaker growth in developing
countries raises the risk that the two
developments reinforce one another, resulting in
an even weaker outcome. At the same time, the
slow growth in Europe complicates efforts to
restore market confidence in the sustainability of
the region’s finances, and could exacerbate
tensions. Meanwhile the medium-term
challenges represented by high deficits and debts
in Japan and the United States and slow trend
growth in other high-income countries have not
been resolved and could trigger sudden adverse
shocks. Additional risks to the outlook include
the possibility that political tensions in the
Middle-East and North Africa disrupt oil supply,
and the possibility of a hard landing in one or
more economically important middle-income
countries.
In Europe, significant measures have been
implemented to mitigate current tensions and to
move towards long-term solutions. The
European Financial Stability Facility (EFSF) has
been strengthened, and progress made toward
instituting Euro Area fiscal rules and
enforcement mechanisms. Meanwhile, the
European Central Bank (ECB) has bolstered
liquidity by providing banks with access to low-
cost longer-term financing. As a result, yields on
the sovereign debt of many high-income
countries have declined, although yields remain
high and markets skittish.
While contained for the moment, the risk of a
much broader freezing up of capital markets and
a global crisis similar in magnitude to the
Lehman crisis remains. In particular, the
willingness of markets to finance the deficits and
maturing debt of high-income countries cannot
be assured. Should more countries find
themselves denied such financing, a much wider
financial crisis that could engulf private banks
and other financial institutions on both sides of
Global Economic Prospects January 2012:
Uncertainties and vulnerabilities
Overview & main messages
2
Table 1 The Global Outlook in summary
(percent change from previous year, except interest rates and oil price)
Global Economic Prospects January 2012 Main Text
2009 2010 2011e 2012f 2013f
Global Conditions
World Trade Volume (GNFS) -10.6 12.4 6.6 4.7 6.8
Consumer Prices
G-7 Countries
1,2
-0.2 1.2 2.2 1.6 1.7
United States -0.3 1.6 2.9 2.0 2.2
Commodity Prices (USD terms)
Non-oil commodities -22.0 22.4 20.7 -9.3 -3.3
Oil Price (US$ per barrel)
3
61.8 79.0 104.0 98.2 97.1
Oil price (percent change) -36.3 28.0 31.6 -5.5 -1.2
Manufactures unit export value
4
-6.6 3.3 8.9 -4.5 0.8
Interest Rates
$, 6-month (percent) 1.2 0.5 0.5 0.8 0.9
€, 6-month (percent)
1.5 1.0 1.6 1.1 1.3
International capital flows to developing countries (% of GDP)
Developing countries
Net private and official inflows 4.2 5.8 4.5
Net private inflows (equity + debt) 3.7 5.4 4.3 3.3 3.7
East Asia and Pacific 3.7 6.0 4.7 3.4 3.7
Europe and Central Asia 2.7 5.0 3.6 2.0 2.9
Latin America and Caribbean 3.9 6.0 4.8 4.1 4.3
Middle East and N. Africa 2.8 2.4 2.0 1.2 1.6
South Asia 4.6 5.0 3.9 3.3 3.7
Sub-Saharan Africa 4.0 3.7 3.9 3.5 4.4
Real GDP growth
5
World -2.3 4.1 2.7 2.5 3.1
Memo item: World (PPP weights)
6
-0.9 5.0 3.7 3.4 4.0
High income -3.7 3.0 1.6 1.4 2.0
OECD Countries -3.7 2.8 1.4 1.3 1.9
Euro Area -4.2 1.7 1.6 -0.3 1.1
Japan -5.5 4.5 -0.9 1.9 1.6
United States -3.5 3.0 1.7 2.2 2.4
Non-OECD countries -1.5 7.2 4.5 3.2 4.1
Developing countries 2.0 7.3 6.0 5.4 6.0
East Asia and Pacific 7.5 9.7 8.2 7.8 7.8
China 9.2 10.4 9.1 8.4 8.3
Indonesia 4.6 6.1 6.4 6.2 6.5
Thailand -2.3 7.8 2.0 4.2 4.9
Europe and Central Asia -6.5 5.2 5.3 3.2 4.0
Russia -7.8 4.0 4.1 3.5 3.9
Turkey -4.8 9.0 8.2 2.9 4.2
Romania -7.1 -1.3 2.2 1.5 3.0
Latin America and Caribbean -2.0 6.0 4.2 3.6 4.2
Brazil -0.2 7.5 2.9 3.4 4.4
Mexico -6.1 5.5 4.0 3.2 3.7
Argentina 0.9 9.2 7.5 3.7 4.4
Middle East and N. Africa 4.0 3.6 1.7 2.3 3.2
Egypt
7
4.7 5.1 1.8 3.8 0.7
Iran 3.5 3.2 2.5 2.7 3.1
Algeria 2.4 1.8 3.0 2.7 2.9
South Asia 6.1 9.1 6.6 5.8 7.1
India
7, 8
9.1 8.7 6.5 6.5 7.7
Pakistan
7
3.6 4.1 2.4 3.9 4.2
Bangladesh
7
5.7 6.1 6.7 6.0 6.4
Sub-Saharan Africa 2.0 4.8 4.9 5.3 5.6
South Africa -1.8 2.8 3.2 3.1 3.7
Nigeria 7.0 7.9 7.0 7.1 7.4
Angola 2.4 2.3 7.0 8.1 8.5
Memorandum items
Developing countries
excluding transition countries 3.3 7.8 6.3 5.7 6.2
excluding China and India -1.7 5.5 4.4 3.8 4.5
7
8
Source: World Bank.
Notes: PPP = purchasing power parity; e = estimate; f = forecast.
1. Canada, France, Germany, Italy, Japan, the UK, and the United States.
2. In local currency, aggregated using 2005 GDP Weights.
3. Simple average of Dubai, Brent and West Texas Intermediate.
4. Unit value index of manufactured exports from major economies, expressed in USD.
5. Aggregate growth rates calculated using constant 2005 dollars GDP weights.
6. Calculated using 2005 PPP weights.
In keeping with national practice, data for Egypt, India, Pakistan and Bangladesh are reported on a fiscal year basis in Table 1.1. Aggregates
that depend on these countries, however, are calculated using data compiled on a calendar year basis.
Real GDP at market prices. GDP growth rates calculated using real GDP at factor cost, which are customarily reported in India, can vary
significantly from these growth rates and have historically tended to be higher than market price GDP growth rates. Growth rates stated on
this basis, starting with FY2009-10 are 8.0, 8.5, 6.8, 6.8 and 8.0 percent – see Table SAR.2 in the regional annex.
3
the Atlantic cannot be ruled out. The world
could be thrown into a recession as large or even
larger than that of 2008/09.
Although such a crisis, should it occur, would be
centered in high-income countries, developing
countries would feel its effects deeply. Even if
aggregate developing country growth were to
remain positive, many countries could expect
outright declines in output. Overall, developing
country GDP could be about 4.2 percent lower
than in the baseline by 2013 — with all regions
feeling the blow.
In the event of a major crisis, activity is unlikely
to bounce back as quickly as it did in 2008/09, in
part because high-income countries will not have
the fiscal resources to launch as strong a counter-
cyclical policy response as in 2008/09 or to offer
the same level of support to troubled financial
institutions. Developing countries would also
have much less fiscal space than in 2008 with
which to react to a global slowdown (38 percent
of developing countries are estimated to have a
government deficit of 4 or more percent of GDP
in 2011). As a result, if financial conditions
deteriorate, many of these countries could be
forced to cut spending pro-cyclically, thereby
exacerbating the cycle.
Arguably, monetary policy in high-income
countries will also not be able to respond as
forcibly as in 2008/09, given the already large
expansion of central bank balance sheets.
Among developing countries, many countries
have tightened monetary policy, and would be
able to relax policy (and in some cases already
have) if conditions were to deteriorate sharply.
Developing countries need to prepare for
the worst
In this highly uncertain environment, developing
countries should evaluate their vulnerabilities
and prepare contingencies to deal with both the
immediate and longer-term effects of a
downturn.
If global financial markets freeze up,
governments and firms may not be able to
finance growing deficits.
Problems are likely to be particularly acute for
the 30 developing countries with external
financing needs (for maturing short and long-
term debt, and current account deficits) that
exceed 10 percent of GDP. To the extent
possible, such countries should seek to pre-
finance these needs now so that a costly and
abrupt cut in government and private-sector
spending can be avoided.
Historically high levels of corporate bond
issuance in recent years could place firms in
Latin America at risk if bonds cannot be rolled
over as they come due (emerging-market
corporate bond spreads have reached 430 basis
points, up 135 basis points since the end of
2007).
Fiscal pressures could be particularly intense
for oil and metals exporting countries. Falling
commodity prices could cut into government
revenues, causing government balances in oil
exporting countries to deteriorate by more than
4 percent of GDP.
All countries, should engage in contingency
planning. Countries with fiscal space should
prepare projects so that they are ready to be
pursued should additional stimulus be
required. Others should prioritize social safety
net and infrastructure programs essential to
assuring longer-term growth.
A renewed financial crisis could accelerate the
ongoing financial-sector deleveraging process.
Several countries in Europe and Central Asia
that are reliant on high-income European
Banks for day-to-day operations could be
subject to a sharp reduction in wholesale
funding and domestic bank activity —
potentially squeezing spending on investment
and consumer durables.
If high-income banks are forced to sell-off
foreign subsidiaries, valuations of foreign and
domestically owned banks in countries with
large foreign presences could decline abruptly,
potentially reducing banks’ capital adequacy
ratios and forcing further deleveraging.
More generally, a downturn in growth and
continued downward adjustment in asset prices
could rapidly increase the number of non-
performing loans throughout the developing
world also resulting in further deleveraging.
In order to forestall such a deterioration in
conditions from provoking domestic banking
crises, particularly in countries where credit
Global Economic Prospects January 2012 Main Text
4
has increased significantly in recent years,
countries should engage now in stress testing
of their domestic banking sectors.
A severe crisis in high-income countries, could
put pressure on the balance of payments and
incomes of countries heavily reliant on
commodity exports and remittance inflows.
A severe crisis could cause remittances to
developing countries to decline by 6.3 percent
— a particular burden for the 24 countries
where remittances represent 10 or more
percent of GDP.
Oil and metals prices could fall by 24 percent
causing current account positions of some
commodity exporting nations to deteriorate by
5 or more percent of GDP.
In most countries, lower food prices would
have only small current account effects. They
could, however, have important income effects
by reducing incomes of producers (partially
offset by lower oil and fertilizer prices), while
reducing consumers’ costs.
Current account effects from reduced export
volumes of manufactures would be less acute
(being partially offset by reduced imports), but
employment and industrial displacement
effects could be large.
Overall, global trade volumes could decline by
more than 7 percent.
GDP effects would be strongest in countries
(such as those in Europe & Central Asia) that
combine large trade sectors and significant
exposure to the most directly affected
economies.
Global economy facing renewed
uncertainties
The global economy has entered a dangerous
phase. Concerns over high-income fiscal
sustainability have led to contagion, which is
slowing world growth. Investor nervousness has
spread to the debt and equity markets of
developing countries and even to core Euro Area
economies.
So far, the biggest hits to activity have been felt
in the European Union itself. Growth in Japan
and the United States has actually firmed since
the intensification of the turmoil in August 2011,
mainly reflecting internal dynamics (notably the
bounce back in activity in Japan, following
Tohoku and the coming online of reconstruction
efforts).
Growth in several major developing countries
(Brazil, India, and to a lesser extent Russia,
South Africa and Turkey) is also slowing, but in
most cases due to a tightening of domestic policy
introduced in late 2010 or early 2011 to combat
domestic inflationary pressures. So far, smaller
economies continue to expand, but weak
business sector surveys and a sharp reduction in
global trade suggest weaker growth ahead.
For the moment, the magnitude of the effects of
these developments on global growth are
uncertain, but clearly negative. One major
uncertainty concerns the interaction of the policy
-driven slowing of growth in middle-income
countries, and the financial turmoil driven
slowing in Europe. While desirable from a
domestic policy point of view, this slower
growth could interact with the slowing in Europe
resulting in a downward overshooting of activity
and a more serious global slowdown than
otherwise would have been the case.
A second important uncertainty facing the global
economy concerns market perceptions of the
ability of policymakers to restore market
confidence durably. The resolve of European
policymakers to overcome this crisis, to
consolidate budgets, to rebuild confidence of
Figure 1. Short-term yields have eased but long-term
yields remain high
Source: Datastream, World Bank.
3.5
4.0
4.5
5.0
5.5
6.0
6.5
7.0
7.5
8.0
May-11
Jun-11
Jul-11
Aug-11
Sep-11
Oct-11
Nov-11
Dec-11
Jan-12
Bond yields, percent
Italy Spain
5-year yields
10-year yields
Global Economic Prospects January 2012 Main Text
5
markets and return to a sustainable growth path
is clear. Indeed, recent policy initiatives (box 1)
have helped restore liquidity in some markets,
with short-term yields on the sovereign debt of
both Italy and Spain having come down
significantly since December (figure 1). So far,
longer-term yields have been less affected by the
se initiatives — although they too show recent
signs of easing albeit to a lesser extent.
Despite improvements, markets continue to
demand a significant premium on the sovereign
debt of European sovereigns. Indeed, credit
default swaps (CDS) rates on the debt of even
core countries like France exceed the mean CDS
rate of most developing economies.
Enduring market concerns include: uncertainty
whether private banks will be able to raise
sufficient capital to offset losses from the
marking-to-market of their sovereign debt
holdings, and satisfy increased capital adequacy
ratios. Moreover, it is not clear whether there is
an end in sight to the vicious circle whereby
budget cuts to restore debt sustainability reduce
growth and revenues to the detriment of debt
sustainability. Although still back-burner issues,
fiscal sustainability in the United States and
Japan are also of concern.
As in 2008/09, precisely how the tensions that
characterize the global economy now will
resolve themselves is uncertain. Equally
uncertain is how that resolution will affect
developing countries. The pages that follow do
Box 1. Recent policy reforms addressing concerns over European Sovereign debt
Banking-sector reform: In late October the European Banking Authority (EBA) announced new regulations requir-
ing banks to revalue their sovereign bond holdings at the market value of September 2011. The EBA estimates that
this mark-to-market exercise will reduce European banks’ capital by €115 billion. In addition, the banks are re-
quired to raise their tier1 capital holdings to 9 percent of their risk-weighted loan books. Banks are to meet these
new requirements by end of June 2012 and are under strong guidance to do this by raising equity, and selling non-
core assets. Banks are being actively discouraged from deleveraging by reducing short-term loan exposures
(including trade finance) or loans to small and medium-size enterprises. As a last resort, governments may take
equity positions in banks to reach these new capital requirements.
Facilitated access of banks to dollar markets and medium-term ECB funding: Several central banks took coordi-
nated action on November 30
th
, lowering the interest rate on existing dollar liquidity swap lines by 50 basis points
in a global effort to reduce the cost and increase the availability of dollar financing, and agreed to keep these meas-
ures in place through February 1st, 2013. In addition in late November the ECB re-opened long-term (3 year) lend-
ing windows for Euro Area banks at an attractive 1% interest rare to compensate for reduced access to bond mar-
kets, and has agreed to accept private-bank held sovereign debt as collateral for these loans.
Reinforcement of European Financial Stability Facility: On November 29, European Union finance ministers
agreed to reinforce the EFSF by expanding its lending capacity to up to €1 trillion; creating certificates that could
guarantee up to 30 percent of new issues from troubled euro-area governments; and creating investment vehicles
that would boost the EFSF’s ability to intervene in primary and secondary bond markets. Precise modalities of
how the reinforced fund will operate are being worked out.
Passage of fiscal and structural reform packages in Greece, Italy and Spain: The introduction of technocratic gov-
ernments with the support of political parties in Greece and Italy, both of which hold mandates to introduce both
structural and fiscal reforms designed to assure fiscal sustainability. In Greece, the new government fulfilled all of
the requirements necessary to ensure release of the next tranche of IMF/ EFSF support, while in Italy the govern-
ment has passed and is implementing legislation to make the pension system more sustainable, increase value
added taxes and increase product-market competition. In addition, a newly elected government in Spain has also
committed to considerably step up the structural and fiscal reforms begun by the previous government.
Agreement on a pan-European fiscal compact: In early December officials agreed to reinforce fiscal federalism
within most of the European Union (the United Kingdom was the sole hold out), including agreement to limit
structural deficits to 0.3 percent of GDP, and to allow for extra-national enforcement of engagements (precise mo-
dalities are being worked out with a view to early finalization).
Global Economic Prospects January 2012 Main Text
6
not pretend to foretell the future path of the
global economy, but rather explore paths that
might be taken and how such path might interact
with the pre-existing vulnerabilities of
developing countries to affect their prospects.
Financial-market consequences for
developing countries of the post August
2011 increase in risk aversion
The resurgence of market concerns about fiscal
sustainability in Europe and the exposure of
banks to stressed sovereign European debt
pushed credit default swap (CDS) rates (a form
of insurance that reimburses debt holders if a
bond issuer defaults) of most countries upwards
beginning in August 2011 (figure 2).
This episode of heightened market volatility
differed qualitatively from earlier ones because
this time the spreads on developing country debt
also rose (by an average of 130 basis points
between the end of July and October 4th 2011),
as did those of other euro area countries
(including France, and Germany) and those of
non-euro countries like the United Kingdom.
For developing countries, the contagion has been
broadly based. By early January, emerging-
market bond spreads had widened by an average
of 117 bps from their end-of-July levels, and
Figure 2 Persistent concerns over high-income fiscal sustainability have pushed up borrowing costs worldwide
CDS spread on 5 year sovereign debt, basis points Change in 5-year sovereign credit-default swap, basis points
(as of Jan. 6th, 2012)*
Source: DataStream, World Bank.
0
150
300
450
Ukraine
Argentina
Croatia
Romania
Bulgaria
Lithuania
Turkey
Kazakhstan
Russia
South …
Indonesia
China
Malaysia
Thailand
Chile
Philippines
Brazil
Colombia
Mexico
Peru
Venezuela
Greece
Portugal
Italy
Spain
France
Germany
Japan
USA
Ireland
5,929
* Change since the beginning of July.
Developing countries
High-income
countries
0
500
1000
1500
2000
2500
3000
Jan-11
Mar-11
May-11
Jul-11
Sep-11
Nov-11
Jan-12
Ireland
Spain
Portugal
Italy
LMICs < 200
Figure 3 Declining stock markets were associated with capital outflows from developing countries since July
MSCI Index, January 2010=100 Gross capital flows (July to December), bn of dollars
Sources: Bloomberg, Dealogic and World Bank.
85
90
95
100
105
110
115
Jan-10
Apr-10
Jul-10
Oct-10
Jan-11
Apr-11
Jul-11
Oct-11
Jan-12
Emerging Markets
Developed markets
0
10
20
30
40
50
60
70
80
90
100
110
East Asia
& th e
Pacific
Europ e &
Central
Asia
Latin
America &
the
Caribbean
Middle
East &
North
Africa
South
Asia
Sub-
Saharan
Africa
Equity
Bon d
Bank
$ billion
* Fo r July through December
2010*
2011*
Global Economic Prospects January 2012 Main Text
7
developing-country stock markets had lost 8.5
percent of their value. This, combined with the
4.2 percent drop in high-income stock-market
valuations, has translated into $6.5 trillion, or 9.5
percent of global GDP in wealth losses (figure
3).
The turmoil in developing country markets
peaked in early October. Since then the median
CDS rates of developing country with relatively
good credit histories (those whose CDS rates
that were less than 200 bp before January 2010)
have declined to 162 points and developing
country sovereign yields have eased from 672 to
616 basis points.
Capital flows to developing countries weakened
sharply. Investors withdrew substantial sums
from developing-country markets in the second
half of the year. Overall, emerging-market equity
funds concluded 2011 with about $48 billion in
net outflows, compared with a net inflow of $97
Table 2. Net capital flows to developing countries
$ Billions
2004 2005 2006 2007 2008 2009 2010 2011e 2012f 2013f
Current account balance 141.6 244.9 379.8 384.9 354.5 276.7 221.2 190.0 99.0 32.0
as % of GDP 1.8 2.6 3.4 2.7 2.1 1.7 1.1 0.9 0.4 0.1
Financial flows:
Net private and official inflows 347.3 519.7 686.5 1129.7 830.3 673.8 1126.8 1004.4
Net private inflows (equity+debt)
371.6 584.0 755.5 1128.2 800.8 593.3 1055.5 954.4 807.4 1016.4
Net equity inflows 245.5 382.0 495.2 667.1 570.7 508.7 629.9 606.2 583.7 697.1
Net FDI inflows 208.5 314.5 387.5 534.1 624.1 400.0 501.5 554.8 521.6 620.6
Net portfolio equity inflows 36.9 67.5 107.7 133.0 -53.4 108.8 128.4 51.4 62.1 76.5
Net debt flows 101.9 137.7 191.2 462.6 259.6 165.1 496.8 398.2
Official creditors -24.3 -64.3 -69.0 1.5 29.5 80.5 71.2 50.0
World Bank 2.4 2.6 -0.3 5.2 7.2 18.3 22.4 12.0
IMF -14.7 -40.2 -26.7 -5.1 10.8 26.8 13.8 8.0
Other official -11.9 -26.8 -42.0 1.5 11.5 35.4 35.0 30.0
Private creditors 126.1 202.0 260.2 461.1 230.1 84.6 425.6 348.2 223.7 319.3
Net M-L term debt flows 73.2 120.4 164.9 292.8 234.4 69.9 157.1 168.2
Bonds 33.9 49.4 34.3 91.7 26.7 51.1 111.4 110.1
Banks 43.4 76.2 135.0 204.7 212.5 19.8 44.1 68.0
Other private -4.2 -5.1 -4.4 -3.5 -4.8 -1.1 1.6 0.1
Net short-term debt flows 52.9 81.6 95.3 168.3 -4.4 14.7 268.5 180.0
Balancing item /a -142.5 -401.7 -473.1 -486.4 -786.1 -273.0 -596.0 -611.9
Change in reserves (- = increase)
-395.7 -405.1 -636.9 -1085.3 -452.5 -681.9 -752.0 -578.4
Memorandum items 292.8
Net FDI outflows -46.1 -61.7 -130.4 -150.5 -214.5 -148.2 -217.2 -238.1
Migrant remittances /b 155.6 187.0 221.5 278.2 323.8 306.8 325.3 351.2 376.7 406.3
As a percent of GDP
2004 2005 2006 2007 2008 2009 2010p 2011f 2012f 2013f
Net private and official inflows 4.3 5.4 6.1 8.1 4.9 4.2 5.8 4.5
Net private inflows (equity+debt)
4.6 6.1 6.7 8.0 4.8 3.7 5.4 4.3 3.3 3.7
Net equity inflows 3.1 4.0 4.4 4.8 3.4 3.1 3.2 2.7 2.4 2.5
Net FDI inflows 2.6 3.3 3.4 3.8 3.7 2.5 2.6 2.5 2.1 2.2
Net portfolio equity inflows 0.5 0.7 1.0 0.9 -0.3 0.7 0.7 0.2 0.3 0.3
Private creditors 1.6 2.1 2.3 3.3 1.4 0.5 2.2 1.6 0.9 1.2
Source: The World Bank
Note :
e = estimate, f = forecast
/a Combination of errors and omissions and transfers to and capital outflows from developing countries.
/b Migrant remittances are defined as the sum of workers’ remittances, compensation of employees, and migrant transfers
Global Economic Prospects January 2012 Main Text
8
billion in 2010. According to JP Morgan,
emerging-market fixed-income inflows did
somewhat better, ending the year with inflows of
$44.8 billion — nevertheless well below the $80
billion of inflows recorded in 2010. Foreign
selling was particularly sharp in Latin America,
with Brazil posting large outflows in the third
quarter, partly due to the imposition of a 6
percent tax (IOF) on some international financial
transactions.
In the second half of 2011 gross capital flows to
developing countries plunged to $170 billion,
only 55 percent of the $309 billion received
during the like period of 2010. Most of the
decline was in bond and equity issuance. Equity
issuance plummeted 80 percent to $25 billion
with exceptionally weak flows to China and
Brazil accounting for much of the decline. Bond
issuance almost halved to $55 billion, due to a
large fall-off to East Asia and Emerging Europe.
In contrast, syndicated bank loans held up well,
averaging about $15 billion per month, slightly
higher than the $14.5 billion in flows received
during the same period of 2010.
Reflecting the reversal in bond and equity flows
in the second half of the year, developing
country currencies weakened sharply. Most
depreciated against the U.S. dollar, with major
currencies such as the Mexican peso, South
African rand, Indian rupee and Brazilian real
having lost 11 percent or more in nominal
effective terms (figure 4). Although not entirely
unwelcome (many developing–country
currencies had appreciated strongly since 2008),
the sudden reversal in flows and weakening of
currencies prompted several countries to
intervene by selling off foreign currency reserves
in support of their currencies.
For 2011 as a whole, private capital inflows are
estimated to have fallen 9.6 percent (table 2). In
particular, portfolio equity flows into developing
countries are estimated to have declined 60
percent, with the 77 percent fall in South Asia
being the largest.
The dollar value of FDI is estimated to have
risen broadly in line with developing country
GDP, increasing by 10.6 percent in 2011. FDI
flows are not expected to regain pre-crisis levels
Figure 5 Industrial production appears to have held up outside of Europe and economies undergoing policy tightening
Source: World Bank.
-15
-10
-5
0
5
10
15
High-income
East-Asia &
Pacific
Europe &
Central Asia
Latin America
& Caribbean
Middle-East
& North
Africa
South Asia
Sub-Saharan
Africa
Jun-11
Jul-11
Aug-11
Sep-11
Oct-11
Nov-11
Industrial output growth, 3m/3m saar
-40
-30
-20
-10
0
10
20
30
40
2011M01
2011M03
2011M05
2011M07
2011M09
2011M11
Japan
China
Brazil & India
Other developing
(also excluding Thailand)
Euro Area
Other high-income
Industrial production volumes, 3m/3m saar
Figure 4. Capital outflows resulted in significant currency
depreciations for many developing countries
Percent change in nominal effective exchange rate (Dec. - Jul. 2011)
Source: World Bank.
-16 -12 -8 -4 0
Mexico
South Africa
India
Brazil
Turkey
Colombia
Chile
Indonesia
Malaysia
Global Economic Prospects January 2012 Main Text
9
until 2013, when they are projected to reach
$620.6 billion (vs. $624.1 billion in 2008).
Overall, net private capital flows to developing
countries are anticipated to reach more than
$1.02 trillion by 2013, but their share in
developing country GDP will have fallen from
an estimated 5.4 percent in 2010 to around 3.7 in
2013.
Data since August suggest negative real-
side effects have been concentrated in
high-income Europe
Available industrial production data (data exist
through October for most regions — November
for the East Asia & Pacific and Europe &
Central Asia regions) suggest that global growth
is about normal, expanding at a 2.9 percent
annualized pace, just below the 3.2 percent
average pace during the 10 years preceding the
2008/09 crisis (figure 5).
Importantly, the data suggest that the financial
turmoil since August has had a limited impact on
growth outside of high-income Europe. In the
Euro Area, industrial production declined at a
2.2 percent annualized rate during the 3 months
ending October 2011 (-4.7 percent saar through
November if construction is excluded), and had
been declining since June. In contrast, Japanese
industry was growing at a 6.5 percent annualized
pace over the same period, boosted by
reconstruction spending and bounce-back effects
following the Tohoku disaster. Growth in the
United States through November was a solid 3.8
percent. And growth among the remaining high-
income countries was also strong at 4.4 percent
during the three months ending October.
Among large developing countries, industrial
production has been falling for months in Brazil,
India, and weak or falling in Russia and Turkey
— reflecting policy tightening undertaken to
bring inflation under control. Output in China
has been growing at a steady 11 percent
annualized rate through November, while
smaller developing countries (excluding above
mentioned countries and Thailand where output
fell 48 percent in October and November
following flooding) have also enjoyed positive,
if weak growth of around 2.4 percent (versus 3.7
average growth during the 10 years before the
August 2008 crisis (see box 2 for more).
November readings in India and Turkey suggest
that the downturn in those two economies may
have bottomed out.
The post August turmoil has impacted trade
more directly
Trade data suggests a clearer impact from the
turmoil in financial markets and weakness in
Europe. The dollar value of global merchandise
imports volumes fell at an 8.0 percent annualized
pace during the three months ending October
2011. And import volumes of both developing
and high-income countries declined, with the
bulk of the global slowdown due to an 18
percent annualized decline in European Union
imports (figure 6).
Figure 6 Trade momentum has turned negative
Source: World Bank.
Contribution to growth of global import volumes, 3m/3m saar
-20
-15
-10
-5
0
5
10
15
20
25
30
35
2010M01
2010M04
2010M07
2010M10
2011M01
2011M04
2011M07
2011M10
China
Rest of Developing
Japan
European Union
USA
Rest of High-Income
World
14
-30
-20
-10
0
10
20
30
40
European
Union
Japan
High-income
other
East-Asia &
Pacific
Europe &
Central Asia
Latin America
& Caribbean
Middle-East &
North Africa
South Asia
Sub-Saharan
Africa
2010Q4
2011Q1
2011Q2
2011Q3
Most Recent
Merchandise export volumes, growth, 3m/3m saar
Global Economic Prospects January 2012 Main Text
10
Box 2. Mixed evidence of a slowing in regional activity
Regional data suggest a generalized slowing among developing economies, mainly reflecting domestic rather than
external factors.
In the East Asia and Pacific region, industrial production growth eased from a close to 20 percent annualized
pace during the first quarter of 2011 (3m/3m, saar), to 5.6 percent in the second quarter. Since then growth
recovered, except in Thailand where flooding has caused industrial production to decline sharply. Excluding
Thailand, industrial production for the remainder of the region accelerated to a 10.1 percent annualized pace
in the three months ending November 2011 (5.7 percent if both Thailand and China are excluded).
In developing Europe and Central Asia industrial production also began the year expanding at a close to 20
percent annualized rate (3m/3m saar), but weakened sharply beginning in the second quarter and declined
during much of the third quarter. Since then activity has picked up and expanded at a 5.9 percent annualized
rate during the three months ending November 2011.
In Latin American and the Caribbean, activity in the region’s largest economies has been slowing mainly
because of policy tightening and earlier exchange rate appreciations. For the region as a whole industrial pro-
duction has been declining since May, and was falling at a 2.9 percent annualized rate in the 3 months ending
November, while GDP in Brazil was stagnant in the third quarter. Weaker export growth (reflecting a slowing
in global trade volumes and weaker commodity imports from China) is also playing a role. Regional export
growth has declined from a 14.1 percent annualized rate in the second quarter to 5.2 percent during the three
months ending November.
Activity in the Middle East and North Africa has been strongly affected by the political turmoil associated
with the ―Arab Spring‖, with recorded industrial activity in Syria, Tunisia, Egypt and Libya having fallen by
10, 17, 17 and 92 percent at its lowest point according to official data. Output has recouped most or more than
all of those losses in Egypt and Tunisia. Elsewhere in the region output has been steadier, but weakened mid-
year and was falling at a 0.8 percent annualized rate during the three months ending July (latest data).
Activity in South Asia, like Latin America, has been dominated by a slowdown in the region’s largest econ-
omy (India). Much weaker capital inflows and monetary policy tightening contributed to the 2.9 percent de-
cline in India’s industrial output in October (equivalent to a 12.4 percent contraction at seasonally adjusted
annualized rates in the three-months ending October). Elsewhere in the region, industrial production in Sri
Lanka and Pakistan is expanding rapidly. The global slowdown has also been taking its toll on South Asia,
with merchandise export volumes which had been growing very strongly in the first part of the year, declin-
ing almost as quickly in the second half such that year-over-year exports in October are broadly unchanged
from a year ago.
Industrial activity in Sub-Saharan Africa (Angola, Gabon, Ghana, Nigeria, and South Africa are the coun-
tries in the region for which industrial production data are available) was declining in the middle of the year,
with all countries reporting data showing falling or slow growth with the exception of Nigeria. Recent months
have however shown a pick up. In the three months ending in August, industrial activity expanded at 0.8 per-
cent annualized rate, supported by output increases among oil exporters and despite a decline in output in
South Africa during that period, the region’s largest economy. Industrial activity in South Africa has since
strengthened, growing at a picked up to 14.9 percent annualized rated in the three months ending in October.
The mirror of the slowing in global imports has
been a similar decline in export volumes. High-
income Europe has seen its exports decline in
line with falling European imports (data include
significant intra-European trade). In Japan,
exports expanded at an 18.5 percent annualized
pace in the third quarter, while the exports of
other high-income countries grew at a relatively
rapid 3.4 percent annualized pace. Developing
country exports declined at a 1.2 percent
annualized pace in 2011Q3 and have continued
to decline through November, with the sharpest
drop in South Asia (although this follows very
rapid export growth in the first half of the year).
Exports in East Asia have also been falling at
double-digit annualized rates, in part because of
disruptions to supply chains caused the by the
flooding in Thailand. The exports of developing
Europe and Central Asia were expanding slowly
during the three months ending October 2011,
while data for Latin America suggest that at 5.2
percent through November, export growth is
Global Economic Prospects January 2012 Main Text
11
strengthening. Insufficient data are available for
other developing regions to determine post-
August trends.
Overall, the real-side data available at this point
are consistent with a view that the turmoil that
began in August has dampened the post Tohoku
rebound in activity. The dampening effect has
been most pronounced in Europe, but is
observable everywhere. This interpretation is
broadly consistent with forward looking business
sentiment surveys. All of these point to slower
growth in the months to come, but the sharpest
negative signal (and the only one to deteriorate
markedly post August 2011) is coming from the
European surveys. Other high-income surveys
are more mixed suggesting slower but still
positive growth. PMI’s for developing countries
are also mixed, with two thirds indicating
strengthening growth, but the aggregate
declining in November, mainly because of a
sharp deterioration in expectations coming out of
China—although at least one December
indicator for China shows a pickup (figure 7).
Declining commodity prices and inflation
are further indicators of the real-side
effects of recent turmoil
Commodity prices, which increased significantly
during the second half of 2010, stabilized in
early 2011 and, except for oil whose price picked
up most recently, have declined since the
beginning of August (figure 8). Prices of metals
and minerals, historically the most cyclical of
commodities
1
, averaged 19 percent lower in
December compared with July, while food and
energy prices are down 9 and 2 percent,
respectively. Although concerns over slowing
demand certainly have played a role, increased
risk aversion may also have been a factor in
causing some financial investors in commodities
to sell.
Among agricultural prices, maize and soybeans
prices fell 17 and 15 percent over the past 6
months on improved supply prospects, especially
from the United States and South America.
Partly offsetting these declines, rice prices rose
14 percent in part due to the Thai government’s
increase in guarantee prices (which induced
stock holding and less supply to global markets).
The flooding in Thailand may have led to some
tightness in the global rice market, but the
impact was marginal as most of the crop had
already been harvested. Indeed, rice prices have
declined most recently by almost 5 percent
during December 2011. Looking forward,
India’s decision to allow exports of non-Basmati
Figure 7 Business surveys point to a slowing in activity
Sources: JPMorgan, World Bank aggregation using country-
45
47
49
51
53
55
57
59
61
2010M01
2010M04
2010M07
2010M10
2011M01
2011M04
2011M07
2011M10
Global
Other high-income
European Union
Developing
50-line
Purchasing managers index (PMI), points
Values above 50 indicate expected growth, below 50 suggest contraction
Figure 8 Stable food prices and falling metals and energy prices have contributed to a deceleration in developing-world
inflation
Source: World Bank.
0
5
10
15
20
25
Jan-07
Jul-07
Jan-08
Jul-08
Jan-09
Jul-09
Jan-10
Jul-10
Jan-11
Jul-11
Developing country, Food CPI
Developing country, Total CPI
Total and food inflation (3m/3m saar)
29
50
100
150
200
250
300
Jan-04
Jan-05
Jan-06
Jan-07
Jan-08
Jan-09
Jan-10
Jan-11
Jan-12
Food
Metal and Minerals
Energy
Commodity price indexes, USD, 2005=100
Global Economic Prospects January 2012 Main Text
12
rice along with good crop prospects elsewhere in
the region, are likely to keep rice prices in check.
Despite recent declines, commodity prices
remain significantly higher in 2011 than in 2010
(14.4, 29.9 and 23.9 percent higher for the prices
of metals and minerals, energy, and food
respectively).
But alongside this generalized improvement,
severe localized food shortages persist, notably
in the Horn of Africa, where crop failure and
famine threaten the livelihoods of over 13
million people (World Bank, 2011).
Weaker commodity prices have contributed to
lower inflation
Partly reflecting the initial stabilization and then
decline in commodity prices, but also the
slowing in economic activity, headline inflation
has eased in most of the developing world
(second panel figure 8). The annualized pace of
inflation has declined from a peak of 9.0 percent
in January 2011, to 6.0 percent during the three
months ending November 2011. Domestic food
inflation has eased as well from a 15.7 percent
annualized rate in February 2011, to about 6.2
percent during the three months ending June
2011.
Inflationary pressures have declined in most
regions, but appear to be strengthening once
again in Europe & Central Asia and South Asia
(figure 9). Although inflation is decelerating in
most regions, inflation remains elevated and of
concern in several countries, including
Bangladesh, Ethiopia, India, Kazakhstan, Kenya,
Nigeria, Tanzania, Turkey, and Vietnam. Among
high-income countries, inflation has softened
from 4.5 percent annualized rates in February
2011 to 2.2 percent by October.
An uncertain outlook
Overall, global economic conditions are fragile,
and there remains great uncertainty as to how
markets will evolve over the medium term.
While data to-date does not indicate that there
was strong real-side contagion from the up-tick
in financial turmoil since August, the
pronounced weakness of growth and the cut-
back capital flows to developing countries will
doubtless way on prospects and could potentially
undermine the expected recovery in growth
among middle-income countries that underpins
the projections outlined earlier in Tab1e 1.
Additional risks to the outlook include the
possibility that geopolitical and domestic
political tensions could disrupt oil supply. In the
Middle-East and North Africa, although political
turmoil has eased, there remains the possibility
that oil supply from one or more countries could
be disrupted, while mounting tensions between
Iran and high-income countries could yield a
sharp uptick in prices, because of disruption to
supply routes, or because of sanctions imposed
Figure 9 Inflationary pressures are rising in
Europe & Central Asia and South Asia
Source: World Bank.
0
5
10
15
20
25
High-income
East-Asia &
Pacific
Europe &
Central Asia
Latin America
& Caribbean
Middle-East &
North Africa
South Asia
Sub-Saharan
Africa
Long-term average (2000-present)
2010Q4
2011Q1
2011Q2
2011Q2
Most Recent (Nov in most cases)
Quarterly inflation rate, annualized
Figure 10 Market uncertainty has spread to core-
European countries
Source: DataStream, World Bank.
0
100
200
300
400
500
600
700
Jan-11
Mar-11
May-11
Jul-11
Sep-11
Nov-11
Jan-12
Germany
France
UK
Japan
lmic <200
Italy
5-yr sovereign credit-default swap rates, basis points, Jan 2011-Jan 2012
4
Global Economic Prospects January 2012 Main Text
13
Box 3 Regional outlook
The regional annexes to this report contain more detailed accounts of regional economic trends, including country-
specific forecasts
The East Asia and Pacific region was disrupted by Japan’s Tohoku disaster. Industrial production and exports
were hard hit, but are recovering as production chains re-equilibrate. Severe summer floods in Thailand have also
caused significant disruption and contributed to regional slowing in the second half of the year. Overall, GDP
growth in the region is projected to expand by 8.2 percent in 2011 while inflation is easing across the region.
Strong domestic demand and productivity growth should help the region withstand the effects of the projected
global slowing in the baseline scenario. As a result, regional growth is projected to slow only modestly to 7.8 per-
cent in both 2012 and 2013. However, the very open nature of the regional economy makes it particularly vulner-
able to a major decline in global demand. All the more so, as there is less room than in 2008 for fiscal expansion
should a major crisis emerge.
In developing Europe and Central Asia, growth has been slowing due to a combination of weakening domestic
as well as external demand (especially from the Euro area). While resource-rich economies are benefiting from
still high commodity prices and good harvests, several countries have been affected by the ongoing euro debt crisis
because of their significant financial and trade linkages to problem countries. Despite strong growth in the earlier
part of the year, growth for the region is expected to just exceed the 5.2 percent pace of 2010 in 2011. Ongoing
household and banking-sector deleveraging and global economic uncertainty are projected to contribute to a de-
cline in growth to 3.2 percent in 2012, before the pace of the expansion picks up to 4.0 percent in 2013. Several
Central European countries are particularly vulnerable to the deepening crisis in the Euro Area, due to trade link-
ages, high-levels of maturing debt, and domestic-bank dependency on high-income Europe parent-bank lending.
Commodity exporters in the region could also run into difficulties if a deterioration in the global situation results
in a major decline in commodity prices.
Growth in Latin America and the Caribbean is expected to decelerate to a below-trend pace of 3.6 in 2012 from
an estimated 4.2 percent in 2011. Softer global growth in high-income countries and China is projected to hurt
exports, while rising borrowing costs and scarcer international capital will take a toll on investment and private
consumption. Growth is expected to strengthen to above 4.0 percent in 2013 boosted by stronger external demand,
but weaker domestic demand reflecting recent policy tightening is projected to keep growth in Brazil, for example
relatively weak. Growth is projected to decelerate sharply in Argentina due to easing domestic demand. Slow
albeit stronger growth in the United States is expected to temper prospects in Mexico and in Central America and
the Caribbean due to weak tourism and remittances flows, although reconstruction efforts in Haiti will sustain
strong growth there and in the Dominican Republic. Incomes in many countries in the region have benefitted be-
cause of high commodity prices, and future prospects will be vulnerable to the kinds of significant declines that
might accompany a sharp weakening in global growth.
Economic activity in the developing Middle East and North Africa region has been dominated by the political
turmoil of the ―Arab Spring‖ and strong oil prices. Despite high exposures to the weakening European export mar-
ket, industrial production is improving and exports and remittances have performed better than earlier anticipated.
But tourism and FDI revenues are exceptionally weak, and government deficits high. Oil exporters of the region
have used substantial revenue windfalls to support large infrastructure and social expenditure programs, while in
other countries political tensions have carried large negative effects on households and business, knocking GDP to
losses for the year. Looking forward, the region is vulnerable to a global downturn in 2012, through adverse terms
of trade effects, and strong linkage with the Euro area. Assuming that the domestic drag on growth from political
uncertainty begins to ease, regional GDP is projected to expand by 2.3 percent in 2012, with output strengthening
further to a 3.2 percent rate in 2013.
In South Asia, GDP growth is expected decelerate to 5.8 percent during the calendar year 2012, down from 6.6
percent rate recorded in 2010, reflecting domestic and external headwinds. Domestic demand is expected to con-
tinue to slow, with private consumption being hampered by sustained high inflation that has cut into disposable
incomes. Rising borrowing costs have cut into outlays for consumer durables and investment, with heightened
uncertainty and delayed regulatory reforms also playing a role. The external environment is expected to remain
difficult, with continued market unease and a significant weakening of foreign demand. South Asian governments
have limited space with which to introduce counter-cyclical fiscal stimulus measures due to large fiscal deficits,
Global Economic Prospects January 2012 Main Text
14
by high-income countries that shift demand
away from Iran toward other producers.
2
The situation in Europe also presents an
important source of risk going forward. Most
recently, several successful bond sales by high-
spread countries have caused spreads to decline,
offering some hope that the worst of the crisis
may have passed (see earlier figures 2 & 3).
However, experience suggests they may yet sour
yet again — even though from an objective point
of view steps taken go along way to alleviating
the concerns that initially led to the loss of
confidence and freezing up of capital markets
(see earlier box 1).
Overall, as of early January CDS spreads for
high-spread European countries were about 173
basis points higher than in July (1,153 basis
points if Greece is included in the mix) and stock
markets some 17.6 percent below their July
levels.
That said, steps taken thus far have been
successful in reducing or stabilizing spreads on
several major high-income countries (Germany
and the United Kingdom) and in developing
countries (figure 10). Moreover, as noted above
yields on several recent bond auctions
(especially short-term bonds), including by
Spain and Italy, have declined.
Despite progress made, markets remain volatile,
and funding pressures on banks elevated.
Worryingly, the spread between interbank
interest rates and central bank overnight lending
rates (a measure of private banks’ concerns over
counter-party risk) continue to rise and have
reached almost 100 basis points in Europe and
while the possibility of monetary easing is constrained by still high inflation. Given the possibility of further weak-
ening in the global economy, efforts at greater revenue mobilization (particularly in Pakistan, Sri Lanka, Bangla-
desh, and Nepal) and expenditure rationalization (especially in India) could pay dividends by allowing govern-
ments to maintain critical social and infrastructure programs.
Notwithstanding the recent perturbations in the global economy, as well as the drought in the Horn of Africa,
growth prospects in Sub Saharan Africa remain healthy over the forecast horizon. Recent economic develop-
ments have, however, reduced the growth momentum in Sub-Saharan Africa and shaved off between 0.1 and 0.5
percent of GDP growth in the region. Thus, GDP is now estimated to have expanded 4.9 percent in 2011—about
0.2 percentage points slower than had been expected in June, and output is projected to expand 5.3 and 5.6 percent
in 2012 and 2013, respectively, assuming no further significant downward spiral in the global economy. However,
the uncertain global environment means that downside risks are significant. In the event of a deterioration of con-
ditions in Europe, growth in Sub-Saharan Africa could decline by 1.6-4.2 percent compared with the current fore-
casts for 2012, with oil and metal prices falling by as much as 18 percent and food prices by 4.5 percent. The fiscal
impact of commodity price declines could be as high as 1.7 percent of regional GDP.
Table 3. Baseline represents a significant downgrade
from June edition of Global Economic Prospects
Source: World Bank.
2011 2012 2013
(Difference in aggregate growth rates)
World -0.5 -1.1 -0.5
High-income countries -0.6 -1.3 -0.6
Euro Area -0.2 -2.1 -0.9
Other high-income -0.8 -0.9 -0.5
Developing -0.2 -0.8 -0.3
Low-income 0.1 0.0 0.0
Middle-income -0.2 -0.8 -0.3
Oil exporting 0.1 -0.5 0.0
Oil importing -0.4 -0.9 -0.4
Regions
East Asia & Pacific -0.3 -0.3 -0.5
Europe & Central Asia 0.6 -1.1 -0.3
Latin America & Caribbean -0.3 -0.6 0.1
Middle-East & North Africa -0.1 -1.2 -0.7
South Asia -0.9 -1.9 -0.8
Sub-Saharan Africa -0.1 -0.4 -0.1
Figure 11 Indicators of counter-party risk in bank-
ing-sector continue to rise
Source: DataStream, World Bank.
0
50
100
150
200
250
300
350
400
Jan-08
Jul-08
Jan-09
Jul-09
Jan-10
Jul-10
Jan-11
Jul-11
Jan-12
Indications of rising concerns about
counter-party risk in European
banking system
Interbank overnight spreads, basis points
Global Economic Prospects January 2012 Main Text
15
50 basis point in the United States (figure 11).
And, markets are likely to remain skittish for
some time until they become convinced that the
initiatives announced at the national and
multinational level are being carried through and
are succeeding in restoring economic growth and
fiscal accounts to a sustainable path.
The baseline projections of this edition of Global
Economic Prospects presented in the earlier
Table 1 assume that efforts to-date and those that
follow prevent the sovereign-debt stress of the
past months from deteriorating further, but fail to
completely eradicate market concerns. With high
-income country growth of 1.4 and 2.0 percent in
2012 and 2013, and developing country growth
of 5.4 and 6.0 percent over the same two years,
these projections reflect a substantial downward
revision to prospects from those of June 2011
(table 3).
In the baseline, the recovery in the United States
is projected to continue in the fourth quarter of
2011, with growth around 3 percent before
weakening to an average of 2.2 percent in 2012
as fiscal stimulus is withdrawn, and 2.4 percent
in 2013. In high-income Europe, uncertainty has
taken its toll, with annualized growth declining
from 2.9 percent in the first quarter to 1.1
percent in the third quarter of 2011 due to fiscal
tightening, financial stress, banking-sector
deleveraging, and plunging confidence (the
ECB’s latest bank lending survey shows a
tightening of lending standards to households
and corporations that will weigh on activity in
the fourth quarter and beyond). As a result, the
Euro Area is expected to enter into recession in
the fourth quarter of 2011 and whole-year GDP
is forecast to decline by 0.3 percent in 2012 (the
broader European Union is expected to grow 0.1
percent). Growth in Japan is projected to
accelerate to around 1.9 percent in 2012,
reflecting reconstruction efforts and continued
rebound from the Tohoku disaster.
Under these conditions, growth in developing
countries is now estimated to have eased to 6
percent in 2011 and projected to decline further
to 5.4 percent in 2012, before firming somewhat
to 6.0 percent in 2013—a 0.2, 0.8 and 0.3
percentage point reduction in the growth outlook
since the June 2011 edition of Global Economic
Prospects (see table 3, box 3, and Regional
Annexes for more details on regional economic
prospects).
Global trade in goods and non-factor services is
projected to slow to about 4.7 percent in 2012
before picking up to 6.8 percent in 2013.
Thinking through downside scenarios
The slow unwinding of tensions implicit in the
baseline projections of this Global Economic
Prospects remains a likely outcome for the
global economy. But, how that plays out is
highly uncertain. As a result, even assuming no
serious deterioration (or rapid improvement) in
conditions, growth could be noticeably stronger
or weaker than in this baseline projection.
Moreover, the possibility of much worse
outcomes are real and market tensions are
particularly elevated. What form an escalation of
the crisis might take, should one occur, is very
uncertain — partly because it is impossible to
predict what exactly might trigger a deterioration
in conditions, and partly because once unleashed
the powerful forces of a crisis of confidence
could easily take a route very different from the
one foreseen by standard economic reasoning.
It follows that any downside scenario that might
be envisaged to help developing-country
policymakers understand the nature and size of
potential impacts will suffer from false precision
(both in terms of the assumptions that the
scenario makes about the nature and strength of
precipitating events, and as to the path and
magnitude of their impacts).
The scenarios outlined in Box 4 are no different
in this respect and are presented, in the spirit of
recent stress-tests of banking systems, as a tool
that could help policymakers in developing
countries prepare for the worst by helping them
better understand the relative magnitude of
potential effects, and gain some insights as to the
extent and nature of vulnerabilities across
countries. These simulations should not be
viewed as predictive. They are presented with
full recognition of the limitations of the tools
that underpin them. If a downside scenario
actually materializes, its precise nature, triggers,
and impacts will doubtless be very different
from these illustrations.
Global Economic Prospects January 2012 Main Text
16
Box 4 Downside scenarios
In the current economic context, the risk that markets lose confidence in the ability of one or more high-income
countries to repay their debt is very real. The OECD (2012) estimates that high-income countries will need to bor-
row $10.5 trillion in 2012 (almost twice their borrowing levels in 2005). Moreover, almost 44 percent of the debt
in the OECD is relatively short-term debt, meaning that borrowers will have to come repeatedly to the market.
Ratings agencies have warned of further downgrades, and although reforms to date have been greeted positively,
markets are requiring a significant premium on the debt issues of stressed economies.
In a first scenario (box table 4.1) it is assumed that one or two small Euro Area economies (equal to about 4 per-
cent of Area GDP) face a serious credit squeeze. An inability to access finance that extends to the private sectors
of the economies causes GDP in the directly affected
countries to fall by 8 or more percent (broadly consistent with
the decline already observed in Greece and in other high-
income economies that have faced financial crises — see
Abiad and others, 2011). Other (mainly European) economies
are affected through reduced exports (imports from the directly
affected countries fall by 9 percent). It is assumed in this sce-
nario that although borrowing costs in other European econo-
mies rise and banks tighten lending conditions due to losses in
the directly affected economies, adequate steps are taken in
response to the crisis to ensure that banking-sector stress in
Europe is contained and does not spread to the rest of the high-
income world. However, uncertainty and concerns about po-
tential further credit squeezes does induce increased precau-
tionary savings among both firms and households worldwide.
3
Overall, GDP in the Euro Area falls by 1.7 percent relative to
baseline, and by a similar margin in the rest of the high-income
world. Developing countries are also hit. Direct trade and
tighter global financial conditions plus increases in domestic
savings by firms and households as a result of the increased
global uncertainty contribute to a 1.7 percent decline in middle
-income GDP relative to baseline in 2012. The decline among
low-income countries (1.4 percent) is slightly less pronounced
reflecting weaker financial and trade integration. Weaker
global growth contributes to a 10-12 percent decline in oil
prices and a 2.5 percent drop in internationally-traded food
commodity prices.
In a second scenario (box table 4.2) the freezing up of credit is
assumed to spread to two larger Euro Area economies (equal to
around 30 percent of Euro Area GDP), generating similar de-
clines in the GDP and imports of those economies. Repercus-
sions to the Euro Area, global financial systems and precau-
tionary savings are much larger because the shock is 6 times
larger.
4
Euro Area GDP falls by 6.0 percent relative to the
baseline in 2013. GDP impacts for other high-income countries
(-3.6 percent of GDP) and developing countries (-4.2 percent )
are less severe but still enough to push them into a deep reces-
sion. Overall, global trade falls by 2.6 percent (7.5 percent rela-
tive to baseline) and oil prices by 24 percent (5 percent for
food).
Table box 4.1 Impact of a small contained
crisis
2011 2012 2013
(% deviation of GDP from baseline)
World 0.0 -1.7 -1.7
High-income countries 0.0 -1.7 -1.7
European Union 0.0 -1.7 -1.5
Other high-income 0.0 -1.6 -1.7
Developing 0.0 -1.7 -1.8
Low-income 0.0 -1.4 -1.5
Middle-income 0.0 -1.7 -1.8
Oil exporting 0.0 -1.8 -2.0
Oil importing 0.0 -1.7 -1.7
Regions
East Asia & Pacific 0.0 -1.8 -1.8
Europe & Central Asia 0.0 -1.8 -1.9
Latin America & Caribbean 0.0 -1.7 -2.0
Middle-East & North Africa 0.0 -1.3 -1.6
South Asia 0.0 -1.7 -1.7
Sub-Saharan Africa 0.0 -1.8 -1.6
Table box 4.2 Impact of a larger crisis also
affecting two large Euro Area economies
Source: World Bank.
2011 2012 2013
(% deviation of GDP from baseline)
World 0.0 -3.8 -4.3
High-income countries 0.0 -3.8 -4.3
European Union 0.0 -5.6 -6.0
Other high-income 0.0 -3.1 -3.6
Developing 0.0 -3.6 -4.2
Low-income 0.0 -2.9 -3.4
Middle-income 0.0 -3.6 -4.2
Oil exporting 0.0 -3.5 -4.4
Oil importing 0.0 -3.6 -4.0
Regions
East Asia & Pacific 0.0 -3.7 -4.1
Europe & Central Asia 0.0 -4.4 -5.2
Latin America & Caribbean 0.0 -3.0 -3.8
Middle-East & North Africa 0.0 -3.1 -4.4
South Asia 0.0 -3.5 -3.9
Sub-Saharan Africa 0.0 -3.7 -3.7
Global Economic Prospects January 2012 Main Text
17
With these caveats in mind, these simulations
suggest that if there were a major deterioration in
conditions, GDP in developing countries could
be much (4.2 percent) weaker than in the
baseline. Moreover, unlike 2008/09, global
growth is not expected to bounce back as quickly
because economies enter into this crisis in much
weaker positions than in 2008/09. They have
much less fiscal and monetary policy space
(especially high-income countries) with which to
offset the collapse in demand and to bailout
banks and other financial institutions that may
find themselves in trouble.
Developing countries are more
vulnerable than in 2008
Whatever the actual outcomes for the world
economy in 2012 and 2013 several factors are
clear. First, growth in high-income countries is
going to be weak as they struggle to repair
damaged financial sectors and badly stretched
fiscal balance sheets. Developing countries will
have to search increasingly for growth within the
developing world, a transition that has already
begun but is likely to bring with it challenges of
its own. Should conditions in high-income
countries deteriorate and a second global crisis
materializes, developing countries will find
themselves operating in a much weaker global
economy, with much less abundant capital, less
vibrant trade opportunities and weaker financial
support for both private and public activity.
Under these conditions prospects and growth
rates that seemed relatively easy to achieve
during the first decade of this millennium may
become much more difficult to attain in the
second, and vulnerabilities that remained hidden
during the boom period may become visible and
require policy action.
The remainder of this report examines some of
these potential vulnerabilities and attempts to
offer some policy advice for developing
countries to help prepare for what is likely to be
a weaker global economy going forward, and
what potentially could be a second major global
recession.
Figure 12 Most developing countries have modest
debt levels
Source: World Bank Debt Reporting System.
0
50
100
150
200
250
-18 -16 -14 -12 -10 -8 -6 -4 -2 0
High-Income
East Asia & Pacific
Europe & Central ASia
Latin America & Caribbean
Middle-East & North Af rica
South Asia
Sub-Saharan Africa
Italy
Eritrea
Cape Verde
Lesotho
USA
Ireland
Japan
Government deficit % of GDP
Debt to GDP ratio
Figure 13 Developing countries have much less fiscal space than in 2008, partly for cyclical reasons
43% of developing countries have government deficit of 4% of GDP or more in 2011, vs 18% in 2007
Source: World Bank
0
5
10
15
20
25
30
35
40
-15
-10
-8
-6
-4
-2
0
2
4
More
2007
2011
Percent of developing countries
Government balance (% of GDP)
-4.0
-2.0
0.0
2.0
4.0
6.0
8.0
10.0
1993
1995
1997
1999
2001
2003
2005
2007
2009
2011
2013
Output gap
Real GDP growth
Potential GDP growth
percent
Global Economic Prospects January 2012 Main Text
18
Box 5 Structural budget balances
Fluctuations in the business cycle and external factors such as commodity prices can have a significant impact on a
country’s fiscal position. In developing countries, tax revenues vary significantly with the business cycle, rising
when economic activity is buoyant or commodity prices are high. In similar, but reverse fashion, expenditures
(unemployment and social security related) tend to rise when activity is low. Indeed, during the boom year 2007
developing countries’ fiscal revenues increased by nearly 26 percent in U.S. dollar terms, only to fall by 10 percent
in 2009 during the recession.
The structural budget balance (or cyclically adjusted budget balance) attempts to provide a sense of what the
budget balance would be if GDP were equal to its underlying trend. By definition, estimates of structural budget
balances are subject to significant imprecision, partly because they rely on estimates of potential output (itself sub-
ject to significant estimation error) and partly because isolating the cyclical component of government revenues
and expenditures in a constantly changing policy environment is very difficult.
The estimates of structural budget balance presented here are based on World Bank estimates of potential output,
which project developing country potential growth of around 5½ – 6 percent during 2011/13 (World Bank, 2010)
buoyed by strong productivity growth and fixed investment growth of around 7 – 8½ percent.
According to these estimates, cyclical revenue in developing countries peaked at 2.1 percent of GDP in 2007, but
fell to about -0.6 in 2009 – a total cyclical fiscal revenue swing of nearly 3 percent of GDP within two years. This
was mostly related to developing country output gaps declining from +3.5 percent in 2007 to -1.2 percent in 2009
for the 125 countries with fiscal data.
Overall, and reflecting that developing country output gaps are close to zero, the structurally adjusted fiscal bal-
ance of developing countries in 2011 is estimated to be roughly equal to the actual budget balance. But there is
significant divergence among the regions’ estimated budget balances in calendar 2011 (box figure 5.1). In high-
income countries, the estimated cyclical revenue component is relatively large and negative, reflecting the still
large output gaps observed in many of these economies.
Fiscal deficits among commodity exporters (and countries with large subsidies on commodity consumption) are
sensitive to fluctuations in commodity prices. Turner (2006) uses estimates of a real-income gap (or the output gap
adjusted for terms of trade effects) that adjusts government revenues and expenditures for abnormally high/low
commodity prices as well as the business cycle. Such a measure assumes that much of the run up in commodity
prices since 2005 was temporary. As a result, it ascribes a larger share of increased government revenues to cycli-
cal forces and results in higher structural deficits than the more traditional measure that is retained here.
Box figure 5.1 Cyclical surplus in 2007 has disappeared, although results by region differ widely
Source: World Bank.
-3.0
-2.0
-1.0
0.0
1.0
2.0
3.0
4.0
2003
2004
2005
2006
2007
2008
2009
2010
2011
2012
2013
Developing countries: Output gap
Developing countries: Cyclical revenue
percent of GDP
-10.0
-8.0
-6.0
-4.0
-2.0
0.0
2.0
G7 countries
High-income
Developing
countries
East Asia &
Pacific
Europe &
Central Asia
Latin America
& Caribbean
Middle East &
N. Africa
South Asia
Sub-Saharan
Af rica
Actual budget balance
Cyclical component
Structural budget balance
percent of GDP
Global Economic Prospects January 2012 Main Text
19
Conditions today are less propitious for
developing countries than in 2008
One of the more positive elements of the
recession of 2008/9 was the speed with which
developing countries (other than those in Central
and Eastern Europe) exited the crisis. Indeed, by
2010, 51 percent of developing countries had
regained levels of activity close to or even above
estimates of their potential output).
This was in stark contrast to many high-income
countries, where, even now, GDP remains well
below the levels that might have been expected
had pre-crisis trends continued. The good
performance partly reflects the healthy fiscal,
current account and reserves positions with
which most developing countries entered the
crisis, which allowed most to absorb a large
external shock without serious domestic
dislocation (see Didier, Hevia, and Schmukler,
2011).
Today fiscal conditions are still generally better
in developing countries than in high-income
countries (figure 12). Only 27 countries for
which comprehensive data exist, have fiscal
deficits in excess of 5 percent of GDP, and while
14 have gross debt to GDP ratios in excess of 75
percent, only 3 countries (Eritrea, Egypt and
Lebanon) combine a deficit in excess of 5
percent of GDP and a gross debt to GDP ratio in
excess of 75 percent of GDP in 2011.
Nevertheless, fiscal positions in developing
countries have deteriorated markedly since 2008.
In particular, government balances have fallen
by two or more percent of GDP in almost 44
percent of developing countries in 2012 (figure
13). As a result, developing countries have much
less fiscal space available to respond to a new
crisis.
To a large extent the reduced fiscal space reflects
the fact that in 2007 many countries were at the
peak of a cyclical boom that had boosted fiscal
revenues above normal rates. As a result, fiscal
deficits were smaller by about 2 percent of GDP
than they would have been had activity been in
line with underlying potential. Now most
developing countries are much closer to normal
levels of output, and this cyclical windfall has
disappeared.
Fiscal balances have not deteriorated by the
whole (windfall) amount because policy reforms
and high commodity prices have benefitted fiscal
balances. In most regions structural fiscal
balances (the balance that would be observed if
demand was just equal to potential GDP) have
neither increased nor decreased appreciably (box
5).
Europe and Central Asia and South Asia are
exceptions in this regard. In Europe and Central
Asia the policy reforms necessitated by the very
large shock that the region encountered in
2008/9 resulted in a 3.0 percent of GDP
reduction in structural deficits, from -3 to 0
percent of GDP. In contrast, a sharp increase in
fiscal spending in South Asia contributed to a
3.1 percent deterioration in structural budget
balances to -8.0 percent of GDP in 2011.
High commodity prices have also boosted
government revenues and served to keep deficits
low. For oil exporting developing countries, the
increase in commodity prices since 2005 has
improved government balances by an average of
2.5 percent of GDP, among metal exporters the
improvement has been of the order of 2.9
percent of GDP, while for non-oil non-metals
commodity exporters the improvement has been
much less pronounced.
Independent of whether fluctuations in
commodity revenues (and subsidy expenditures)
Table 4 Impact on fiscal balance of a fall in com-
modity prices like that observed in the 2008/09 crisis
(change in fiscal balance percent of GDP)
Source: World Bank.
2012
World -0.1
High income countries 0.4
Developing countries -1.0
Oil exporting -4.3
Oil importing 0.4
East Asia and Pacific 0.7
Europe and Central Asia -2.9
Latin America and the Caribbean -2.4
Middle East and North Africa -4.8
South Asia 0.3
Sub-Saharan Africa -4.0
Global Economic Prospects January 2012 Main Text
20
are included in the cyclical or structural deficit,
if commodity prices were to fall then fiscal
conditions in exporting countries would
deteriorate rapidly. Simulations suggest that if
commodity prices were to fall as they did in the
2008/09 crisis, fiscal balances in oil exporting
countries could deteriorate by more than 4
percent of GDP. Impacts in metals exporting
countries could also be large, with some regional
impacts exceeding 4 percent of GDP (table 4).
Financial vulnerabilities
The contagion of risk aversion from a few well
defined high-spread, high-income European
countries to developing countries and even to
core Euro Area countries since August 2011 has
changed the game for developing countries. As
noted above, capital flows to developing
countries have declined sharply and risk premia
on both their private and sovereign debt have
increased – raising borrowing costs.
Tighter financial conditions could make
financing current account and government
deficits much more difficult
Should risk aversion escalate further,
international capital flows could decline even
more, forming a binding constraint on the
balance of payments of some countries,
potentially freezing some governments out of
capital markets and even threatening the fiscal
sustainability of some heavily indebted
developing countries by raising borrowing
costs.
5
As a whole, the external financing needs of
developing countries have risen slightly since the
2008/9 financial crisis from an ex ante estimate
Table 5 Countries with large funding requirements may
be vulnerable to a tightening of credit conditions
5
Developing country external financing needs are defined as
the current account deficit (assumed to equal its 2011 share
of GDP times projected nominal GDP in 2012), plus sched-
uled payments on short-term and longer-term debt to private
creditors.
Source: World Bank
External Financing Needs Projections for 2012
Current
Account
Deficit
(share of
Debt
Repayment
(share of GDP)
EFN
(share of GDP)
Lebanon 20.6 14.5 35.1
Nicaragua 16.3 5.6 21.9
Albania 11.7 9.6 21.3
Jamaica 9.8 11.3 21.1
Georgia 12.7 8.2 20.9
Turkey 9.8 9.2 19.0
Lao PDR 14.0 4.7 18.7
Guyana 10.6 7.8 18.4
Belarus 10.5 7.7 18.2
Romania 4.5 13.5 18.0
Moldova 12.1 5.7 17.8
Latvia 0.4 17.2 17.6
Armenia 12.7 4.9 17.6
Bulgaria -2.0 18.6 16.6
Lithuania 2.3 14.1 16.4
Ukraine 5.4 10.9 16.3
Panama 12.3 3.2 15.6
Mauritania 11.2 3.9 15.1
Macedonia, FYR 5.1 7.8 12.9
Jordan 8.5 4.0 12.5
Tanzania 9.1 3.0 12.2
El Salvador 3.8 8.2 12.0
Dominican Republic
8.2 3.4 11.6
Vanuatu 6.7 4.9 11.5
Vietnam 4.9 6.6 11.5
Chile 0.4 10.9 11.3
Kyrgyz Republic 6.9 3.7 10.6
Ghana 7.0 3.4 10.4
Tunisia 5.8 4.4 10.2
Peru 2.7 7.3 10.0
Figure 14 Countries with high levels of short- or matur-
ing long-term debt are at risk
Source: World Bank, Debt Reporting system.
0 5 10 15 20
Bulgaria
Latvia
Lebanon
Lithuania
Romania
Kazakhstan
Jamaica
Ukraine
Chile
Malaysia
Albania
Turkey
El Salvador
Georgia
Macedonia, …
Belarus
Peru
Vietnam
India
Guatemala
Uruguay
Moldova
Nicaragua
Paraguay
Philippines
Short-term debt 2012
(%GDP)
Maturing medium and long
term debt (%GDP)
Global Economic Prospects January 2012 Main Text
21
of $1.2 trillion (7.6 percent of GDP) in 2009 to
$1.3 trillion (7.9 percent of GDP) in 2012.
6
This
apparent stability masks a situation where all
regions, except South Asia, have reduced their
external financing needs as a share of GDP since
2008. South Asia’s estimated external financing
requirements have increased from 5.8 percent to
8.4 percent, mainly because of a sharp rise in
India’s external debt in 2011. As in the 2008/9
crisis, Eastern Europe and Central Asia remains
the most vulnerable developing region, with
external financing needs on the order of 17
percent of GDP. Several countries in the region
have high current account deficits as well as
private debt coming due in 2012.
Estimated financing requirements for 2012
exceed 10 percent of GDP in some 30
developing countries (table 5).
7
In the baseline
scenario, the financing of that debt is unlikely to
pose a problem for most countries, coming in the
relatively stable form of FDI, or remittances. For
others, however, a significant proportion will
have to be financed from historically more
volatile sources (short-term debt, new bond
issuances, equity inflows).
8
If international financial market conditions
deteriorate significantly, such financing might
become difficult to maintain. Twenty-five
developing countries have short-term debt and
long-term debt repayment obligations to private
sector equal to 5 or more percent of their GDP
(figure 14). Should financing conditions tighten
and these debts cannot be refinanced, countries
could be forced to cut sharply either into reserves
or domestic demand in order to make ends meet.
9
Risks are particularly acute for countries like
Turkey that combine large current account
Box 6 Domestic bonds — an imperfect hedge against capital flow reversals?
Developing countries are increasingly turning to domestic bond markets for funding (see World Bank, 2011B).
While this reduces their exposure to currency risk, it does not necessarily make them less exposed to a reversal in
capital flows. More than 25 percent of the domestic bonds sold in Peru, Indonesia, Malaysia, South Africa and
Mexico (foreign holdings of local government bonds in Mexico have surged because of their inclusion in interna-
tional bond indexes, such as the WBGI — normally a relatively stable source of funding) were bought by foreign-
ers (Table B6.1). Should foreigners lose confidence in the local issue, or be forced by losses elsewhere in their
portfolio to sell these bonds – there could be significant adverse effects for the countries involved – including for
domestic bond yields, government financing costs, investment and currency stability. According to JP Morgan fig-
ures, EM bond funds received $44.8 billion of inflows in 2011, down from $80 billion in 2010, mostly due to sharp
decline in local-currency bonds–partly contrib-
uting to the depreciation of currencies described
earlier. Foreign selling has been particularly
sharp in Latin America, with Brazil posting
large outflows in the third quarter of 2011.
By the same token, firms that rely on foreign
investment in local stock markets may also be
exposed to a deterioration in foreign investor
sentiment or by an externally generated need to
deleverage – particularly in cases where local
markets are relatively illiquid. Indeed, emerging
market equities have declined by 8.5 percent
since recent peaks, much more than the 4.2 per-
cent observed in high-income equity markets.
Box table B6.1. Foreign bonds holdings as a percentage of out-
standing local government bonds
Figure 15 Countries exposed to external financing risks
Source: World Bank.
0
10
20
30
40
50
60
70
80
90
100
0 2 4 6 8 10
Short-term Debt /FX reserves 2011 (%)
CA Deficit-Net FDI flows ratio (2011 projections)
Peru
Jamaica
Lithuania
Kenya
Egypt
Sri Lanka
Moldova
Latvia
Romania
Georgia
Brazil
South Africa
Ukraine
Jordan
Turkey
Belarus
Chile
Montenegro
Global Economic Prospects January 2012 Main Text