USING BIOREACTORS TO CONTROL AIR POLLUTION docx
Bạn đang xem bản rút gọn của tài liệu. Xem và tải ngay bản đầy đủ của tài liệu tại đây (323.76 KB, 39 trang )
USING BIOREACTORS TO CONTROL
AIR POLLUTION
EPA-456/R-03-003
September 2003
USING BIOREACTORS TO CONTROL
AIR POLLUTION
Prepared by
The Clean Air Technology Center (CATC)
U.S. Environmental Protection Agency (E143-03)
Research Triangle Park, North Carolina 27711
U.S. Environmental Protection Agency
Office of Air Quality Planning and Standards
Information Transfer and Program Integration Division
Information Transfer Group (E143-03)
Research Triangle Park, North Carolina 27711
ii
DISCLAIMER
This report has been reviewed by the Information Transfer and Program Integration
Division of the Office of Air Quality Planning and Standards, U.S. Environmental Protection
Agency and approved for publication. Approval does not signify that the contents of this report
reflect the views and policies of the U.S. Environmental Protection Agency. Mention of trade
names or commercial products is not intended to constitute endorsement or recommendation for
use. Copies of this report are available from the National Technical Information Service,
U.S. Department of Commerce, 5285 Port Royal Road, Springfield, Virginia 22161, telephone
number (800) 553-6847.
iii
FOREWORD
The Clean Air Technology Center (CATC) serves as a resource on all areas of
emerging and existing air pollution prevention and control technologies, and provides public
access to data and information on their use, effectiveness and cost. In addition, the CATC will
provide technical support, including access to EPA’s knowledge base, to government agencies
and others, as resources allow, related to the technical and economic feasibility, operation and
maintenance of these technologies.
Public Access and Information Transfer
INTERNET / World Wide Web Home Page
/>Communications
CATC Info-Line: (919) 541-0800 (English)
CATC/CICA Info-Line: (919) 541-1800 (Spanish)
Toll-Free (800) 304-1115 (Spanish)
FAX: (919) 541-0242
E-Mail:
Data Resources
C RACT/BACT/LAER Clearinghouse (RBLC)
Query, view and download data you select on
- Source Specific Technology Applications
- Air Pollution Regulatory Requirements
C CATC PRODUCTS
download technical reports, cost information and software
Related Programs and Centers
C CICA - U.S Mexico Border Information Center on Air Pollution /
Centro de Información sobre Contaminación de Aire Para la Frontera
entre EE.UU. Y México
C SBAP - Small Business Assistance Program
C International Technology Transfer Center for Global Greenhouse Gasses
iv
ACKNOWLEDGMENTS
This technical bulletin was made possible through the diligent and persistent efforts of
Lyndon Cox and Dexter Russell, Senior Environmental Employees with the Clean Air
Technology Center (CATC). Lyndon and Dexter did an exceptional job identifying information
sources, gathering relative data and putting this bulletin together. The CATC also appreciates
the helpful and timely comments and cooperation of the following peer reviewers:
Charles Darvin
Air Pollution Control Division
National Risk Management Research Laboratory
Office of Research and Development
U.S. EPA
Mohamed Serageldin
Emission Standards Division
Office of Air Quality Planning and Standards
Office of Air and Radiation
U.S. EPA
In addition, the CATC thanks the individuals, companies and institutions who supplied
information on bioreaction technology used to prepare this Technical Bulletin. Contributors are
indicated in the REFERENCES section of this bulletin.
v
TABLE OF CONTENTS
TOPIC Page
DISCLAIMER ii
FOREWORD iii
ACKNOWLEDGMENTS iv
TABLE OF CONTENTS v
FIGURES vi
TABLES vii
INTRODUCTION 1
What is Bioreaction? 1
Why is Bioreaction Important? 1
OVERVIEW. 2
How do Bioreactors Work? 2
FACTORS AFFECTING PERFORMANCE:
VARIABLES AND LIMITATIONS 3
Temperature 3
Moisture 4
Care and Feeding 5
Acidity 5
Microbe Population 6
BIOREACTOR PROCESSES 7
Biofilters 8
Biotrickling Filter 12
Bioscrubber 15
Other Bioreactor Technologies 18
CONTROL OPTIONS AND COST COMPARISONS 19
Combustion Control Devices 20
Non-Combustion Control Devices 23
Cost Comparisons 23
REGULATORY ISSUES 24
vi
TABLE OF CONTENTS (continued)
CONCLUSIONS 25
REFERENCES 27
APPENDIX A: CONTROL DEVICE OPERATING COST ASSUMPTIONS 28
FIGURES
1. Basic Biofilter 2
2. Biofilter with Emissions Recycle 9
3. Biofilters in Series, Horizontally 9
4. In-Ground Biofilter 10
5. Photograph of four Biofilters being installed in Arlington, TX
At Central Regional Wastewater System Plant 10
6. Trickling Filter 13
7. Biotrickling Filter 14
8. Bioscrubber 17
9. Regenerative Thermal Oxidizer Operating Modes 21
10. Three-Phase Recuperative Thermal Oxidizer 22
11. Catalytic Oxidizer 22
vii
TABLE OF CONTENTS (continued)
Tables
1. Bioreactor Re-Acclimation Times After Periods of Non-Use 7
2. Existing Biofilter Design Characteristics Summary 11
3. Biofilter Cost per Unit Volume of Air Flow 12
4. General Characteristics of Biotrickling Filters 15
5. Design Characteristics for Existing Biotrickling Filters 16
6. Cost for Biotrickling Filter per Unit Volume of Air Flow 16
7. Bioscrubber Design Characteristics 18
8. Estimated Control Cost for Thermal and Catalytic Processes 24
9. Control Costs Using Bioreaction 25
viii
Page intentionally left blank
a
Traditional Control Devices include thermal and catalytic oxidation, carbon adsorption and absorption (scrubbers).
b
Bioreactors in northern states may need to heat emissions to obtain optimum conditions. The source of this heat may
generate combustion pollutants.
1
USING BIOREACTORS TO CONTROL
AIR POLLUTION
INTRODUCTION
Bioreactors use a natural process that is as old as life itself. For life to survive, it must
have a source of energy (food) and water (moisture). How these needs are used to remove
pollutants from contaminated air streams is the subject of this report.
What is Bioreaction?
In air pollution, bioreaction is simply the use of microbes to consume pollutants from a
contaminated air stream. Almost any substance, with the help of microbes, will decompose
(decay) given the proper environment. This is especially true for organic compounds. But
certain microbes also can consume inorganic compounds such as hydrogen sulfide and nitrogen
oxides.
Why is Bioreaction Important?
In a word, COST! The capital cost of a bioreaction installation is usually just a fraction
of the cost of a traditional control device installation.
a
Operating costs are usually considerably
less than the costs of traditional technology, too. Thermal and catalytic control units consume
large volumes of expensive fuel. Bioreactors only use small amounts of electrical power to drive
two or three small motors. Normally, bioreactors do not require full-time labor and the only
operating supplies needed are small quantities of macronutrients. Biofilters, the most common
type of bioreactor, usually use beds (media on which microbes live) made from naturally
occurring organic materials (yard cuttings, peat, bark, wood chips or compost) that are slowly
consumed by the biomass (i.e., microbes). These organic beds usually can supply most of the
macronutrients needed to sustain the biomass. The beds must be replaced every 2 to 5 years
(Ref. 1), depending on the choice of bed material.
Bioreaction is a "green" process, whereas the traditional approaches are not. Combusting
any fuel will generate oxides of nitrogen (NO
x
), particulate matter, sulfur dioxide (SO
2
), and
carbon monoxide (CO). Bioreactors usually do not generate these pollutants or any hazardous
pollutants
b
. Products of a bioreaction consuming hydrocarbons are water and carbon dioxide
(CO
2
).
Bioreactors do work, but microbes are finicky in what they will eat. Microbes need the
2
Contaminated
Air
Plenum
Fan
Bed Media
Water Drain to
Wastewater
Treatment
Decontaminated Air To Atmosphere
right pollutant concentration, temperature, humidity and pH. There are many opportunities to
make mistakes in design and operations of a bioreaction system. Anyone thinking about
bioreaction would be wise to discuss their situation with a manufacturer's representative or an
expert in the field. If a particular air pollution control situation qualifies, the cost benefits can be
substantial.
OVERVIEW
How do Bioreactors Work?
Microbes have inhabited the Earth since the time that the Earth cooled sufficiently to
allow any form of life to exist. Microbes have a simple life cycle; they are born, eat, grow,
reproduce and die. Their diet is based primarily on carbon-based compounds, water, oxygen (for
aerobic reactions) and macronutrients. Bioreactors use microbes to remove pollutants from
emissions by consuming the pollutants. The concept is simple, but the execution can be quite
complicated.
Bioreactors have been used for hundreds of years to treat sewage and other odoriferous,
water-borne waste. About sixty years ago, Europeans began using bioreactors to treat
contaminated air (odors), particularly emissions from sewage treatment plants and rendering
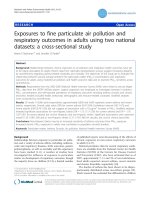
plants. The initial process used a device called a "biofilter." A biofilter is usually a rectangular
box that contains an enclosed plenum on the bottom, a support rack above the plenum, and
several feet of media (bed) on top of the support rack. See Figure 1.
Figure 1. Basic Biofilter
A large number of materials are used for bed media such as peat, composted yard waste,
bark, coarse soil, gravel or plastic shapes (Ref. 2). Sometimes oyster shells (for neutralizing acid
c
Compounds not soluble in water are not good candidates for this technology.
3
build-up) and fertilizer (for macronutrients) are mixed with bed media. The support rack is
perforated to allow air from the plenum to move into the bed media to contact microbes that live
in the bed. The perforations also permit excess, condensed moisture to drain out of the bed to
the plenum.
A fan is used to collect contaminated air from a building or process. If the air is too hot,
too cold, too dry, or too dirty (with suspended solids), it may be necessary to pre-treat the
contaminated air stream to obtain optimum conditions before introducing it into a bioreactor.
Contaminated air is duct to a plenum. As the emissions flow through the bed media, the
pollutants are absorbed by moisture on the bed media and come into contact with microbes.
c
Microbes reduce pollutant concentrations by consuming and metabolizing pollutants. During the
digestion process, enzymes in the microbes convert compounds into energy, CO
2
and water.
Material that is indigestible is left over and becomes residue.
This is a very simple and brief explanation on how a bioreactor functions. In real-life,
things get a bit complicated. Variables that affect the operation and efficiency of a bioreactor
include: temperature, pH, moisture, pollutant mix, pollutant concentration, macronutrient
feeding, residence time, compacted bed media, and gas channeling. These are crucial variables
for which optimum conditions must be determined, controlled and maintained. In the body of
this report, a complete explanation of these processes is given.
Is a bioreactor right for your situation? This is not an easy question to answer. The
purpose of this report is to provide tools that you can use to determine if a specific contaminated
air stream is a good candidate for bioreaction treatment. Why bother? Bioreactors are far less
expensive than traditional control technologies to install and operate and, in many cases,
bioreactors approach efficiencies achieved by traditional control technologies.
FACTORS AFFECTING PERFORMANCE:
VARIABLES AND LIMITATIONS
Because bioreactors use living cultures, they are affected by many variables in their
environment. Below are variables and limitations that affect the performance of all bioreactors,
regardless of process type.
Temperature
All variables discussed here are important. However, probably the most important
variable affecting bioreactor operations is temperature. A blast of hot air can totally kill a
biomass faster than any other accident. Most microbes can survive and flourish in a temperature
range of 60 to 105 /F (30 to 41/C) (Ref. 3). It is important to monitor bed temperature at least
daily, but every eight hours would be safer. A high temperature alarm on the emissions inlet is
4
also a good safety precaution.
When emissions from a process are too hot, operators often pass hot emissions through a
humidifier that cools gases down by evaporative cooling. This is the most economical method
available for cooling emissions from 200 to 300 /F (93 to 149 /C) to below 105 /F (41/C).
Besides the cooling effect, this process also increases the moisture content (humidifies emission
stream), a desirable side effect.
Although a blast of really hot air is the most lethal variable for microbes, cold air also
stops, but does not kill, microbes. Cold air can reduce microbe activity to the point that they
stop consuming pollutants and go into a state of suspended animation. Even freezing does not
kill microbes. After thawing, they can be re-acclimated in a relatively short period. For
optimum efficiency during winter months, it may be necessary to heat emissions using direct or
indirect methods. If heating is required, first look for a waste heat source such as excess steam,
boiler blowdown, or product cooling waste heat. As with cooling emissions, analyze your
source carefully to assure nothing is being added to the emission stream that will harm microbes
in the bioreactor, or will add to the overall pollution load. Additionally, some operators,
especially in northern states, insulate the bioreactor's exterior to reduce heat loss.
Moisture
The second most critical variable is bed moisture. Microbes need moisture to survive
and moisture creates the bio-film that removes (absorbs) pollutants from an air stream so that
they can be assimilated by microbes. Low moisture problems can be corrected by passing
emissions through a humidifier. Having emissions close to saturation (100 % relative humidity)
will solve most dry bed problems. Humidifiers need not be fancy, store-bought, stainless steel
process vessels. They can be made from an old FRP (fiber reinforced plastic) tank that is surplus,
or may be constructed from fiberglass panels with a lumber frame. The design should include
several rows of pipes near the top of the vessel with spray heads installed along their length, and
on/off valves on each pipe run to provide some control of humidity.
Biofilters are usually operated damp with no running or standing water. Low moisture,
for short periods, will not kill the microbes, but low moisture will greatly reduce efficiency.
Efficiency will be below optimum while microbes recover (re-acclimate) after a period of dry
bed conditions.
Flooding a reactor with water, on the other hand, will cause increased pressure drop
across the bed (adding additional load on the blower) and could cause a loss of efficiency
because of channeling that by-passes the bio-mass. Channeling could also cause the bed media
to collapse. For smooth operations, both conditions are to be avoided.
It is important to remember that a by-product of a bioreaction is water. If emissions are
saturated entering the process, there will be water condensing in the bed media. Always provide
space in the plenum for water to collect and a method to remove it from the plenum. The
d
Bioreactors that treat emissions that contain sulfur or sulfur compounds perform best when the pH is in the range 1 to
2 pH (Ref. 4).
5
optimum bed media moisture range is from 40 to 60 percent water (Ref. 3). One way to monitor
bed moisture content continuously is to mount the support rack on load cells with an indicator.
Care and Feeding
In addition to a comfortable temperature and a moist environment, microbes need a diet
of balanced nutrients to survive and propagate. Pollutants provide the main source of food and
energy, but microbes also require macronutrients to sustain life. Decay of an organic bed media
can provide most macronutrients. However, if a bed is deficient in certain nutrients, microbes
will cease to grow and could begin to die.
Nitrogen is an essential nutrient for microbial growth. Microbes use nitrogen to build
cell walls (these walls contain approximately 15 percent nitrogen) and nitrogen is a major
constituent of proteins and nucleic acids. Microbes are capable of utilizing all soluble forms of
nitrogen, but not all nitrogen is available for reuse. Some nitrogen products from digestion
processes are gases (nitrogen oxides and ammonia) and small quantities will exit the process
with emissions. However, most of the nitrogen containing vapors are re-absorbed into the liquid
and are consumed by microbes. Also, some nitrogen products form water-soluble compounds
and are leached out of the system with condensing water.
Other essential macronutrients include phosphorus, potassium, sulfur, magnesium,
calcium, sodium and iron. Nitrogen, phosphorus, potassium (the NPK code on fertilizer labels)
may be added by incorporating agricultural fertilizer into bed media. Lesser soluble
macronutrients such as magnesium, calcium, sodium and iron, may be purchased in small
quantities at feed and seed stores. The nutrient content of a bed should be checked periodically
by submitting samples to a soils lab for analysis.
Acidity
Most bioreactors perform best when the bed pH is near 7, or neutral.
d
Some pollutants
form acids when they decompose. Examples of these compounds are: hydrogen sulfide, organic
sulfur compounds, and halogens (chlorine, fluoride, bromine and iodine). Production of acids
over time will lower pH and will eventually destroy microbes. If a process emits pollutants that
produce acids, a plan must be developed to neutralize these acids.
There are several techniques available to neutralize beds. Some may be incorporated into
specification for the bed material. One of the simplest techniques is to mix oyster shells with bed
media. The shells will eventually dissolve and have to be replaced (Ref. 5). How long the shells
last depends on how much acid is produced. Another simple technique is to install a garden
soaking hoses in the packing media during construction (Ref. 4). Periodically, a dilute solution
of soda ash (sodium carbonate, Na
2
CO
3
) may be introduced into a bed when pH begins to
e
The authors define “re-acclimation” as the time it takes a system to achieve 98 % removal efficiency.
6
decline. Another technique is to spray dilute soda ash solution over the top of the bed.
However, this will probably be less effective than wetting the core of a bed with soaker hoses.
Microbe Population
Some equipment vendors can simulate a client's emission stream at their laboratory and
run bioreaction tests to determine which microbe strains perform best on a particular mix of
pollutants. They can then inoculate the bed media with those strains and start up with the "right"
microbes in place. Others allow nature to take her course by starting with a bed media that
contains a wide variety of living microbes such as compost, peat, or activated municipal sludge.
The strains that flourish on pollutants in an emission stream will eventually dominate the bed
environment. The natural method will take a little longer to acclimate to optimum efficiency,
but, because of the diversity of the strains of microbes, will be more adaptable in the long run.
Specific microbes that are developed in the lab are more susceptible to changes in the
environment than naturally generated microbes.
Periods of idle time will result in a change in the make-up of a population of microbes.
These changes will affect bioreactor performance and time will be required for the microbes
population to re-acclimate. Martin and Loehr (Ref.5) were concerned about this and conducted
experiments at the University of Texas (1996). They wanted to determine re-acclimation periods
after non-use periods of 1.67 days, 3.73 days and 2 weeks. These periods were intended to
coincide with plant closing for a 2 day weekend, 4 day holiday, and a two week plant shut down.
During periods of non-use, bioreactors were treated two ways: stagnant (no airflow through
them), and humidified (saturated air is passed through them). The time required to acclimate
microbes in the bioreactor initially and re-acclimate
e
(start-up) and after periods of non-use are
shown in Table 1.
Although results from this investigation are meager, they do provide enough information
to determine useful trends. For example, the time to re-acclimate during toluene testing more
than doubles between 1.67 days and 3.73 days non-use test runs (0.46 day vs. 1.0 day). The time
needed to re-acclimate from a two-week (14-day) non-use period is four and half times longer
than that to re-acclimate from 3.73 days non-use test (1.80 days vs. 0.39 days). Even though it
takes longer to re-acclimate from a 2 weeks non-use period, that time is still shorter than the
original acclimation time (1.80 days vs. 4 days).
Data on effects of humidity are even more meager. Only two direct examples of the
7
Experiment Test 1
(days)
Test 2
(days)
Test 3
(days)
Test 4
(days)
Test 5
(days)
Non-Use Period
a
Initial
Start-up
1.67 3.73 3.73 14.0
Humidification
b
No No No Yes Yes
Toluene
c
4.00 0.46 1.00 0.39 1.80
Benzene
d
7.25 0.17 0.21 0.21 2.75
a
The number of days bioreactor was out of service
b
“Yes” indicated humidification system was running during non-use period
c
Re-acclimation results when only toluene is sent to the bioreactor, days.
d
Re-acclimation results when only benzene is sent to bioreactor, days
Table 1. Bioreactor Re-Acclimation Times After Periods of Non-Use (Ref.4)
effects of humidity are given: 3.73-day non-use period tested with and without humidification
using toluene and benzene. In the humidified idle time, the bed re-acclimated to toluene in 0.39
days. In the test without humidification, it took 1 day (61 percent more time). There was no
difference in re-acclimate periods during benzene trials with and without humidity. Both took
0.21 days.
How does this research compare with other re-acclimation investigations? In the authors'
own words, "Thus, other research has found acclimation periods both shorter and longer than
those found in this research. It is difficult to make comparisons among the acclimation periods,
as the different studies involved several different chemicals, [bed packing] media types, and
operating conditions." (Ref.4) In other words, a pilot plant will probably be a necessity to
determine acclimation and re-acclimation periods and other operating parameters for each
emission stream and bed media combination.
BIOREACTOR PROCESSES
From the basic biofilter design, some new processes have evolved to become
environmentally and commercially viable. These new processes address situations not
adequately dealt with in the basic biofilter design such as the large quantity of space required,
acidic environments (pH control), pollutants requiring longer assimilation times, and nutrient
feeding.
f
Destruction/Removal Efficiencies of pollutants
8
Biofilters
For a brief discussion of the basic design and operation of biofilters see, "Overview".
Biofilters are ideal for treating emission that have low concentrations of contaminates and high
gas volume, a situation that vexes traditional treatment methods. Other advantages and
disadvantages are shown below.
Biofilter Advantages:
• Installation costs are low. Most biofilters are constructed from common materials
locally available such as lumber, fiberglass, and plastic pipe. They can be
assembled using carpenters, plumbers, and earthmovers.
• Depending on the amount of pretreatment the emissions require, operating costs
are usually low. These costs consist of electricity to operate the primary blower
and the humidification pump, part-time labor to check on the process, and small
quantities of macronutrients.
• Biofilters have high DREs
f
for certain compounds such as aldehydes, organic
acids, nitrous oxide, sulfur dioxide, and hydrogen sulfide.
Biofilter Disadvantages:
• Large land requirement for traditional design.
• No continuous internal liquid flow in which to adjust bed pH or to add nutrients.
• Traditional design does not have a covered top, making it difficult to obtain
representative samples of exhaust emission and to determine DREs.
• Natural bed media used in biofilters must be replaced every 2 to 5 years. Bed
replacement can take 2 to 6 weeks, depending on bed size.
Over time, some modifications have been developed to overcome some of the specific
deficiencies in the traditional biofilter design. To increase contact time with microbes, some
facilities recycle a portion of the exhaust back through the bioreactor. This is done by adding a
cover and vent to the biofilter. A slipstream is taken from the vent and is recycled back to the
intake of the primary blower. See Figure 2. Also, if land is available, biofilters modules may be
added horizontally, in series. This configuration is shown in Figure 3.
9
Plenum
Contaminated
Air
Bed Media
Water Drain to
Wastewater
Treatment
Vent
Cover
Emissions Recycle
Primary
Blower
Biofilter 1 Biofilter 3Biofilter 1 Biofilter 2
Figure 2. Biofilter with Emissions Recycle.
Figure 3. Biofilters in Series, Horizontally
To reduce land requirement, some operators have stacked biofilter modules vertically.
As mentioned in Factors Affecting Performance, above, some operators have installed soaking
hoses in the bed media to control pH and to add nutrients. Some have added sealed top covers to
keep rain out and heat in. The cover also provides a vent in which to obtain a representative
sample of the exhaust to calculate a more accurate DRE.
One of the earliest modifications was to install the biofilter in the ground, see Figures 4
and 5. This may be done by: digging a hole in the ground the size of the biofilter; placing a
lining of coarse gravel several inches thick on the bottom; installing an emissions distribution
piping system on top of the gravel; covering the piping system with additional few inches gravel;
and covering the gravel with several feet of packing media.
Biofilter Design Characteristics: Allen Boyette (Ref. 6) did research and wrote a paper
on existing biofilters installations presenting design characteristics and cost information a few
g
The paper was not dated, but it appears to have been written around 2000.
10
Emissions
EmissionsEmissions
Packing Media
Soil
Gravel
Blower
Distribution Pipe
Figure 4 In-Ground Biofilter
Figure 5. Photograph of four Biofilters being installed in Arlington, TX
At Central Regional Wastewater System Plant.
years ago.
g
The information, unfortunately, is for biofilters engaged solely in odor control.
However, it does provide cost information and limited information on Total Reduced Sulfur
(TRS) compounds and one test on VOC. See Table 2. From the information in Table 2, capital
costs for bioreactors per unit volume of emissions (CFM) were calculated, see Table 3.
11
Facility
a
Odor
Source
Flow
Rate
CFM
Filter
Loading
CFM/ft
2
Area
feet
2
Depth
feet
Volume
feet
3
Residence
Time, Sec.
Media
Blend
Removal
Eff, %
Cost
b
$ K
CMCMUA, NJ Compost 2,400 4 600 4 2,400 60 CYW
c
, WC
d
NT
e
$49.8
CCCSD, CA WWTP 3,500 5 700 4 2,800 48 CYW
c
, WC
d
NT
e
$129.7
DMUA, IA Compost 210,000 5 42,000 4 168,000 48 CYW
c
, WC
d
86 ordor $495.5
EHMSW, NY Compost 50,000 5 10,000 3 30,000 36 CYW
c
, WC
d
NT
e
$135.4
EWWWTP, NY WWPT 15,000 2.67 5,620 4 22,480 90 Unknown NT
e
NA
f
HRRSA, VA Compost 3,150 4 790 4 3,160 48 Bio-Solids, WC NT
e
$58.0
HWQD, MA Compost 15,000 3.5 to 5 3,600 3 10,800 40-60 CYW
c
, WC
d
94 Odor
99 TRS
NA
f
RWSA, VA Sewage 2,825 5 565 4 2,260 48 CYW
c
, WC
d
76 Odor $14,3
SBC, TN Compost 80,000 4.5 19,800 2.5 to 3 54,450 30-45 NA
f
91 Odor
93 VOC
NA
f
UNISYN, HI Food
Waste
2,500 4 625 3.5 2,188 42 CYW
c
, WC
d
82 Odor
99 TRS
$11.4
WLSSD, MN WWPT 50,000 4.2 11,800 4 47,200 57 CYW
c
, WC
d
NA
f
$387.0
a
CMCMUS = Cape May County Municipal Utilities Authority, Cape May, NJ
b
Total cost of design, construction and start-up. Does not include duct work.
CCCSD = Central Contra Costa Sanitary District, Martinez, CA
c
Composted yard waste
DMUA = Davenport Municipal Utilities Authority, Davenport, IA
d
Wood chips
EHMSW = East Hampton Municipal Solid Waste, East Hampton, NY
e
Not tested
EWWTP = Everett Waste Water Treatment Plant, Everett, WA,
f
Information Not Available
HRRSA = Harrisburg/Rockingham Regional Sewer Authority, Mt. Crawford, VA
HWQD = Hoosac Water Quality District, Hoosac, MA
RWSA = Rivanna Water and Sewer Authority, Charlottesville, VA
SBC = Sevierville Bedminister Corp., Sevierville, TN (MSW)
UNISYN = UNISYN Corporation, Wiamanilo, HI (a firm treats food waste)
WLSSD = Western Lake Superior Sanitary District, Duluth, MN
Table 2. Existing Biofilter Design Characteristics Summary (Ref. 6)
12
Facility Location Air Flow
CFM
Cost
a
$
Cost per Air Flow
Rate, $/CFM
Wiamanillo, HI 2,500 $11,400 $4.56
Charlottesville, VA 2,825 $14,300 $5.06
Cape May, NJ 2,400 $49,800 $20.75
Mt. Crawford, VA 3,150 $58,000 $18.41
Martinez, CA 3,500 $129,700 $37.06
E. Hampton, NY 50,000 $135,400 $2.71
Duluth, MN 50,000 $387,000 $7.74
Davenport, IA 210,000 $494,500 $2.35
a
Cost does not include installation of duct work. It does include engineering, construction and start-up cost.
Table 3. Biofilter Cost per Unit Volume of Air Flow
Resulting costs figures are all over the map, but cost per unit volume, appears to decrease
as the airflow increases, as expected. Cost for the three biofilters with capacities of 50,000 CFM
and over, average just $4.24 per cubic foot per minute. This is probably due to economies of
scale. Mr. Boyette does not include ductwork installation cost in his cost figures. In his words,
"The odorous gas collection system for each case is not included in the capital cost as collection
systems vary from simple duct systems to elaborate ducting and controls. The inclusion of
collection system can significantly increase the cost of installing an odor control system and
would be required with any [other] odor control technology selected."(Ref.2)
As stated earlier in this section, there are many variations to biofilter design that range
from very elaborate equipment and controls to a simple hole in the ground. Other factors
effecting costs are labor cost in the area and the geo-political situation.
BIOTRICKLING FILTER
As mentioned in the Biofilter section, the basic design of a biofilter makes it difficult to
control pH in the packing. Acid is formed with the biological destruction of many pollutants and
acid build-up creates a serious problem for operators. Many of the early biofilters were used to
deodorize foul emissions from wastewater (sewage) treatment facilities. These emissions often
contain sulfur compounds that produce acid upon degradation. Because of the detrimental effect
of acid on microbes, operators began experimenting with processes to control pH that they had
used and understood. One of the processes they experimented with was the trickling filter.
13
Rotating Spray Arm
Recycled
Effluent
Packed
Bed
Sludge
Discharge
Recirculation
Pump
Un-treated
Effluent
Treated
Effluent
Trickling filters have been used for many years and are effective treatment for wastewater.
What is a Biotrickling filter? It is probably better to answer the question, "What is a
trickling filter?" first, and then describe the modifications that were made to create the
biotrickling filter. A trickling filter is a wastewater treatment process that is usually a round,
vertical tank that contains a support rack and is filled with aggregate, ceramic or plastic media to
a height of 3 to 15 feet. In the middle of the tank is a vertical pipe that has a rotary connection
on the top end. A spray arm is attached to the rotary connection and this has spray nozzles
installed along its length. The spray nozzles are angled slightly off-center to provide force
necessary to rotate the spraying arm around the top of the trickling filter. A recirculating pump
is used to pump liquid from the reservoir in the bottom to the spray nozzles. Liquid level in the
sump is maintained with an automatic effluent make-up system. A biofilm forms on the packing
surface. This is a biologically active mass that removes the pollutants from the effluent and the
microbes decompose them. See Figure 6.
Figure 6. Trickling Filter
The biotrickling filter is very similar to the trickling filter. However, the pollutants are
contained in an air phase (emissions), and the pollutants must be dissolved into the liquid phase
to be available to the microbes. As the air phase passes through the packing, the pollutants are
absorbed from the air into the liquid phase to achieve maximum contact with the biomass. This
is the difference from the trickling filter because pollutants that enter the system are already in
the liquid phase (effluent) in the trickling filter. Water is added to the reservoir to make-up for
water that has evaporated. Accumulated bio-sludge is periodically removed from the reservoir
14
Rotating Spray Head
Recycled
Effluent
Packed
Bed
Sludge
Discharge
Liquid
Level
Recirculation
Pump
Emissions
In
Emissions
Out
and disposed. See Figure 7.
Figure 7. Biotrickling Filter
Emissions may be routed through the biotrickling filter co-current or counter-current to
the effluent flow. Because of the continuous flow of a liquid phase, it is an easy matter to
automatically neutralize acid build-up.
Use of ceramic or plastic packing rings achieve a void space of up to 95 percent, which
greatly reduces pressure drop across the packing. This means that 15 feet of plastic packing in a
biotrickling filter will have about the same pressure drop as 3 feet of natural packing in a
biofilter. In other words, the 15 feet of plastic packing is equivalent to a 5 stage biofilter.
Typical characteristics of biofilters found in the United States are shown in Table 4 (Ref. 7) .
Design characteristics of four existing biotrickling filters are shown in Table 5 (Ref. 6). The cost
of three of theses biotrickling filters per unit volume of air flow is presented in Table 6.
15
Height of Bed Packing, ft 3 to 6
Packing Cross-Sectional Area, ft
2
10 to 32,000
Emissions Flow Rate, CFM 600 to 600,000
Packing Void Volume, %
a
90 to 95
Empty Bed Gas Retention Time, Seconds
b
2 to 60
Pressure Drop Across Bed, inches H
2
O 0.36 to 2
pH of Recycled Liquid Phase
When Treating VOC
When Treating H
2
S
~ 7 pH
1 to 2 pH
VOC Concentrations, grains ft
3
4.57 E-3 to 45.7
Removal Efficiency, % 60 to 99.9
a
Using packing rings, random dump, or structured packing
b
Empty bed gas retention (EBGR) time is defined as the packed bed volume/emission flow rate
Table 4. General Characteristics of Biotrickling Filters (Ref. 7)
Cost results in Table 6 require an explanation. The Hyperion unit was designed, built
and operated by chemical engineers from the University of California at Riverside. It was
intended to be used as a multi-use research device and was constructed on a moveable trailer.
Because of this, much more flexibility and instrumentation than normally needed was built into
this application. As a result, the cost per volumetric flow rate for this installation was not used in
this comparison.
Costs per flow rates for the remaining two applications are not very far apart and average
$25.10/CFM. This is almost six times as high as $4.25/CFM, the average cost of the three
largest biofilters. This is to be expected, as trickling filter equipment is closer in design to
industrial process equipment than traditional biofilters.
BIOSCRUBBER
Just as the biotrickling filter is an enhancement of the biofilter, the bioscrubber is an
enhancement to the biotrickling filter. The bioscrubber attempts to solve two problems with the
biotrickling filter: 1. improve the absorption of pollutants into the liquid, and 2. lengthen the time
the microbes have to consume the pollutants. These are accomplished in two ways: the tower
packing is flooded with a liquid phase and the discharge effluent from the bioscrubber is
collected in a storage tank (sump) before being recycled back to the bioscrubber. See Figure 8.
16
Facility
a
Operation Packing Filter
Dimension
Flow
CFM
EBRT
Seconds
ªP
in H2O
Bed Temp
/ F
Cost
$ K
Op. Cost
$/MMCFM
Eff.
%
Diameter Height
Hyperion
WWTP
Stacked 5 ft 11 ft 380 21 0.32 94 $175 $0.23 98
Grupo Resins
Stacked
12 ft 38 ft 26 K 10 1.0 92 $525 $0.68 85-99
Reemtsma Tobacco Foam NA NA 100 K 11 6.0 104 $3,000 $0.23 90
US Navy Fuel Vents Random 10 ft 10 ft 1,750 37 5.0 80 NA $0.72
a
Hypeiona = Hyperion Wastewater Treatment Plant, Los Angeles, CA
Grupo = Grupo Cydsa, Monterey, Mexico (Cellophane)
Reemtsma = Berlin, Germany (Cigarette Production)
US Navy, North Island, San Diego, CA
Table 5. Design Characteristics for Existing Biotrickling Filters (Ref. 7)
Facility Flow Rate, CFM Cost, $ $/CFM
a
Hyperion WWTP 380 $175 K $460.00
Grupo 26,000 $525 K $20.20
Reentsma 100,000 $ 3,000 K $30.00
a
NOTE: Cost per unit volume of air flow ($/CFM) is calculated from data in Table 5.
Table 6. Cost for Biotrickling Filter per Unit Volume of Air Flow