Air pollution exposure estimation using dispersion modelling and continuous monitoring data in a prospective birth cohort study in the Netherlands potx
Bạn đang xem bản rút gọn của tài liệu. Xem và tải ngay bản đầy đủ của tài liệu tại đây (629.2 KB, 11 trang )
METH O D O LOG Y Open Access
Air pollution exposure estimation using
dispersion modelling and continuous monitoring
data in a prospective birth cohort study in the
Netherlands
Edith H Van den Hooven
1,2,3*
, Frank H Pierik
2
, Sjoerd W Van Ratingen
2
, Peter YJ Zandveld
2
, Ernst W Meijer
2
,
Albert Hofman
3
, Henk ME Miedema
2
, Vincent WV Jaddoe
1,3,4
and Yvonne De Kluizenaar
2
Abstract
Previous studies suggest that pregnant women and children are particularly vulnerable to the adverse effects of air
pollution. A prospective cohort study in pregnant women and their children enables identification of the specific
effects and critical periods. This paper describes the design of air pollution exposure assessment for participants of
the Generation R Study, a population-based prospective cohort study from early pregnancy onwards in 9778
women in the Netherlands. Individual exposures to PM
10
and NO
2
levels at the home address were estimated for
mothers and children, using a combination of advanced dispersion modelling and continuous monitoring data,
taking into account the spatial and temporal variation in air pollution concentrations. Full residential history was
considered. We observed substantial spatial and temporal variation in air pollution exposure levels. The Generation
R Study provides unique possibilities to examine effects of short- and long-term air pollution exposure on various
maternal and childhood outcomes and to identify potential critical windows of exposure.
Keywords: Air pollution, Dispersion modelling, Particulate matter, Nitrogen dioxide, Cohort study, Pregnant
women, Prenatal development, Child health
Background
Air pollution exposure has been associated with several
adverse health effects, such as cardiovascular disease,
respiratory disease, and total mortality [1-4]. Certain sub-
groups of the population, including pregnant women and
their unborn children, have been suggested to be more
susceptible to the adver se effects of air pollution [5,6].
Literature on the specific effects of air pollution exposure
in pregnant women on outcomes such as inflammation
markers, placental function, and blood pressure, is scarce.
In contrast, research on the impact of air pollution expo-
sure on birth outcomes has increased in the last decade,
which has led to a number of reviews summarizing the
available evidence [7,8]. Most routinely measured air pol-
lutants (e.g., PM
10
,NO
2
,CO,O
3
,SO
2
) have been linked
to increased risks of adverse birth outcomes [6]. How-
ever, results are not consistent between studies, with
respect to the specific air pollutants, the relevant expo-
sure periods, and the specific birth outcomes [7,8].
Recommendations for future resea rch are to improve
exposure assessment by incorporating detailed informa-
tion on spatial and temporal patterns in air pollution
concentrations and to consider a greater variety of repro-
ductive outcomes [9]. Furthermore, it is of interest to
include noise exposure data in studies on traffic-related
air pollution exposure and health, since traffic is a major
shared source for both air pollution and noise [10-13].
Dispersion models are applied to estimate air pollution
concentrations in a study area, using data on emissions,
meteorological conditions, and topography [14]. Despite
the relatively costly data input, dispersion modelling is a
promising method to obtain air pollution estimates for
epidemiological studies, as it allows consideration of both
spatial and temporal variation without the need for
* Correspondence:
1
The Generation R Study Group, Erasmus Medical Center, Rotterdam, The
Netherlands
Full list of author information is available at the end of the article
Van den Hooven et al. Environmental Health 2012, 11:9
/>© 2012 van den Hooven et al; licensee BioMed Central Ltd. This is an Open Access article distributed under the terms of the Creative
Commons Attribution License ( which permits unrestricted use, distributio n, and
reproduction in any medium, provided the original work is properly cited.
extensive air pollution monitoring. Dispersion models are
increasingly used in combination with geographic infor-
mation system (GIS) based methods. This introduces the
possibility for spatial linkage of geographically referenced
data, such as residential address es, road networks, pollu-
tion sources, and street characteristics, which further
enhances the quality of the modelling approach [14,15].
In this paper we describe the design of studies focused
on the effects of air pollution exposure on various health
outcomes in mothers and children in the Generation R
Study. We describe the assessment of individual expo-
sures to particulate matter (PM
10
) and nitrogen dioxide
(NO
2
) at the home address, using a combination of con-
tinuous monitoring data and GIS based dispersion mod-
elling techniques, taking into account both the spatial
and temporal variation in air pollutio n. In addition, we
present the distribution of exposure levels for various
relevant exposure periods in the prenatal and postnatal
phase, and we present exposure levels according to
maternal and infant characteristics.
Methods
Study design
The Generation R Study is a population-based prospec-
tive cohort study from pregnancy onwards, which was
designed to identify early environmental and genetic
causes of normal and abnormal growth, development,
and health during fetal life, childhood and adulthood. It
has been described previously in detail [16,17]. I n brief,
the cohort includes mothers and children of different
ethnicities living in the city of Rotterdam, the Nether-
lands. Enrolment was aimed in early pregnancy (gesta-
tional age < 18 weeks), but was allowed until the birth of
the child. Out of the total number of eligible children in
the study area, 61 percent participated in t he study at
birth. In total, 9778 mothers with a deliver y date between
April 2 002 and Ja nuary 2006 were enrolled in the study.
Extensive assessments have been carried out in mothers
and fathers and are currently performed in their children,
who form a prenatally recruited birth cohor t that will be
followed until young adulthood. Data collection included
questionnaires, detailed physical and ultrasound exami-
nations, behavioural observations, and biological samples.
Assessments in pregnancy were performed in each trime-
ster. Assessments in the children in the preschool period
(birth to age of 4 years) included a home-visit, question-
naires, and visits to the routine child health centres.
From the age of 5 years onward, regular detailed hands
on assessments are performed in all children and their
parents in a research center. T he study protocol was
approved by the Medical Ethical Committee of Erasmus
Medical Center, Rotterdam. Written informed consent
was obtained from all participants.
Air pollution exposure assessment
Individual exposures to PM
10
and NO
2
levels during
pregnancy were assessed at the home address, using
advanced spatiotemporal dispersion modelling techni-
ques in combination with hourly air pollution measure-
ments at three continuous monitoring sites. The
exposure assessment procedure has been described pre-
viously [18,19]. Below, we give a brief summary of the
procedure, including some revised information that
better describes the individual steps.
Spatial pattern
Annual average concentrations of PM
10
and NO
2
for the
years 2001-2008 were assessed for all addresses in the
study area, using GIS and the three Dutch national stan-
dard methods for air quality modelling (considering
intra-urban road traffic, traffic on highways, and indus-
trial and other point sources) [20]. Subsequently, in order
to obtain spatiotemporal patterns, spatially resolved
annual concentrations were calculate d for eight different
wind conditions, resulting in an averaged spatially
resolved concentration pattern for each wind class.
Various input data was taken into account in the calcula-
tions as described earlier [18,19], including annual data
on traffic i ntensities and annual emissions from traffic,
shipping, industry, and households. The traffic intensity
data was supplied by the DCMR Environmental Protec-
tion Agency Rijnmond (DCMR), and emission sources
and emission data were obtained from the National Insti-
tute for Public Health and the Environment (RIVM) and
the DCMR. Hourly meteorological data was obtained
from observations at Rotterdam The Hague Airport,
performed by the Royal Netherlands Meteorological
Institute (KNMI).
Temporal pattern
To account for temporal variation due to different wind
conditions, for each hour we derived the corresponding
spatial distribution for the prevailing wind direction and
wind speed at that specific hour, by means of interpola-
tion between the eight characteristic spatial distributi ons.
Subsequently, the spatial distributions that corresponded
to the hourly wind conditions were adjusted for fixed
temporal patterns of source activities. In this way, we
accounted for temporal fluctuations in the contribution
of air pollution sources during the month, week (e.g.,
working days and weekend days), and day (e.g., morning
and evening rush hour). The adjustment for temporal
patterns was performed for t raffic and for household
emissions. Traffic is the source with the strongest fluc-
tuations in emissions within 24 hours. This 24 h-pattern
is fairly stable for working days and weekend days.
Hence, the contribution of traffic was scaled using an
average hourly traffic intensity pattern (based on traffic
counts), thereby deriving h ourly intensities. We a lso
Van den Hooven et al. Environmental Health 2012, 11:9
/>Page 2 of 11
considered the time dependence of household emissions,
by applying a 24 h-pattern, and we applied a function for
outdoor temperature dependence to account for seasonal
fluctuations. These fu nctions were derived from energy
use statistics. In this way, hourly household emissions
were estimated from annual household emissions.
Emissions from industrial sources do not contribute
significantly to small-scale variations in air pollution con-
centrations. Emissions from shipping are quite stable
over time and also display relatively small temporal fluc-
tuations. Therefore, these emissions w ere not adjusted
for fixed temporal patterns. Nevertheless, even if some
small-scale variations had occurred as a result of these
emissions, the difference would have been corrected for
in the next step (adjustment for hourly background
concentrations).
Adjustment for background concentrations
The modelled hourly concentrations were adjusted for
background concentrations (see also [18,19]), in order to
consider the temporal fluctuations in background con-
centrations. This was done using continuous hourly
monitoring data from three monito ring stations in the
study area. The measured air pollution concentrations at
these stations are considered as the sum of the back-
ground concentration and the contribution from local
emission sources. We model led the contribution of local
emission sources to the PM
10
and NO
2
concentrations at
the three monitoring stations. Subsequently, we sub-
tracted the hourly modelled contributions from the
hourly measured concentrations at the stations, thereby
deriving an hourly estimate for the background concen-
trations. The hourly estimates for the background con-
centrations at the three stations were averaged, which
yielded an average hourly background concentration for
the study area. In the adjustment procedure, this average
hourly background concentra tion was added to the mod-
elled hourly contributions atthehomeaddresses,in
order to take into account the background concentration.
Continuous air pollution monitoring data was pro-
vided by DCMR. Missing value s for PM
10
concentra-
tions at the three monitoring stations were imputed, as
described earlier [18,19].
Modelling performance
As described above, the first step in our modelling proce-
dure involved the assessment of annual average PM
10
and
NO
2
concentrations, using a combination of the thr ee
Dutch standard methods. The performance of this model-
ling procedure based on (a combination of) the three stan-
dard methods has been evaluated by two previous studies
in the same study area. These studies reported a good
agreement between predicted annual average PM
10
and NO
2
concentrations and concentrations measured at
monitoring stations [21,22]. Our dispersion modelling
approach, resulting in hourly average concentrations, is a
refinement of this former modelling procedure. An addi-
tional validation study of this refined modelling procedure
was not feasible within the scope of this project.
Exposure assignment
Derived from the hourly concentrations of PM
10
and NO
2
,
we constructed a database containing daily averages (24 h)
for every address, for the years 2001-2008. Allowing for
residential mobility, air pollution exposure estimates were
linked to the different home addresses of the participants
throughout the study period. T his yields a database with
individual exposures, which can be used to derive average
exposure estimates for any period between 2001 and 2008,
depending on the specific research question. For the pre-
sent paper, we de scribe air pollution exposure estimates
for a number of pregnancy and childhood periods, to illus-
trate the distribution of exposure levels in participants in
these potential sensitive periods. More specifically, we
derived exposures for the following periods: first trimester,
second trimester, third trimester, total pregnancy, birth
until 6 months postnatally, and 7 until 12 months postna-
tally. Exposures were only calculated for periods with less
than 25% of the daily averages missing. For the other peri-
ods, air pollution exposures were set to missing.
Statistical analyses
Descriptive analyses were performed for all air pollution
exposure averages, including the evaluation of the Pearson
correlation coefficients between the different exposure
aver ages. In addition, we examined mean maternal PM
10
and NO
2
exposure levels during total pregnancy according
to maternal characte ristics and infant chara cteristics.
Information on these characteristics was obtained from
questionnaires in pregnancy and from medical records, as
described elsewhere [16,18]. M aternal noise exposure
(based on the home address at time of delivery) was
assessed in accordance with requirements of the EU Envir-
onmental Noise Directive, which has been described pre-
viously [10,16,18,23]. Information on average
neigbourhood income was obtained from Statistics Neth-
erlands as neighbourhoods’ average disposable income per
inco me receiver in the year 2004, and classified into: low
(< 1400 euro/month), moderate (1400-2200 euro/month),
and high (> 2200 euro/month). Season of conception and
season of birth were categorized as winter (December to
February), spring (March to May), summer (June to
August), and fall (September to November). For all mater-
nal and infant characteristics, we performed a one-way
ANOVA followed by Bonferroni’s post hoc comparison
tests to examine the differences in mean air pollution
exposure levels compared with the reference group. All
statistical analyses were performed using PASW version
17.0 for Windows (PASW Inc., Chicago, IL).
Van den Hooven et al. Environmental Health 2012, 11:9
/>Page 3 of 11
Results
Air pollution exposure in the study cohort
Of the 9778 women, exposure estimates could not be cal-
culated for 149 mothers because they had an abortion
(n = 29) or intrauterine death (n = 75), or were lost-to-
follow up (n = 45), and consequently no information was
available on the date of conception and delivery. For the
remaining 9629 women (and their 9748 children), 12188
addresses were available for the time period presented
here (conception until the first year postnatally). Of all
women, 74% did not move in this period, 25% changed
residence once, and less than 1% moved two or three
times. Of the 12188 addresses, 10518 (86%) could be
linked to the air pollution exposure database, and 1938
addresses could not be linked. This was either due to
missing address information, incompatible street number
suffices, or to addresses situated outside of the study area
of the Generation R Study [16]. As a result, air po llution
exposure estimates for the present paper were available
for 8810 mothers and 8921 children.
Table 1 presents the distribution of maternal PM
10
and NO
2
levels for a number of illustrative prenatal and
postnatal periods. The number of participants with
available exposure data varied for the specific periods.
On average, PM
10
and N O
2
exposure levels during first
trimester were higher than during second and third tri-
mester, and postnatal exposure levels were lower than
prenatal exposure levels. This can be explained by the
decreasing trend in air pollution levels throughout the
study period. Mean air pollution exposure levels during
pregnancy were 30.2 μg/m
3
(range 23.1 to 39.9) for
PM
10
and 39.7 μg/m
3
(range 25.3 to 56.9) for NO
2
(Table1).Onaverage,theselevelsarebelowthe
European Union annual limit values (40 μg/m
3
for both
PM
10
and N O
2
)thataredefinedforprotectionof
human health [24], but a substantial proportion of the
women was exposed to levels higher than these limit
values. Moreover, it has been acknowledged that signifi-
cant health effects may occur even below the current
limit values [25].
Epidemiological studies often evaluate associations for
air pollution exposure levels in different periods, in order
to examine the relevant exposure periods, which is infor-
mative only if the correlations among these exposure
levels are not too high. Table 2 shows that Pearson corre-
lation coeffi cients between the different air pollution
exposure averages for the present paper varied between
0.02 and 0.83. Correlations among exposu re averag es for
the first, second, and third trimester were moderate
(PM
10
: r = 0.31 to 0.48, NO
2
:r=0.17to0.48).Correla-
tions between exposure averages for the separate trime-
sters with exposure averages for the total pregnancy
period were higher (PM
10
: r = 0.73 to 0.83, NO2: r = 0.43
to 0.51). Correlations between prenatal and postnatal
exposure averages were low for PM
10
(r = 0.13 to 0.29),
andsomewhathigherforNO
2
(r = 0.22 to 0.78). PM
10
and NO
2
exposures averages for the same period w ere
moderately correlated (r = 0.58 to 0.66).
There was substantial spatial and temporal variation in
air pollution exposure levels. We have previously published
Table 1 Distribution of maternal PM
10
and NO
2
exposure levels for different prenatal and postnatal periods
N Minimum 25th percentile Mean Median 75th percentile Maximum
PM
10
exposure (μg/m
3
)
Prenatal
First trimester 7894 22.0 27.7 30.6 30.5 33.4 43.1
Second trimester 8311 21.3 26.2 30.1 29.5 33.3 45.6
Third trimester 8438 22.0 26.6 29.8 29.8 32.0 43.5
Total pregnancy 7877 23.1 27.7 30.2 29.9 32.8 39.9
Postnatal
Month 0-6 8381 22.7 27.3 29.5 29.3 31.4 39.9
Month 7-12 8082 22.8 27.0 28.8 28.7 30.5 39.3
NO
2
exposure (μg/m
3
)
Prenatal
First trimester 7893 21.4 36.9 40.2 40.6 43.5 58.5
Second trimester 8310 20.2 35.2 39.6 40.5 43.9 59.7
Third trimester 8434 21.3 35.4 39.3 39.9 43.2 58.8
Total pregnancy 7889 25.3 37.0 39.7 39.5 42.2 56.9
Postnatal
Month 0-6 8389 24.2 36.3 39.4 39.5 42.5 59.3
Month 7-12 8082 24.1 35.5 38.6 38.6 41.6 58.0
Air pollution exposur e was estimated for different prenatal and postnatal periods: first trimester (0-18 weeks), second trimester (18-25 weeks), third trimester (25
weeks-delivery), total pregnancy, month 0-6 postnatally, and month 7-12 postnatally
Van den Hooven et al. Environmental Health 2012, 11:9
/>Page 4 of 11
Table 2 Correlation coefficients between period-specific PM
10
and NO
2
exposure averages
PM
10
NO
2
First
trimester
Second
trimester
Third
trimester
Total
pregnancy
Month0-6
postnatally
Month 7-12
postnatally
First
trimester
Second
trimester
Third
trimester
Total
pregna ncy
Month 0-6
postnatally
Month 7-12
postnatally
PM
10
First trimester 1
Second
trimester
0.48 1
Third trimester 0.31 0.46 1
Total
pregnancy
0.83 0.74 0.73 1
Month 0-6
postnatally
0.19 0.13 0.34 0.29 1
Month 7-12
postnatally
0.11 0.02 0.01 0.06 0.21 1
NO
2
First trimester 0.59 0.36 0.19 0.51 0.28 0.01 1
Second
trimester
0.26 0.58 0.41 0.48 0.15 0.24 0.45 1
Third trimester 0.17 0.24 0.63 0.43 0.25 0.36 0.17 0.48 1
Total
pregnancy
0.49 0.47 0.53 0.64 0.32 0.26 0.77 0.76 0.73 1
Month 0-6
postnatally
0.48 0.21 0.22 0.42 0.66 0.27 0.66 0.22 0.30 0.57 1
Month 7-12
postnatally
0.17 0.29 0.44 0.37 0.26 0.63 0.34 0.68 0.78 0.77 0.39 1
Values reflect Pearson correlation coefficients between air pollution exposure estimates for different prenatal and postnatal periods
Van den Hooven et al. Environmental Health 2012, 11:9
/>Page 5 of 11
maps of the spatial distribution of annual PM
10
and NO
2
concentrations in the study area [18,19], which demon-
strated differences in annual average concentrations up to
4-8 μg/m
3
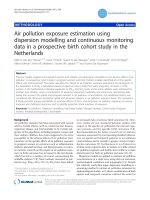
between urban and suburban areas. Figure 1
presents the temporal variation in PM
10
and N O
2
exposure
levels estimated at two different locations in the study area
(one situated in the city center and one situated in a sub-
urb of Rotterdam). Especially for NO
2
, substantial differ-
ences were observed between the t wo locations.
For illustrative purposes, we present mean maternal
air pollution exposure during total pregnancy according
to maternal characteristics (Table 3) and infant charac-
teristics (Table 4). Table 3 shows that PM
10
and NO
2
exposure levels were higher for mo thers who were
younger than 25 years, of non-Dutch ethnicity, nullipar-
ous, were exposed to higher noise levels, liv ed in a low
neighbourhood income area, and whose conception
occurred in summer or fall. In addition, NO
2
exposure
was slightly higher in women who continued smoking,
and PM
10
exposure was higher in women who contin-
ued to consume alcohol during pregnancy. There was a
clear decrease in air pollution exposure over time:
women whose conce ption fell between 2001 and 2003
were exposed to higher PM
10
and NO
2
levels during
pregnancy than women with a conception date in 2004
or 2005. Table 4 shows tha t mothers were exposed to
higher PM
10
and NO
2
levels when they gave birth in
spring or sum mer, compared with winter or fall. Mean
exposure levels according to the year of birth also
showed a d ecreasing trend in air pollution concentra-
tions between 2002 and 2006.
Discussion
For the participants of this large population-based
cohort study, we assessed individual air pollution expo-
sure at the home address using advanced state-of-the-
art methods. By using a combination of GIS based dis-
persion modelling a nd continuous monitoring data, we
were able to take into account the spatial and temporal
variation in air pollution concentrations. The individual
exposure estimates can be used in further epidemiologi -
cal studies that examine air pollution effects in this
population of mothers and children.
Air pollution exposure
In our air pollution exposure assessment procedure, we
were able to consider fine spatial and temporal contrasts
in exposure by using a combination of d ispersio n mod-
elling and continuous monitoring. The high temporal
reso lution enables investigation of relatively short expo-
sure windows (e.g., total pregnancy, trimesters, or
months) that are particularly of interest in pregnant
women and children. It also facilitates identification of
critical windows of exposure. These short-term exposure
windows cannot be examined in studies with only
annual average concentrations. In examination of the
different exposure windows, the (possibly) moderate to
high correlations among some of the exposure averages
need to be considered when interpreting the results.
Next to a high temporal resolution, detailed information
on spatial contrasts in air pollution exposure is required,
since ambient air pollutants display significant small-
scale spatial variatio n. This intra-urban spatial variation
has been documented especially for traffic-related pollu-
tantssuchasNO
2
, black smoke, elemental carbon,
ultrafine particles, and to a lesser extent for PM
10
and
PM
2.5
[26,27]. Our exposure estimates have been used
in three previous studies on air pollution effects in the
same population, which suggest that exposure to air pol-
lution during pregnancy may affect maternal and fetal
health [18,19,28].
We explored whether air pollution exposure levels
were differentially distributed according to maternal and
infant characteristics. Associations between air pollution
exposure and health may be subject to confounding, if
sociodemographic and lifestyle-related factors are asso-
ciated both with air pollution exposure and with health.
Our illustrative findings suggest that in our cohort, air
pollution exposure may be differentially distributed
according to age, ethnicity, parity, neighbourhood
income area, smoking, and alcohol consumption. This
stresses the importance to account for these factors
when analyzing the associations between air pollution
exposure and health.
Rotterdam is the second largest city in the Nether-
lands with a high population density and the l argest
port of Europe. It is characterized by high emissions
from road traffic, shipping, households, and industry. A
few recent European studies assessed air pollution expo-
sure in pregnant women using land-use regression mod-
elling approaches that also considered spatiotemporal
variation in exposure [29-32]. In these studies, mean
NO
2
exposure levels estimated for the entire pregnancy
were slightly lower than those obtained in our cohort ( i.
e., around 36-37 μg/m
3
compared with 40 μg/m
3
in our
cohort). None of the stu dies assessed PM
10
exposure.
The differences in exposure levels can be explained by
various factors, including the geographic location and
urbanization degree of the study area, study period (sea-
son and year), modelling approach input data, climate,
meteorological conditions, and pollution sources.
Traffic-related air pollution is a complex mixture of
several pollutants. We assessed exposure to PM
10
and
NO
2
in our cohort, because these pollutants have been
routinely measured in the National Air Quality Monitor-
ing Network during the study period, and they often
exceed the air quality standards at locations near heavy
traffic. Furthermore, PM
10
and NO
2
can be regarded as
Van den Hooven et al. Environmental Health 2012, 11:9
/>Page 6 of 11
markers for the traffic-related air pollution mixture and
have been associated with several adverse health effects
[1,2,9,33-35]. Other components that may be relevant
for health (PM
2.5
, black smoke) have not been moni-
toredduringthestudyperiodandcouldthereforenot
be assessed. Up to now, we have assessed a ir pollution
Figure 1 Illustration of the temporal variation in of PM
10
and NO
2
exposure levels in the study area.a.PM
10
concentration. b. NO
2
concentration. Estimated PM
10
and NO
2
concentrations in 2003 at two different locations in the study area. Location 1 is located in the city
center, whereas location 2 is situated in a suburb of Rotterdam.
Van den Hooven et al. Environmental Health 2012, 11:9
/>Page 7 of 11
Table 3 Maternal air pollution exposure during pregnancy according to maternal characteristics
NPM
10
exposure (μg/m
3
) Mean (SD) NO
2
exposure (μg/m
3
) Mean (SD)
Maternal characteristics
Age
< 25 years 1446 30.5 (3.2) * 40.4 (3.8) *
25-30 years (Reference) 2051 30.2 (3.1) 39.8 (4.2)
30-35 years 2998 30.1 (3.2) 39.5 (4.4) *
> 35 years 1395 30.0 (3.2) 39.5 (4.3)
Body mass index
< 20 kg/m
2
627 30.5 (3.2) 40.3 (4.2)
20-25 kg/m
2
(Reference) 3714 30.3 (3.2) 39.8 (4.2)
25-30 kg/m
2
1843 30.3 (3.1) 39.8 (4.1)
> 30 kg/m
2
972 30.0 (3.2) 39.6 (4.0)
Missing 734 29.1 (3.1) ** 38.6 (4.7) **
Ethnicity
Dutch/Caucasian (Reference) 4268 30.1 (3.2) 39.4 (4.5)
Turkish 622 30.1 (3.0) 40.2 (3.5) **
Moroccan 489 30.2 (3.0) 40.1 (3.5) *
Surinamese 619 30.6 (3.2) * 40.2 (4.0) **
Other 1151 30.4 (3.3) * 40.3 (4.1) **
Missing 741 29.8 (3.0) 40.1 (4.0) **
Educational level
No education/primary 757 30.3 (3.1) 40.0 (3.6)
Secondary 3102 30.3 (3.2) 39.7 (4.3)
Higher (Reference) 3132 30.1 (3.2) 39.6 (4.4)
Missing 899 29.8 (3.0) 40.1 (4.0) *
Parity
Nulliparous (Reference) 4129 30.3 (3.2) 40.0 (4.3)
Multiparous 3528 30.1 (3.1) * 39.5 (4.1) **
Missing 233 29.4 (3.1) ** 38.8 (4.5) **
Smoking in pregnancy
No (Reference) 4616 30.2 (3.2) 39.7 (4.2)
First trimester only 527 30.5 (3.3) 40.1 (4.6)
Continued 1059 30.5 (3.2) 40.2 (4.2) *
Missing 1688 29.6 (2.9) ** 39.5 (4.2)
Alcohol use in pregnancy
No (Reference) 3022 30.2 (3.2) 39.8 (4.1)
First trimester only 820 30.2 (3.2) 39.6 (4.4)
Continued 2415 30.4 (3.2) * 39.9 (4.3)
Missing 1633 29.7 (2.9) ** 39.5 (4.2)
Noise exposure
< 50 dB(A) 2985 29.6 (3.0) ** 37.9 (3.3) **
50-65 dB(A) (Reference) 4016 30.2 (3.1) 39.8 (3.6)
> 65 dB(A) 791 32.2 (3.5) ** 46.0 (4.3) **
Missing 91 29.8 (3.1) 40.0 (4.0)
Neighbourhood income
Low 1141 30.9 (2.9) ** 41.0 (3.2) **
Moderate (Reference) 4678 30.0 (3.1) 39.6 (4.2)
High 1945 30.2 (3.2) 39.6 (4.5)
Van den Hooven et al. Environmental Health 2012, 11:9
/>Page 8 of 11
exposure until the year 2008, and we are planning to
update this data for future years when the relevant mon-
itoring data will be av ailable (for P M
10
,NO
2
, and speci-
fic components). In addition, exposure to other, ‘criteria’
airpollutantssuchasSO
2
and CO could be estimated
in the future using the same modelling procedure.
Assigning exposures based on the home address at
time of delivery may introduce exposure misclassifica-
tion as a nu mber of women change their address during
pregnancy [36], and are thus exposed to different levels
of air pollution. We obtained full residential history o f
the participants, which showed that 26% of the women
Table 3 Maternal air pollution exposure during pregnancy according to maternal characteristics (Continued)
Missing 126 28.4 (3.2) ** 35.2 (5.5) **
Season of conception
Winter (Reference) 2184 29.9 (3.8) 38.8 (4.5)
Spring 1850 29.7 (2.6) 38.9 (4.1)
Summer 1810 30.5 (2.4) ** 41.1 (3.8) **
Fall 2046 30.5 (3.4) ** 40.3 (3.9) **
Year of conception
2001 (Reference) 345 34.6 (1.3) 39.6 (3.4)
2002 2161 33.1 (1.6) ** 41.8 (3.8)
2003 2468 29.5 (3.0) ** 39.9 (4.2) **
2004 2460 28.0 (2.0) ** 38.2 (3.9) **
2005 456 28.4 (1.2) ** 37.4 (4.1) **
** P < 0.01
* P < 0.05
Values are mean PM
10
and NO
2
exposure levels for the total pregnancy period. P-values are based on One-way ANOVA followed by Bonferroni’s post hoc
comparison tests to examine the differences in means compared with the Reference group
Table 4 Maternal air pollution exposure during total pregnancy according to infant characteristics
NPM
10
exposure (μg/m
3
) Mean (SD) NO
2
exposure (μg/m
3
) Mean (SD)
Child characteristics
Gestational age at birth
< 37 weeks 463 30.4 (3.3) 40.0 (4.5)
37-42 weeks (Reference) 6871 30.2 (3.1) 39.7 (4.2)
< 42 weeks 556 30.1 (3.3) 39.7 (4.1)
Birth weight
< 2500 grams 359 30.4 (3.1) 40.0 (4.4)
2500-4500 grams (Reference) 7194 30.2 (3.2) 39.7 (4.2)
> 4500 grams 337 30.0 (3.2) 39.6 (4.3)
Season of birth
Winter (Reference) 1856 29.7 (2.7) 38.9 (4.1)
Spring 1781 30.4 (2.3) ** 41.0 (3.8) **
Summer 2098 30.5 (3.4) ** 40.4 (4.0) **
Fall 2155 30.0 (3.8) 38.7 (4.5)
Year of birth
2002 (Reference) 696 33.6 (1.7) 39.6 (3.5)
2003 2406 33.2 (1.6) ** 41.9 (3.9) **
2004 2548 27.6 (2.4) ** 39.0 (4.2) *
2005 2214 28.8 (1.5) ** 38.3 (3.9) **
2006 26 27.8 (1.3) ** 36.8 (4.1) *
** P < 0.01
* P < 0.05
Values are mean PM
10
and NO
2
exposure levels for the total pregnancy period. P-values are based on One-way ANOVA followed by Bonferroni’s post hoc
comparison tests to examine the differences in means compared with the Reference group
Van den Hooven et al. Environmental Health 2012, 11:9
/>Page 9 of 11
moved at least once in the period between conception
and the first year postnatally. Air pollution exposure
estimates were assessed for th e different prenatal and
postnatal addresses. There can still be non-differential
misclassification of air pollution exposure, since expo-
sure levels were estimated at the home address, and
people do not spend all of their time at home. Indoor,
occupational, or commuting sources of air pollution
have not been captured in our modelling procedures.
The extent of the possible misclassification may be
minor in this specific population, as pregnant women
are likely to spend more time at home than non-preg-
nant individuals, especially in the last stage of pregnancy
[37].
There is increasing awareness of the importance to
incorpora te information on noise exposure in studies on
traf fic- relat ed air polluti on exposure and health [10-13].
Thus far, few studies have included both air pollution
and noise when investigating health outcomes
[10,38-40]. In our previous studies on air pollution and
pregnancy outcomes, we included information on noise
exposure, in order to adjust for its potential confound-
ing effect [18,19].
Conclusions
Detailed air pollution exposure levels are available for
mothers, fathers, and children in the Generation R
Study and efforts are ongoing to update these exposures.
The individual exposure estimates can be used in
further epidemiological studies focused on the effects of
prenatal and postnatal air pollution exposure on various
health outcomes in mothers and children, including
reproductive outcomes, growth and development, cogni-
tive function, respiratory function, and cardiovascular
outcomes. The combination with other detailed data
(noise levels, biomarkers, and genetics) enables in-depth
investigations and identification of critical windows of
exposure.
Abbreviations
EU: European Union; GIS: Geographic information system; PM
10:
Particulate
matter with an aerodynamic diameter < 10 μm; PM
2.5:
Particulate matter
with an aerodynamic diameter < 2.5 μm; NO
2:
Nitrogen dioxide; CO: Carbon
monoxide; O
3:
Ozone; SO
2:
Sulfur dioxide.
Acknowledgements
The Generation R Study is conducted by the Erasmus Medical Center
Rotterdam in close collaboration with the School of Law and Faculty of
Social Sciences of the Erasmus University Rotterdam, the Municipal Health
Service Rotterdam area, the Rotterdam Homecare Foundation and the
Stichting Trombosedienst & Artsenlaboratorium Rijnmond (STAR-MDC),
Rotterdam. We gratefully acknowledge the contribution of participating
mothers and children, general practitioners, hospitals, midwives and
pharmacies in Rotterdam. We also thank Henk Vos, Reinier Sterkenburg, and
Han Zhou from TNO Urban Environment and Safety for exposure
assessment, data linkage and providing air pollution maps, and the DCMR
Environmental Protection Agency Rijnmond (DCMR) for kindly supplying
data. The general design of the Generation R Study is made possible by
financial support from the Erasmus Medical Center Rotterdam, the Erasmus
University Rotterdam, the Netherlands Organization for Health Research and
Development (ZonMw), the Netherlands Organisation for Scientific Research
(NWO), the Ministry of Health, Welfare and Sport, and the Ministry of Youth
and Families. Dr. Jaddoe reports receipt of funding from the Netherlands
Organization for Health Research and Development (ZonMw 90700303,
916.10159). TNO received funding from The Netherlands Ministry of
Infrastructure and the Environment (VROM) to support exposure assessment.
Author details
1
The Generation R Study Group, Erasmus Medical Center, Rotterdam, The
Netherlands.
2
Urban Environment and Safety, TNO, Utrecht, The Netherlands.
3
Department of Epidemiology, Erasmus Medical Center, Rotterdam, The
Netherlands.
4
Department of Paediatrics, Erasmus Medical Center, Rotterdam,
The Netherlands.
Authors’ contributions
All authors have made substantial contribution to this study and to the
writing and editing of the manuscript. Additional contributions are as
follows: EHH was involved in the planning of the study, data collection,
descriptive analyses, and interpretation of data, and drafted the manuscript;
FHP, VWVJ and YK contributed to the design of the study, supervision,
interpretation of data and critical review of the manuscript; SWR, PYJZ, and
EWM designed the exposure assessment and performed exposure
calculations; AH conceptionalised the Generation R study and participated in
its design and conduction; HMEM contributed to the design of the study
and had critical input. All authors read and approved the final manuscript.
Competing interests
The authors declare that they have no competing interests.
Received: 9 September 2011 Accepted: 22 February 2012
Published: 22 February 2012
References
1. Pope CA, Dockery DW: Health effects of fine particulate air pollution:
lines that connect. J Air Waste Manag Assoc 2006, 56:709-742.
2. Brook RD, Rajagopalan S, Pope CA, Brook JR, Bhatnagar A, Diez-Roux AV,
Holguin F, Hong Y, Luepker RV, Mittleman MA, et al: Particulate matter air
pollution and cardiovascular disease: An update to the scientific
statement from the American Heart Association. Circulation 2010,
121:2331-2378.
3. Kampa M, Castanas E: Human health effects of air pollution. Environ Pollut
2008, 151:362-367.
4. Sun Q, Hong X, Wold LE: Cardiovascular effects of ambient particulate air
pollution exposure. Circulation 2010, 121:2755-2765.
5. Wang L, Pinkerton KE: Air pollutant effects on fetal and early postnatal
development. Birth Defects Res C Embryo Today 2007, 81:144-154.
6. Ritz B, Wilhelm M: Ambient air pollution and adverse birth outcomes:
methodologic issues in an emerging field. Basic Clin Pharmacol Toxicol
2008, 102:182-190.
7. Bonzini M, Carugno M, Grillo P, Mensi C, Bertazzi PA, Pesatori AC: Impact of
ambient air pollution on birth outcomes: systematic review of the
current evidences. Med Lav 2010, 101:341-363.
8. Shah PS, Balkhair T, Knowledge Synthesis Group on Determinants of
Preterm and LBW births: Air pollution and birth outcomes: a systematic
review. Environ Int 2011, 37:498-516.
9. Slama R, Darrow L, Parker J, Woodruff TJ, Strickland M, Nieuwenhuijsen M,
Glinianaia S, Hoggatt KJ, Kannan S, Hurley F, et al: Meeting report:
atmospheric pollution and human reproduction. Environ Health Perspect
2008, 116:791-798.
10. De-Kluizenaar Y, Gansevoort RT, Miedema HM, De-Jong PE: Hypertension
and road traffic noise exposure. J Occup Environ Med 2007, 49:484-492.
11. Allen RW, Davies H, Cohen MA, Mallach G, Kaufman JD, Adar SD: The
spatial relationship between traffic-generated air pollution and noise in
2 US cities. Environ Res 2009, 109:334-342.
12. Davies HW, Vlaanderen JJ, Henderson SB, Brauer M: Correlation between
co-exposures to noise and air pollution from traffic sources. Occup
Environ Med 2009, 66:347-350.
13. Foraster M, Deltell A, Basagana X, Medina-Ramon M, Aguilera I, Bouso L,
Grau M, Phuleria HC, Rivera M, Slama R, et al: Local determinants of road
Van den Hooven et al. Environmental Health 2012, 11:9
/>Page 10 of 11
traffic noise levels versus determinants of air pollution levels in a
Mediterranean city. Environ Res 2011, 111:177-183.
14. Jerrett M, Arain A, Kanaroglou P, Beckerman B, Potoglou D, Sahsuvaroglu T,
Morrison J, Giovis C: A review and evaluation of intraurban air pollution
exposure models. J Expo Anal Environ Epidemiol 2005, 15:185-204.
15. Bellander T, Berglind N, Gustavsson P, Jonson T, Nyberg F, Pershagen G,
Jarup L: Using geographic information systems to assess individual
historical exposure to air pollution from traffic and house heating in
Stockholm. Environ Health Perspect 2001, 109:633-639.
16. Jaddoe VW, Van-Duijn CM, Van der-Heijden AJ, Mackenbach JP, Moll HA,
Steegers EA, Tiemeier H, Uitterlinden AG, Verhulst FC, Hofman A: The
Generation R Study: design and cohort update 2010. Eur J Epidemiol
2010, 25:823-841.
17. Jaddoe VW, Bakker R, Van-Duijn CM, Van der-Heijden AJ, Lindemans J,
Mackenbach JP, Moll HA, Steegers EA, Tiemeier H, Uitterlinden AG, et al:
The Generation R Study Biobank: a resource for epidemiological studies
in children and their parents. Eur J Epidemiol 2007, 22:917-923.
18. Van den-Hooven EH, De-Kluizenaar Y, Pierik FH, Hofman A, Van-
Ratingen SW, Zandveld PYJ, Mackenbach JP, Steegers EAP, Miedema HME,
Jaddoe VWV: Air pollution, blood pressure, and the risk of hypertensive
complications during pregnancy: the Generation R Study. Hypertension
2011, 57:406-412.
19. Van den-Hooven EH, Pierik FH, de-Kluizenaar Y, Willemsen SP, Hofman A,
Van-Ratingen SW, Zandveld PYJ, Mackenbach JP, Steegers EAP,
Miedema HME, Jaddoe VWV: Air pollution exposure during pregnancy,
ultrasound measures of fetal growth, and adverse birth outcomes: a
prospective cohort study. Environ Health Perspect 2012, 120:150-156.
20. Netherlands Ministry of Infrastructure and the Environment: Air Quality
Decree 2007 (Regeling beoordeling Luchtkwaliteit 2007). Staatscourant
2007, Available: [accessed 12
September 2010].
21. Beelen R, Voogt M, Duyzer J, Zandveld P, Hoek G: Comparison of the
performances of land use regression modelling and dispersion
modelling in estimating small-scale variations in long-term air pollution
concentrations in a Dutch urban area. Atmospheric Environment 2010,
44:4614-4621.
22. Keuken M, Zandveld P, Van den-Elshout S, Janssen NAH, Hoek G: Air
quality and health impact of PM10 and EC in the city of Rotterdam, the
Netherlands in 1985-2008. Atmospheric Environment 2011, 45:5294-5301.
23. De-Kluizenaar Y, Janssen SA, Van-Lenthe FJ, Miedema HM, Mackenbach JP:
Long-term road traffic noise exposure is associated with an increase in
morning tiredness. J Acoust Soc Am 2009, 126:626-633.
24. European Commission: Directive 2008/50/EC of the European Parliament
and of the Council of 21 May 2008 on ambient air quality and cleaner
air for Europe. 2008, Available: />LexUriServ.do?uri=OJ:L:2008:152:0001:0044:EN:PDF.
25. World Health Organization: Health aspects of air pollution. Results from the
WHO project “Systematic review of health aspects of air pollution in Europe”
2004, Available: />E83080.pdf.
26. Fischer PH, Hoek G, Van-Reeuwijk H, Briggs DJ, Lebret E, Van-Wijnen JH,
Kingham S, Elliott PE: Traffic-related differences in outdoor and indoor
concentrations of particles and volatile organic compounds in
Amsterdam. Atmospheric Environment 2000, 34:3713-3722.
27. Lewne M, Cyrys J, Meliefste K, Hoek G, Brauer M, Fischer P, Gehring U,
Heinrich J, Brunekreef B, Bellander T: Spatial variation in nitrogen dioxide
in three European areas. Sci Total Environ 2004, 332:217-230.
28. Van den-Hooven EH, de-Kluizenaar Y, Pierik FH, Hofman A, Van-
Ratingen SW, Zandveld PYJ, Lindemans J, Russcher H, Steegers EAP,
Miedema HME, Jaddoe VWV: Chronic air pollution exposure during
pregnancy and maternal and fetal C-reactive protein levels. The
Generation R Study. Environ Health Perspect 2012, doi:10.1289/ehp.1104345.
29. Aguilera I, Sunyer J, Fernandez-Patier R, Hoek G, Aguirre-Alfaro A,
Meliefste K, Bomboi-Mingarro MT, Nieuwenhuijsen MJ, Herce-Garraleta D,
Brunekreef B: Estimation of outdoor NO(x), NO(2), and BTEX exposure in
a cohort of pregnant women using land use regression modeling.
Environ Sci Technol 2008, 42:815-821.
30. Slama R, Morgenstern V, Cyrys J, Zutavern A, Herbarth O, Wichmann HE,
Heinrich J: Traffic-related atmospheric pollutants levels during pregnancy
and offspring’s term birth weight: a study relying on a land-use
regression exposure model. Environ Health Perspect 2007, 115:1283-1292.
31. Iniguez C, Ballester F, Estarlich M, Llop S, Fernandez-Patier R, Aguirre-
Alfaro A, Esplugues A, Inma Study group V: Estimation of personal NO2
exposure in a cohort of pregnant women. Sci Total Environ 2009,
407:6093-6099.
32. Gehring U, Wijga AH, Fischer P, De-Jongste JC, Kerkhof M, Koppelman GH,
Smit HA, Brunekreef B: Traffic-related air pollution, preterm birth and
term birth weight in the PIAMA birth cohort study. Environ Res 2011,
111:125-135.
33. Peters A: Particulate matter and heart disease: evidence from
epidemiological studies. Toxicol Appl Pharmacol 2005, 207:477-482.
34. Kannan S, Misra DP, Dvonch JT, Krishnakumar A: Exposures to airborne
particulate matter and adverse perinatal outcomes: a biologically
plausible mechanistic framework for exploring potential effect
modification by nutrition. Environ Health Perspect 2006, 114:1636-1642.
35. World Health Organization: Air quality guidelines. Global update 2005
Particulate matter, ozone, nitrogen dioxide and sulphur dioxide; 2006,
Available: />WHO_SDE_PHE_OEH_06.02_eng.pdf.
36. Fell DB, Dodds L, King WD: Residential mobility during pregnancy.
Paediatr Perinat Epidemiol 2004, 18:408-414.
37. Nethery E, Brauer M, Janssen P: Time-activity patterns of pregnant women
and changes during the course of pregnancy. J Expo Sci Environ Epidemiol
2009, 19:317-324.
38. Tobias A, Diaz J, Saez M, Alberdi JC: Use of poisson regression and box-
jenkins models to evaluate the short-term effects of environmental
noise levels on daily emergency admissions in Madrid, Spain. Eur J
Epidemiol 2001, 17:765-771.
39. Beelen R, Hoek G, Houthuijs D, Van den-Brandt PA, Goldbohm RA,
Fischer P, Schouten LJ, Armstrong B, Brunekreef B: The joint association of
air pollution and noise from road traffic with cardiovascular mortality in
a cohort study.
Occup Environ Med 2009, 66(4):243-50.
40. Selander J, Nilsson ME, Bluhm G, Rosenlund M, Lindqvist M, Nise G,
Pershagen G: Long-term exposure to road traffic noise and myocardial
infarction. Epidemiology 2009, 20:272-279.
doi:10.1186/1476-069X-11-9
Cite this article as: Van den Hooven et al.: Air pollution exposure
estimation using dispersion modelling and continuous monitoring data
in a prospective birth cohort study in the Netherlands. Environmental
Health 2012 11:9.
Submit your next manuscript to BioMed Central
and take full advantage of:
• Convenient online submission
• Thorough peer review
• No space constraints or color figure charges
• Immediate publication on acceptance
• Inclusion in PubMed, CAS, Scopus and Google Scholar
• Research which is freely available for redistribution
Submit your manuscript at
www.biomedcentral.com/submit
Van den Hooven et al. Environmental Health 2012, 11:9
/>Page 11 of 11