Exposures to fine particulate air pollution and respiratory outcomes in adults using two national datasets: a cross-sectional study doc
Bạn đang xem bản rút gọn của tài liệu. Xem và tải ngay bản đầy đủ của tài liệu tại đây (488.36 KB, 12 trang )
RESEARCH Open Access
Exposures to fine particulate air pollution and
respiratory outcomes in adults using two national
datasets: a cross-sectional study
Keeve E Nachman
1*
and Jennifer D Parker
2
Abstract
Background: Relationships between chronic exposures to air pollution and respiratory health outcomes have yet
to be clearly articulated for adults. Recent data from nationally representative surveys suggest increasing disparity
by race/ethnicity regarding asthma-related morbidity and mortality. The objectives of this study are to evaluate the
relationship between annual average ambient fine particulate matter (PM
2.5
) concentrations and respiratory
outcomes for adults using modeled air pollution and health outcome data and to examine PM
2.5
sensitivity across
race/ethnicity.
Methods: Respondents from the 2002-2005 National Health Interview Survey (NHIS) were linked to annual kriged
PM
2.5
data from the USEPA AirData system. Logistic regression was employed to investigate increases in ambient
PM
2.5
concentrations and self-reported prevalence of respiratory outcomes including asthma, sinusitis and chronic
bronchitis. Models included health, behavioral, demographic and resource-related covariates. Stratified analyses
were con ducted by race/ethnicity.
Results: Of nearly 110,000 adult respondents, approximately 8,000 and 4,000 reporte d current asthma and recent
attacks, respectively. Overall, odds ratios (OR) for current asthma (0.97 (95% Confidence Interval: 0.87-1.07)) and
recent attacks (0.90 (0.78-1.03)) did not suggest an association with a 10 μg/m
3
increase in PM
2.5
. Stratified analyses
revealed significant associations for non-Hispanic blacks [OR = 1.73 (1.17-2.56) for current asthma and OR = 1.76
(1.07-2.91) for recent attacks] but not for Hispanics and non-Hispanic whites. Significant associations were observed
overall (1.18 (1.08-1.30)) and in non-Hispanic whites (1.31 (1.18-1.46)) for sinusitis, but not for chronic bronchitis.
Conclusions: Non-Hispanic blacks may be at increased sensitivity of asthma outcomes from PM
2.5
exposure.
Increased chronic PM
2.5
exposures in adults may contribute to population sinusitis burdens.
Keywords: Particulate matter, Asthma, Sinusitis, Air pollution, National Health Interview Survey (NHIS)
Background
Rel ationships between exposure to particulate air poll u-
tion and a variety of adverse effects, including cardiovas-
cular a nd respiratory diseases, birth outcomes, genetic
polymorphisms, as well as mortality and life expectancy
have been studied [1-8]. A number of studies have
investigated the influence of exposure to particulate
matter on development of respiratory outcomes, though
the majority focus o n children [9-13]; a limited num ber
of published reports exist documenting of the effects of
chronic exposures on non-cancer respiratory outcomes
in adults [14-17].
National prevalence data for several respiratory condi-
tions are available from the National Center for Health
Statistics (NCHS) of the Centers for Disease Control
and Prevention (CDC), who have estimated that as of
2007, approximately 7, 11 and 3% of non-institutiona-
lized adults reported current asthma, recent sinusitis
and chronic bronchitis, respectively [18].
Theburdenofasthmahasbeenshowntobedispro-
portionately distributed across r ace/ethnic groups [19].
Much research has evaluated this differentia l in children
* Correspondence:
1
Department of Environmental Health Sciences, Johns Hopkins Bloomberg
School of Public Health, Baltimore, MD, USA
Full list of author information is available at the end of the article
Nachman and Parker Environmental Health 2012, 11:25
/>© 2012 Nachman and Parker; licensee BioMed Central Ltd. This is an Op en Access article distributed under the terms of the C reative
Commons Attribution License ( which permits unrest ricted use, distribution, and
reproduction in any medium, provided the origina l work is properly cited.
[20-23], though relatively fewer investigations have
focused on adults. Results from nationally-representative
surveys suggest relatively smaller differences in asthma
burden by race/ethnicity among adults as compared to
children [19], though recent evidence from the National
Hospital Discharge Survey and National Vital Statistics
System has indicated that disparities in asthma-related
hospitalization and mortality may be increasing over
time [24,25].
Variations in the burden of sinusitis and chronic bron-
chitis across population groups have been documented
in the 2007 National Health Interview Survey (NHIS)
[18]. A recently published summary of indicators mea-
sured in t he NHIS reported that, as compared to non-
Hispanic whites and blacks, Hispanic adults were less
likely to have been tol d they had sinusit is or chronic
bronchitis in the last twelve months. Estimates f urther
stratified by sex indicated recent sinusitis and chronic
bronchitis diagnoses were most c ommon among non-
Hispanic black and white women.
It has been suggested that differential exposures to
environmental pollutants may contribute to race/ethnic
disparities in health outcomes. Research has found dis-
similar distributions o f exposure to fine particulate mat-
ter across race/ethnicity [26-28]. In addition, increased
attention is being paid to the role of racial residential
segregation in disproportionate exposures to environ-
mental hazards (such as particulate air pollution) across
race/ethnicity [29,30], especially among African A meri-
cans [31].
A limited number of studies have examined the poten-
tial for race/ethnicity to act as an effect modifier on the
relationship between exposure t o ambient air pollutants
and selected health outcomes. The impact of fine parti-
culate matter exposure on birth weight was found to be
differential across race [1]. An examination of the asso-
ciation between nitrogen dioxide exposure on asthma-
related hospitalizations in children found race/ethnicity
to modify the relationship, even after controlling for
health insurance status [32]. While few in number, these
studies suggest that race/ethnicity may influence the
relationship between exposure to particulate matter and
respiratory outcomes.
Evaluating the role of air pollutant exposure in
respiratory disease across racial/ethnic g roups at the
national scale can be fa cilitated by harnessing the utility
of diverse data systems. Integration of data systems initi-
ally created for differing purposes is a critical compo-
nent of the environmental public health tracking
initiative [33] that has evolved out of recommendations
from the 2000 Pew Environmental Health Comm ission
[34]. A 2006 symposium organized by the USEPA and
CDC championed the linkage of air pollution and
national health survey data for the purpose of
epidemiological investigations; participants identified
important data gaps, suggestions for improvements in
design and collection of air quality and health data, and
other critical considerations [35].
Recent efforts to link ambient monitoring data to
health data, in attempts to reduce potential misclassifi-
cation of exposures, have moved beyond city and
county-based measures to employ distance-based
metrics [36,37], such as assignment of a nnual pollution
exposure concentrations from the nearest monitor
within a specified radial distance from the respondent,
or taking the mean (or distance-weighted mean) of all
monitored annual average concentrations within that
radius. One of the primary shortcomings of using dis-
tance-based assignment methods is the inability to
assign exposures to respondents for whom monitoring
data are not available within the specified radial distance
or for whom county-level monitoring data are not col-
lected. Given that monitors are likely to be placed in
areas expected to be impacted by air pollution or in
more popula ted areas, inclusion of subjects in epidemio-
logic investigations is likely to differentially exclude per-
sons living in more rural settings [36].
Since personal exposures to air pollution are not mea-
sured as part of the N ational Center for Health Statistics
(NCHS) surveys, previous investigations using these
health data have emplo yed distance- or metropolitan sta-
tistical area (MSA)-based measures of ambient pollutant
concentrations to serve as surrogate measures of expo-
sure [36,38-43]. Geospatial prediction methods such as
kriging are b ecoming more common i n environmental
research [44], and allow for the estimation of ambient
concentrations at unsampled locations. Predictions are
made as a function of the spatial autocorrelation of the
data, and allow for an estimation of the predict ion var-
iance or error in interpolated exposu res. A key advantage
of using spatial interpolation methods to link ambient
pollution data to nationally-administered health surveys
is the ability to estimate ambient exposure concentra-
tions for respondents who were not able to be assigned
exposures using distance-based methods. Assigning
exposures to these respondents allows for a larger study
population and may reduce concern over its re presenta-
tiveness by including more persons outside of urban
areas. Given the tendency to place monitors in areas with
higher concentrations of air pollution, using spatial inter-
polation will likely result in inclusion of more “control”
subjects, or persons exposed to l ower ambient pollutant
concentrations. Interpolation-based exposure assignment
may also reduce the clustering of exposure estimates that
can result from usi ng MSA- o r county-based averages to
assign exposures to study subjects.
The objective of this study is to evaluate the relation-
ship between chronic exposure to fine particulate matter
Nachman and Parker Environmental Health 2012, 11:25
/>Page 2 of 12
ontheprevalenceofadverserespiratoryoutcomesfor
adults using modeled air pollution data from the EPA
AirData system and health outcome data from the
National Health Interview Survey (NHIS) geocoded to
respondent locations (explained below). In addition, this
study evaluates whether these relationships are the same
for Hispanic and Non-Hispanic black and white persons.
Given the nationally-representative nature of the
employed datasets and the diverse study population,
interpretation of these results can be informative in the
policy setting and for guiding further investigation.
Methods
Air monitoring data and criteria for selection of monitors
Annual data for PM
2.5
for the years 2002-5 were down-
loaded f rom the USEPA AirData website [45]. Relevant
fields used for model predictions of ambient concentra-
tions using monito ring data were derived from the
Annual Summary, Sites, and Monitor tables available
from AirData. Criteria were established for the selection
of monitor values for inclus ion in the kriging interpola-
tion process. Annual arithmetic mean concentrations for
PM
2.5
at each monitor were downloaded from the Air-
Data website for each year between 2002 - 2005. Sepa-
rate interpolations we re performed for each year; for a
monitor to be used in interpolation for a given year, the
monitor must have reported an annual arithmetic mean
for that year. Only monitors from the contiguous 48
states were included in the study, and monitors with
missing locational information (latitude or longitude)
were excluded.
Estimation and assignment of exposure from air
monitoring data
The AirData system provides locations of monitoring
sites in latitude and longitude format. Within the Air-
Data system, the USEPA does not use the same refe r-
ence datum to assign geographic locations for its
monitoring sites. For each monitoring site in the data-
base, one of three reference datums (NAD23, NAD84,
and W SG84) was u sed to assign lat itude and longitude
data to monitoring sites, except for in some cases, in
which the datum used for assignment was not listed and
therefore is unknown. An earlier evaluation of potential
miscalculations arising from unspecified or incorrectly
specified datum found that at the national scale, impacts
on distance calculations would be negligible [39].
Monitor locations were converted from a geographic
(spherical) coordinate syst em into a projected (planar)
coordinate system to facilitate kriging. Locations were
initially projected using the WGS84 projection system in
the ArcView GIS version 9.2 software package, and
coordinates were re-projected on the North American
Equal Albers Conic projection in (X,Y) format (in
meters).
Once the data were re-projected, empirical semivario-
grams using the classical estimator were plotted using
the geoR package [46] in the R computing environment
[47]. Theoretical semivariograms wer e plotted over the
empirical semivariograms to derive starting parameters
for the final semivariogram model estimation. For each
year of monitoring data, restricted maximum likelihood
estimation was used to evaluate the fit of five models
(exponential, spherical, circular, matèrn and cubic corre-
latio n functions). Mod el selection was performed on the
basisofcomparisonofAkaike’s Information Criterion
(AIC). Subsequent to model selection, an evaluation of
predictions was performed using this leave-one-out
method, where a measured data point was dropped, and
the remaining data points were used to predict the data
value at that location. This process, repe ated for e ach
measured data point, is known as cross-validation.
National health interview survey
We combined NHIS data for 2002-2005 for this analysis.
The NHIS is a large nationally representative survey of
the civilian non-institutionalized population of the Uni-
ted States (information available at />nchs/nhis.htm) that has been conducted since 1957,
although the survey design and questionnaire have
changed over time. Very briefly, the NHIS is a cross-sec-
tional household interview survey conducted c ontinu-
ously throughout the year. For these survey years, after
state-level stratification, the first stage of its multistage
probability design consisted of a sample of 358 primary
sampling unit s (PSUs) drawn from approximately 1,900
geographically defined PSUs. PSUs are counties or
groups of counties, or a metropolitan statistical area.
Within a PSU secon d-stage units are drawn (segments)
and w ithin each segment a sample of occupied house-
holds are selected for interview. Black and Hispanic
populations were over-sampled during these years. The
probabilities of selection, along with adjustments for
nonresponse and post-stratification, are reflected in the
sample weights [48]. Additional information is available
at />set_Documentation/NHIS/2005/srvydesc.pdf[49].
In 2002-2005, about 35,000 households were sampled
each year. In addition to the core family questionnaire that
is asked of each family member, a sample adult is selected
for additional questions on health and health care [49].
Response rates were generally high. During these data
years, information was provided for over 90% of adults
selected for the sample adult questionnaire; multiplied by
the sample family response rates of 85% to 90%, the uncon-
ditional response rate for the sample adult is about 80%.
Nachman and Parker Environmental Health 2012, 11:25
/>Page 3 of 12
We used restricted-use NHIS files geocoded to Census
block and block-group. These files are available through
the NCHS R esearch Data Center (RDC) (information
available at />Population-weighted census block-group centroids were
used as respondent locations.
There are 124,375 adults 18 years of age or older with
information for the sample adult ques tions in the 2002-
2005 NHIS. The geographical information was missing
for 922 survey respondents, and these persons were
excluded from analyses. Those residing within the 48
contiguous states at the time of the interview were
included in the analyses. Of these, missing data for one
or more of the NHIS variables described below or one
or more respiratory conditions resulted i n the inclusion
of between 109,343 - 109,485 respondents for each
outcome.
Spatial interpolation and data linkage
In the NCHS Research Data Center, Census block-group
population-weighted centroid locations of NHIS respon-
dents, described above, were used as prediction loca-
tions for estimation of annual average PM
2.5
exposure
concentrati ons and associated prediction variances. The
ordinary kriging method was used to develop predic-
tions and krige prediction variances for each respondent.
Weighted predictions of annual average PM
2.5
concen-
trations and corresponding prediction variances were
generated for each respondent using the fitted semivar-
iogram models corresponding to the NHIS interview
year. Annual average PM
2.5
concentrations were
assigned as a continuous variable for exposure measures
for survey respondents. The resulting dataset of assigned
pollution measures and variances was merged with the
dataset for NHIS survey respondents (including out-
comes and covariates, described below) to facilitate
analyses.
Respiratory health outcomes
Answers to three questions from the NHIS sample adult
questionnaire about asthma and additio nal questions
about sinusitis and chronic bronchi tis we re used as out-
comes in the study. The prevalence of chronic bronchi-
tis and sinu sitis were obtained by asking respondents
whether during the past 12 months they had been told
by a doctor or other health professional that they had
these conditions.
To be eligible to provide answers to the questions
about asthma, respondents first had to answer affirma-
tively to having been told b y a phys ician or other health
professional that they had asthma. The three follow-up
questions queried respondents as to whether they still
had asthma, had an episode of asthma or an asthma
attack within the last 12 months, or had visited the
emergency room or urgent care center due to asthma
within the last 12 months. To compare persons with
answers for these questions with persons not reporting
having asthma, additional variables were created for
each of these three measures by combining responses
from people providing non-missing values for these
measures with persons never reporting having asthma
(coded as responding “no” to these questions).
Covariates
The potential influences of other factors on respiratory
outcomes were assessed in the analyses. Respondent
race and ethnicity were cate gorized as Hispanic, non-
Hispanic black, non-Hispanic white, and other non-His-
panic r ace groups. Early exploratory analyses suggested
the possibility of heterogeneity of the effect of annual
average ambient PM
2.5
concentrations across race/ethnic
strata on respiratory outcomes. Given this, in combina-
tion with evidence of a differenti al in as thma prevalence
across race/ethnicity, this variable was examined both as
a potential confounding factor as well for purposes of
stratification to determine whether air pollution has dif-
ferential effects on r espiratory health outcomes by race/
ethnicity.
Possible health-related covariates included sex, age,
body mass index (BMI), smoking status, and exercise
status. Age was divided into categories starting with
respondents’ ages 18 to 30 and continuing with ten year
intervals up to age 60. A final category was used to
represent respondents ages 61 and above. BMI was trea-
ted categorically, with BMI < 25 representi ng norma l or
underweight, 25 ≤ BMI < 30 representing overw eight,
and BMI ≥ 30 representing obese. Respondents were
characterized as never smokers, former smokers, or cur-
rent smokers. Exercise status was treated as a binary
variable, representing either so me or no reported
exercise.
Demographic covariates (race and ethnicity, education,
and urbanicity) were also examined. Education was trea-
ted as a binary variable, representing less than twelve
years of education versus twelve or more years of educa-
tion, regardless of degrees attained; the latter group also
included respondents with a GED. The 2006 NCHS
Urban-rural Classification Scheme for Counties [50]
assigns an urbanicity rating for the 3,141 U.S. counties
and county-equivalents. The classification scheme for
the rating uses six levels for classification: large central
metr opolitan, large fringe metropolitan, medium metro-
politan, small metropolitan, micropolitan and non-core.
The six-level urbanicity rating was initially assigned to
all survey r espondents based on residential location; for
analytical purposes, respondents were subsequently
divided into one of two groups. The first group con-
sisted of persons with residences in areas described as
Nachman and Parker Environmental Health 2012, 11:25
/>Page 4 of 12
large central metropolitan, large fringe metropolitan and
medium metr opolitan; the other included persons living
in areas described as small metropolitan, micropolitan,
or non-core. In sensitivity analyses, a more detailed
categorization was used.
Covariates related to resource availability and access
to care were examined. The ratio of the respondent’ s
family income to the offici al poverty threshold was cate-
gorized into four levels of income as a percent of pov-
erty: less than 100%, 100-199%, 200-399%, and 400% or
more. Multiply imputed family income values from
NCHS imputed income files [51] were used because
income data were missing for many respondents.
Respondents were classified by health insurance status
as having private insurance, Medicaid, another type of
insurance (including Medicare), or no health insurance;
respondents with multiple coverage were assigned to
one category using the hierarchy listed above.
Statistical analyses
Logistic regression was used to evaluate the relationship
between 10 μg/m
3
increases in annual average ambient
PM
2.5
concentrations and respiratory outcomes, control-
ling for the potentially confounding effects of health and
socioeconomic covariates described above. Stratified
models were fit to determine whether air pollution had
differential effects on respiratory health outcomes by
race/ethnicity.
We conducted sensitivity analyses to examine the
robustness of our primary findings to levels of urbanicity
and insurance status as markers of data c onsistency.
Urbanicity was chosen for further analysis due to the
possible compositional differences in PM
2.5
between
more urban and less urban areas [52-54], while health
insurance was chosen for further examination due to
the possible reporting differences in respiratory out-
comes for adults with and without insurance. For these
sensitivity analyses, interaction terms between PM
2.5
and
urbanization and health insurance were examined in
logistic models for the overall sample and for race/eth-
nicity groups.
SUDAAN software was used in the regression analysis
and tabulation to control for the complex sampling
design of the NHIS. All estimates were calculated using
the survey weights unless otherwise specified. For NHIS
data post-1997, multiple imputations were performed
for the family income data, which is used in the compu-
tation of poverty level. Five sets of imputed values were
created and available on the N HIS public use data files
to allow for the a ssessment of variability caused by
imputation. See Schenker et al. (2006) [55] for detail on
the imputation methodology and analytic statistical
methods.
Results
Monitor selection and exposure estimation
Application of the specified monitoring criteria to AQS
annual monitoring data resulte d in the inclusion of 1125,
1111, 1074 and 1051 monitors for each year from 2002 to
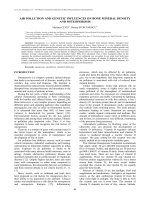
2005, respectively. Figure 1uses2002AQSmonitoring
data to visually demonstrate the spatial distribut ion of
annual average concentrations at USEPA monitoring sites.
For all four years of data, as assessed by the AIC, the expo-
nential semivariogra m model best fit the data. Results of
the leave-one-out cross-validation indicated that mean
predict ion errors for each year were less than 0.1 μg/m
3
,
and interquartile ranges of errors ranged from 1.01 to
1.70, indicating that for re-estimation of actual data, pre-
dictions tended to be within 1 μg/m
3
of the actual value.
Study population and results of statistical analyses
Table 1 summarizes study population characteristics for
the overall popu lation and for responde nts in the top
quartile of pollution concentration s by rac e/ethnicity,
including prevalence of health outcomes as well as health-
related, demographic, and socioeconomic factors. Rates
for current asthma, sinusitis, and chronic bronchitis from
the study population were very similar to rates reported by
NCHS for 2005 (7%, 13% and 4%, respectively) [56]. Table
2 compares summary statistics of the USEPA monitoring
data with those of the kriged predictions at NHIS respon-
dent locations. Results from the primary logistic regression
analyses are provided in Tables 3 and 4.
A10μg/m
3
increase in estimated ambient PM
2.5
con-
centration was not associated with asthma overall or for
Hispanic and non-Hispanic white adults. However, among
non-Hispanic black adults, we found a significant associa-
tion between PM
2.5
and asthma attacks within the last 12
months and reporting still having asthma (Table 3). We
found no association between an asthma emergency room
or urgent care visit in the prior 12 months and PM
2.5
,
either overall or for race/ethnicity subgroups (not shown).
Chronic bronchitis was not significantly related to
PM
2.5
either overall or for subgroups defined by race/
ethnicity; the odds ratio for non-Hispanic black adults
was el evated but not statistically significant (Table 4). In
contrast, sinusitis was significantly related to level of
PM
2.5
overall and among non-Hispanic white adults,
while slightly elevated but not statistically significantly
for non-Hispanic black adults (Table 4). Increased PM
2.5
was statistically significantly negatively associated with
sinusitis for Hispanic adults (Table 4).
Results of sensitivity analyses
For the mos t part, no consistent patter ns were observed
by level of urbanicity. However, we found evidence that
the relationship between PM
2.5
and both asthma
Nachman and Parker Environmental Health 2012, 11:25
/>Page 5 of 12
outcomes, still having asthma and asthma attack, among
non-Hispanic black adults is most robust in the large
central metro areas (still has asthma AOR = 1.94, 95%
CI 1.17-3.22; asthma attack AOR = 1.93, 95% CI 1.00-
3.71) and elevated, but not sig nificant, in medium metro
areas (still has asthma AOR = 2.22, 95% CI 0.92-5.41;
asthma attack AOR = 2.52, 95 % CI 0.49 -13.1) compared
to other areas. In contrast, the relationship between
PM
2.5
and sinusitis, overall and among non-Hispanic
white adults, may be stronger in less urban compared to
more urban areas (not shown). We found no consistent
impact of health insurance c overage on the relationship
between PM
2.5
and respiratory outcomes (not shown).
Discussion
The purpose of this research was to investigate the
potential relationship between annual estimates of
ambient concentrations of fine particulate matter (as
reported by USEPA Airdata) and the prevalence of self-
reported respiratory conditions from adult respondents
18 years of age and older from the NHIS. Analyses
using the gener al study population did not f ind associa-
tions between increases in fine particulate matter and
self-reported current asthma status or recent asthma
attacks, though recent report of sinusitis was found to
be significantly associated with increases in ambient
PM
2.5
concentrations. Stratified analyses performed as
part of this research suggests that, in non-Hispanic
black persons, especially those living in urban areas,
asthma-related morbidit y is associated with higher con-
centrations of fine particulate matter averaged over a
year.
It is difficult to determine whether the observed differ-
ences across raci al/ethnic strata are due to difficulties in
Figure 1 Dat a presented are from 2002 EPA monitors. (A) EPA monitoring sites, color coded for annual average PM
2.5
concentration by
quartile. (B) Scatterplot of the annual average PM
2.5
concentrations (presented in μg/m
3
) plotted against the Y-coordinates of monitor locations.
(C) Scatterplot of the annual average PM
2.5
concentrations (presented in μg/m
3
) plotted against the X-coordinates of monitor locations. (D)
Histogram of the annual average PM
2.5
concentrations (presented in μg/m
3
). For (A), blue circles denote 1st quartile of PM
2.5
concentrations,
green triangles denote 2nd quartile, yellow plus signs denote 3rd quartile, and red Xs denote 4th quartile.
Nachman and Parker Environmental Health 2012, 11:25
/>Page 6 of 12
Table 1 Percent
1
distribution of study population characteristics, overall and among those with highest quartile of
exposure, by race/ethnicity
All
2
Hispanic Non-Hispanic Black Non-Hispanic White
N = 109,485, 100% N = 16,942, 10.5%
1
N = 14,351, 10.7%
1
73,495, 73.9%
1
Health outcome Percent
1
Percent
1
Percent
1
Percent
1
Reported asthma attack in the last year 3.7 3.0 4.1 3.8
Still has asthma 7.0 5.1 8.0 7.1
Asthma ER visit in the last year 1.0 1.2 1.9 0.8
Sinusitis in the last year 14.7 8.6 14.4 16.0
Chronic bronchitis in the last year 4.3 2.7 4.4 4.6
High PM2.5 exposure
Top quartile 23.3 30.4 28.5 21.4
Sex
Female 52.6 50.7 56.3 52.4
Age group
18 to 30 22.1 32.1 26.1 19.6
31 to 40 19.1 25.1 21.0 17.8
41 to 50 20.7 18.7 21.7 20.9
51 to 60 16.0 11.2 14.3 17.1
61+ 22.0 12.9 16.8 24.6
BMI classification
Normal 39.2 32.8 29.8 40.3
Overweight 34.3 37.6 33.9 34.4
Obese 26.5 29.7 36.3 25.3
Smoking status
Current smoker 20.3 15.7 20.2 21.2
Former smoker 22.8 14.5 14.8 25.7
Never smoker 56.8 69.8 65.0 53.1
Exercise
None 35.6 47.8 45.9 32.6
Some 64.4 52.3 54.1 67.4
Education
Less than 12 years of education 13.2 36.3 17.6 9.4
12 or more years of education 86.8 63.7 82.4 90.6
Urbanicity
3
Large central metro 27.0 52.8 42.8 20.2
Large fringe metro 24.9 17.9 21.7 26.3
Medium metro 21.4 17.0 17.6 22.6
Small metro 10.1 5.5 6.3 11.6
Less urban 16.7 6.8 11.6 19.3
Percent poverty ratio
Less than 100% 10.7 20.5 20.3 7.7
100- < 200% 16.8 27.3 22.1 14.5
200- < 400% 31.4 31.0 31.0 31.8
400% or greater 41.1 21.3 26.6 46.0
Health Insurance
Private 76.0 55.2 62.6 81.0
Nachman and Parker Environmental Health 2012, 11:25
/>Page 7 of 12
classification of exposures and outcomes, physiologic
variations across race/ethnicity in response to particulate
matter, other confounding factors that were uncontrolla-
ble in the present study, or a combination of these. Even
with the ability of the NHIS to a ccount for a variety of
pertinent covariates, many of these influential factors
were only able to be addressed at a crude level in the
current study.
It is unavoidable that use of ambient monitoring data
to characterize exposure to air pollution and self-
reported morbidity data will result in measurement
error that introduces uncertainties into the interpreta-
tion of findings. Data from am bient monitors are not an
ideal surrogate for personal exposure measurements, as
ambient air is only useful in prediction of air quality in
some microenvironments. Despite this shortcoming,
relative differences in ambien t exposures across persons
may be informative for comparisons with health out-
comes. Further, ambient concentrations of PM have
been found to be highly correlated to personal expo-
sures to ambient-generated PM [57]. Consequently, resi-
dence-based non-ambient generated sources of PM
(such as environmental tobacco smoke and cooking)
and occupational sources (such as diesel exhaust) that
we were unable to account for in this study are likely to
result in non-differential misclassifications of total per-
sonal exposure to PM, ultimately biasing associations
towards the null. Further, use of annual average PM
2.5
concentrations may mask important shorter-term varia-
tionsintrueexposureprofilesrelevanttorespiratory
morbidity. While USEPA PM
2.5
data are available at
finer temporal resolut ion, the temporal nature and fre-
quency of collection of outcome data from NHIS pre-
cluded evaluation of potential r elationships at a finer
temporal scale.
Our sensitivity analyses by urbanicity were sugges-
tive of different effects across locations, but were not
definitive. Fine particulate matter is a heterogeneous
mixture that tends to vary in constituency over time
and across space [58]. Given the nature of the expo-
sure and outcome measurements used in this study,
theabilitytoevaluatetheinfluenceoftemporal
changes in (or seasonality of) PM
2.5
species was lim-
ited. It has been shown in a variety of locales that the
composition of fine particulate matter varies between
urban and rural settings [52-54], potentially as a func-
tion of particulate sources [59]. The composition of
fine particulate matter in urban settings has been
shown to be higher in elemental car bon (EC) co ntent
[54], an in dicator of diesel exhaust [60] that has bee n
shown to adversely influence indicators o f respiratory
capacity in the general population [61] and in asth-
matics [62]. Variability in particulate composition
across these settings, especially of constituents known
to exacerbate asthma, may help explain our finding of
stronger relationships b etween PM
2.5
exposure and
reporting asthma outcomes in urban settings. There is
also suggestive evidence that urban residence, inde-
pendent of rac e and income, predicts asthma m orbid-
ity [63,64].
Table 2 Summary statistics for EPA monitoring data and kriged predictions at NHIS survey respondent locations,
overall and by race/ethnicity
Monitoring data
1
(μg/m
3
PM
2.5
) Predictions (μg/m
3
PM
2.5
)
All
2
Hispanic Non-Hispanic White Non-Hispanic Black
Min 1.0 4.8 5.2 4.8 5.8
1st quartile 9.8 10.3 9.5 10.3 11.9
Median 12.2 12.6 12.1 12.4 13.4
Mean 12.1 12.4 12.5 12.2 13.2
3rd quartile 14.4 14.4 14.9 14.3 14.7
Max 27.5 24.7 24.7 24.7 24.6
1
Summary statistics presented are for 2002 monitoring dat a
2
Includes adults who reported other race/ethnicity groups
Table 1 Percent
1
distribution of study population characteristics, overall and among those with highest quartile of
exposure, by race/ethnicity (Continued)
Medicaid 7.5 15.4 16.0 5.0
Other 8.0 6.7 10.3 8.0
Uninsured 8.5 22.8 11.1 6.0
1
All pe rcents estimated using survey weights
2
Includes adults who reported other race/ethnicity groups
3
Described in text
Nachman and Parker Environmental Health 2012, 11:25
/>Page 8 of 12
The outcomes data used in this assessment also
require careful consideration. Self-reported health preva-
lence data are subject to information biases that may be
differential across a variety of factors. Interpretation of
these data as prevalence of health outcomes is compli-
cated by the fact that some survey questions query
whether a health professional has informed the respon-
dent that he or she has the outcome of interest. Such a
query inher ently makes assumptions about the respon-
dent’ s r esources to acquire health care that may be
faulty and ultimately lead to an underreporting of health
outcomes. Further, diagnosis-related difficulties for
asthma stemming from the lack of a definitive clinical
test and issues with consistency across health practi-
tioners to non-specific case definitions may result in
inaccurate identification of cases [19,65]. Beyond diag-
nosis-related issues are co ncerns related to specificity of
the outcomes. In particular, the asthma attack query
requires subjec tive judgment. Is an exacerbation of
symptoms that is quickly remedied by use of asthma
medication considered to be an attack? Or is there some
symptomatic severity threshold that constitutes an
asthma attack? Misclassification of outcomes may intro-
duce bias into the as sessment of association, though the
direction of the bias (if any) is difficult to predict.
Given the dependence of the outcomes on physician
diagnoses, analyses were p erformed to determine model
sensitivity to stratification by health insurance type;
these analyses found stratum-specific effect estimate
magnitudes to be stable for both asthma outcomes.
Racial disparities in asthma-related hospitalization and
mortality among children have been repeatedly identi-
fied in the literature [66], though fa r fewer evaluations
of potential disparities among adults have been pub-
lished. An analysis of NHIS asthma prevalence data
from 1980 to 2004 reported varying disparities in
asthma prevalence between blacks and whites by age
group, with a five percent difference in children and less
than a single percent difference in adults [19]. Hasselk-
orn et al. (2008) [67] found that, as compared to whites,
an increase in asthma control problems among black
persons persisted after controlling for factors related to
demographics, asthma severity and co-morbidities. Few
studies of gene associations have been performed among
persons of African ancestry [68], though existing
research has suggested variability in genetic pathogen-
esis of asthma across racial/ethnic groups [22]. However,
in a review of racial disparities in asthma prevalence,
Wright and Subramanian (2007) argued that t he simul-
taneously growing disparities and increases in asthma
prevalence and severity over the past twenty to thirty
years are evidence against this variability being the most
important factor in asthma pathogenesis, suggesting that
genetic shifts capable of these observed differences
would be unlikely in such a short time period. Instead,
the authors argue that gene-environment interactions
are likely strong factors in the observed changes in
asthma burden [69]; accordingly, an underlying genetic
susceptibility to asthma development may help explain
observed differences that were not able to be explained
solely by variations in exposures to environmental pollu-
tion. Race/ethnic differences in distributions of atopy
have been observed [70], and climate-related factors spe-
cific to geographic areas have been demonstrated to
interact with exposu re to air pollution in predictio n of
asthma and allergi c rhini tis [71], suggesting the possible
cumulative contribution of allergy and regional climate
variation to the observed differences. This assertion may
provide support for our finding of increased susceptibil-
ity of non-Hisp anic black respondents to asthma-related
outcomes as a result of higher exposures to PM
2.5
.
One limitation of this study is its lack of abili ty to
draw inference s regarding the relationship between PM
exposure and asthma outcomes in Hispanic persons.
Research has shown that the Hispanic race/ethnicity
group is comprised of persons of varied backgrounds,
Table 3 Adjusted
1
odds ratios (95% confidence intervals)
for 10 μg/m
3
increase in ambient PM
2.5
concentration
and asthma outcomes, overall and stratified by race/
ethnicity
Asthma attack in past year Still has asthma
Race/ethnicity AOR (95% CI)
All
2
0.90 (0.78 - 1.03) 0.97 (0.87 - 1.07)
Hispanic 0.99 (0.73 - 1.34) 1.10 (0.85 - 1.43)
Non-Hispanic White 0.85 (0.72 - 1.01) 0.92 (0.81 - 1.04)
Non-Hispanic Black 1.76 (1.07 - 2.91)* 1.73 (1.17 - 2.56)**
* p < 0.05, ** p < 0.01
1
Adjusted for sex, age group, smoking status, urbanicity, health insurance
type, education, income, body mass index and exercise. Models for All include
adjustment for race/ethnicity
2
Included adults who reported other race/ethnicity groups
Table 4 Adjusted
1
odds ratios (95% confidence intervals)
for 10 μg/m
3
increase in ambient PM
2.5
concentration
and other respiratory outcomes, overall and stratified by
race/ethnicity
Sinusitis Chronic bronchitis
Race/ethnicity AOR (95% CI)
All
2
1.18 (1.08 - 1.30)** 1.08 (0.94 - 1.24)
Hispanic 0.76 (0.62 - 0.94)* 0.88 (0.67 - 1.16)
Non-Hispanic White 1.31 (1.18 - 1.46)** 1.10 (0.93 - 1.29)
Non-Hispanic Black 1.17 (0.91 - 1.50) 1.50 (0.96 - 2.36)
*p < 0.05, ** p < 0.01
1
Adjusted for sex, age group, smoking status, urbanicity, health insurance
type, education, income, body mass index and exercise. Models for All include
adjustment for race/ethnicity.
2
Included adults who reported other race/ethnicity groups .
Nachman and Parker Environmental Health 2012, 11:25
/>Page 9 of 12
and that rates of asthma within these subgroups are
highly inconsistent [72,73]. The collapsing of these mul-
tiple subgroups with different rates of asthma into a sin-
gle race/ethnic stratum is likely to obscure our ability to
capture any potential effect of PM on the studied
outcomes.
In addition to PM, nitrogen dioxide, ozone, an d sulfur
dioxide are criteria pollutants that have also been
demonstrated to have an effect on asthmatics [74,75].
The robustness of the USEPA AQS PM
2.5
monitoring
network and the spatially ho mogenous nature of parti-
culate matter made possible the kriging of a nnual con-
centrations to allow for exposure estimations for
participants with residences further away from moni-
tored locations. However, the characteristics of the AQS
monitoring network size and data collection schedule, as
well as the spatial representativeness of monitored con-
centrations of these other pollutants precluded their
estimation at respondent locations and subsequent
inclusion as covari ates in our models. Similarly, some
non-criteria hazardous air pollutants have also been sus-
pected to be influential in t he development and exacer-
bation of asthma [76], but monitoring networks for
these toxics are typically more limited than those for
criteria pollutants and may not support prediction of
exposure for NHIS respondents. It is not possible to
predict the influence of the exclusion of these pollutants
from our investigation; future study is warran ted to
delineate the potential joint contributions of ambie nt air
contaminants.
The social environment has been demonstrated to be
an influential factor in the exacerbation of asthma and
severity of asthma attacks [77], and evidence i n adoles-
cents and young adults exists to suggest that stress may
alter or induce asthma-related immune respon se [78-80].
Recent literature has identified the potential for interac-
tion between environmental and social stressors in caus-
ing morbidity [81,82]. Chen et al. (2008) [83] evaluated
the interaction between exposures to traffic-related air
pollution and chronic family stress in exacerbation of
asthma, and found that in children exposed to relatively
lowe r levels of air pollution, high levels of chro nic fami ly
stress increased child- and parent-reported asthma symp-
toms and reduced clinical measures of respiratory capa-
city. More recently, researchers have used genomic
methods to determine that genes relevant to a sthma-
related inflammatory mechanisms were overexpressed in
children of lower socioeconomic standing [84]. Measures
of these factors were unavailable in the NHIS, though an
attempt was made to account for this through adjust-
ment for urbanicity, educatio n and poverty ratio. Despite
this, it is likely that the effect esti mates are influenced by
residual confounding and are likely attenuated.
Conclusions
Using two linked national datasets and stratified ana-
lyses, we found compelling evidence in support of the
relationship between increases in ambient PM
2.5
and
asthma outcomes in non-Hispanic black adults. In addi-
tion, we identified a relationship between increased fine
particulate exposure and the development of sinusitis
among al l adults. Given that non-Hispanic blac k adults
suffer greater morbidity and mortality from asthma than
other groups, and consequently attribute greater medical
costs from asthma, further investigation is warra nted to
better explain the apparent racial/ethnic disparity in
asthma prevalence.
Abbreviations
AIC: Akaike Information Criterion; AOR: Adjusted Odds Ratio; AQS: Air Quality
System (USEPA database); BMI: Body mass index; EC: Elemental carbon; MSA:
Metropolitan statistical area; NCHS: National Center for Health Statistics; NHIS:
National Health Interview Survey; PM
2.5
: Particulate matter less than or equal
to
2.5
microns in diameter; PSU: Primary sampling unit; RDC: NCHS Research
Data Center; USEPA: United States Environmental Protection Agency.
Acknowledgements
This research was conducted while the corresponding author (KEN) was a
postdoctoral fellow in the National Center for Environmental Economics at
the US Environmental Protection Agency. The findings and conclusions in
this paper are those of the authors and do not necessarily represent the
views of the National Center for Health Statistics or the Centers for Disease
Control and Prevention.
Author details
1
Department of Environmental Health Sciences, Johns Hopkins Bloomberg
School of Public Health, Baltimore, MD, USA.
2
National Center for Health
Statistics, Centers for Disease Control and Prevention, Hyattsville, MD, USA.
Authors’ contributions
KEN was responsible for co-development of concept, cleaning, management,
analysis and interpretation of data, and drafting the manuscript. JDP was
responsible for co-development of concept, advising on analysis,
interpretation and presentation of data, and assistance in drafting
manuscript. Both authors read and approved the final manuscript.
Competing interests
The authors declare that they have no competing interests.
Received: 14 October 2011 Accepted: 10 April 2012
Published: 10 April 2012
References
1. Bell ML, Ebisu K, Belanger K: Ambient air pollution and low birth weight
in Connecticut and Massachusetts. Environ Health Perspect 2007,
115:1118-1124.
2. Sørensen M, Autrup H, Møller P, Hertel O, Jensen SS, Vinzents P,
Knudsen LE, Loft S: Linking exposure to environmental pollutants with
biological effects. Mutat Res Rev Mutat Res 2003, 544:255-271.
3. Thurston GD, Bekkedal MY, Roberts EM, Ito K, Pope CA, Glenn BS,
Ozkaynak H, Utell MJ: Use of health information in air pollution health
research: past successes and emerging needs. J Expo Sci Environ
Epidemiol 2009, 19:45-58.
4. Zanobetti A, Schwartz J: The effect of fine and coarse particulate air
pollution on mortality: a national analysis. Environ Health Perspect 2009,
117:898-903.
5. Pope CA, Dockery DW: Health effects of fine particulate air pollution:
lines that connect. J Air Waste Manag Assoc 2006, 56:709-742.
Nachman and Parker Environmental Health 2012, 11:25
/>Page 10 of 12
6. Pope CA, Ezzati M, Dockery DW: Fine-particulate air pollution and life
expectancy in the United States. N Engl J Med 2009, 360:376-386.
7. Woodruff TJ, Darrow LA, Parker JD: Air pollution and postneonatal infant
mortality in the United States, 1999-2002. Environ Health Perspect 2008,
116:110-115.
8. Sun Q, Hong X, Wold LE: Cardiovascular effects of ambient particulate air
pollution exposure. Circulation 2010, 121:2755-2765.
9. McConnell R, Berhane K, Gilliland F, London SJ, Vora H, Avol E,
Gauderman WJ, Margolis HG, Lurmann F, Thomas DC, Peters JM: Air
pollution and bronchitic symptoms in Southern California children with
asthma. Environ Health Perspect 1999, 107:757-760.
10. Gauderman WJ, Avol E, Gilliland F, Vora H, Thomas D, Berhane K,
McConnell R, Kuenzli N, Lurmann F, Rappaport E, Margolis H, Bates D,
Peters J: The effect of Air pollution on lung development from 10 to 18
years of Age. New Engl J Med 2004, 351:1057-1067.
11. Dockery DW, Cunningham J, Damokosh AI, Neas LM, Spengler JD,
Koutrakis P, Ware JH, Raizenne M, Speizer FE: Health effects of acid
aerosols on North American children: respiratory symptoms. Environ
Health Perspect 1996, 104:500-505.
12. Peters JM, Avol E, Navidi W, London SJ, Gauderman WJ, Lurmann F,
Linn WS, Margolis H, Rappaport E, Gong H, Thomas DC: A study of twelve
Southern California communities with differing levels and types of air
pollution. I. Prevalence of respiratory morbidity. Am J Respir Crit Care Med
1999, 159:760-767.
13. Raizenne M, Neas LM, Damokosh AI, Dockery DW, Spengler JD, Koutrakis P,
Ware JH, Speizer FE: Health effects of acid aerosols on North American
children: pulmonary function. Environ Health Perspect 1996, 104:506-514.
14. Schwartz J: Particulate air pollution and chronic respiratory disease.
Environ Res 1993, 62:7-13.
15. Chestnut LG, Schwartz J, Savitz DA, Burchfiel CM: Pulmonary function and
ambient particulate matter: epidemiological evidence from NHANES I.
Arch Environ Health 1991, 46:135-144.
16. Bennett CM, Simpson P, Raven J, Skoric B, Powell J, Wolfe R, Walters EH,
Abramson MJ: Associations between ambient PM
2.5
concentrations and
respiratory symptoms in Melbourne, 1998-2005. J Toxicol Environ Health
2007, 70:1613-1618.
17. Schwartz J: Lung function and chronic exposure to air pollution: a cross-
sectional analysis of NHANES II. Environ Res 1989, 50:309-321.
18. Pleis JR, Lucas JW: Summary health statistics for U.S. adults: National
Health Interview Survey, 2007. Vital Health Stat 2009, 10:1-159.
19. Moorman JE, Rudd RA, Johnson CA, King M, Minor P, Bailey C, Scalia MR,
Akinbami LJ: National surveillance for asthma-United States, 1980-2004.
MMWR Surveill Summ 2007, 56:1-54.
20. Bryant-Stephens T: Asthma disparities in urban environments. J Allergy
Clin Immunol 2009, 123:1199-1206.
21. Akinbami L: The state of childhood asthma, United States, 1980-2005.
Adv Data 2006, 381:1-24.
22. Gupta RS, Springston EE, Weiss KB: Eliminating asthma disparities: is there
evidence of progress? Curr Opin Pulm Med 2009, 15:72-78.
23. Akinbami LJ, Moorman JE, Garbe PL, Sondik EJ: Status of childhood
asthma in the United States, 1980-2007. Pediatrics 2009, 123:S131-145.
24. Getahun D, Demissie K, Rhoads GG: Recent trends in asthma
hospitalization and mortality in the United States. J Asthma 2005,
42:373-378.
25. Gupta RS, Carrion-Carire V, Weiss KB: The widening black/white gap in
asthma hospitalizations and mortality. J Allergy Clin Immunol 2006,
117:351-358.
26. Hackbarth AD, Romley JA, Goldman DP: Racial and ethnic disparities in
hospital care resulting from air pollution in excess of federal standards.
Soc Sci Med 2011, 73:1163-1168.
27. Morello-Frosch R, Zuk M, Jerrett M, Shamasunder B, Kyle AD:
Understanding the cumulative impacts of inequalities in environmental
health: implications for policy. Heal Aff 2011, 30:879-887.
28. Woodruff TJ, Parker JD, Kyle AD, Schoendorf KC: Disparities in exposure to
air pollution during pregnancy. Environ Health Perspect 2003, 111:942-946.
29. Morello-Frosch R, Lopez R: The riskscape and the color line: examining
the role of segregation in environmental health disparities. Environ Res
2006, 102:181-196.
30. Daniels G, Friedman S: Spatial inequality and the distribution of industrial
toxic releases: Evidence from the 1990 TRI. Soc Sci Q (University of Texas
Press) 1999, 80
:244.
31.
Kramer MR, Hogue CR: Is segregation Bad for your health? Epidemiologic
Reviews 2009, 31:178-194.
32. Grineski SE, Staniswalis JG, Peng Y, Atkinson-Palombo C: Children’s asthma
hospitalizations and relative risk due to nitrogen dioxide (NO2): Effect
modification by race, ethnicity, and insurance status. Environ Res 2010,
110:178-188.
33. McGeehin MA: National environmental public health tracking program:
providing data for sound public health decisions. J Public Health Manag
Pract 2008, 14:505-506.
34. Environmental Public Health Tracking Team: America’s Environmental
Health Gap: Why the Country Needs a Nationwide Health Tracking
Network. Baltimore, MD: Johns Hopkins School of Hygiene and Public
Health; 2000.
35. Ozkaynak H, Glenn B, Qualters JR, Strosnider H, McGeehin MA, Zenick H:
Summary and findings of the EPA and CDC symposium on air pollution
exposure and health. J Expo Sci Environ Epidemiol 2009, 19:19-29.
36. Slama R, Darrow L, Parker J, Woodruff TJ, Strickland M, Nieuwenhuijsen M,
Glinianaia S, Hoggatt KJ, Kannan S, Hurley F, Kalinka J, Sram R, Brauer M,
Wilhelm M, Heinrich J, Ritz B: Meeting report: atmospheric pollution and
human reproduction. Environ Health Perspect 2008, 116:791-798.
37. Basu R, Woodruff TJ, Parker JD, Saulnier L, Schoendorf KC: Comparing
exposure metrics in the relationship between PM
2.5
and birth weight in
California. J Expo Anal Environ Epidemiol 2004, 14:391-396.
38. Ostro BD, Rothschild S: Air pollution and acute respiratory morbidity: an
observational study of multiple pollutants. Environ Res 1989, 50:238-247.
39. Parker JD, Kravets N, Woodruff TJ: Linkage of the National Health
Interview Survey to air quality data. Vital Health Stat 2008, 145:1-24.
40. Kravets N, Parker JD: Linkage of the Third National Health and Nutrition
Examination Survey to Air Quality Data. Vital Health Stat 2008, 149:1-24.
41. Schwartz J: Air pollution and blood markers of cardiovascular risk. Environ
Health Perspect 2001, 109(Suppl 3):405-409.
42. Ostro BD: Air pollution and morbidity: a sensitivity analysis of alternative
monitors, pollutants, and averaging times. Sci Total Environ 1984,
39:111-124.
43. Ostro BD: Estimating the risks of smoking, air pollution, and passive
smoke on acute respiratory conditions. Risk Anal 1989, 9 :189-196.
44. Henshaw SL, Curriero FC, Shields TM, Glass GE, Strickland PT, Breysse PN:
Geostatistics and GIS: tools for characterizing environmental
contamination. J Med Syst 2004, 28:335-348.
45. AirData | US EPA. [ />46. Ribeiro P Jr, Diggle P: geo{R}: a package for geostatistical analysis. R-NEWS
2001, 1/2:15-18.
47. R Development Core Team: R: A language and environment for statistical
computing. Vienna, Austria: R Foundation for Statistical Computing;, 2.6.2
2008.
48. Botman SL: Design and estimation for the National Health Interview
Survey, 1995-2004. Hyattsville, Md: Public Health Service, Centers for Disease
Control and Prevention, National Center for Health Statistics 2000.
49. NHIS Survey Description. [ />Dataset_Documentation/NHIS/2005/srvydesc.pdf].
50. NCHS Urban-rural Classification Scheme for Counties. 2006 [http://www.
cdc.gov/nchs/data_access/urban_rural.htm].
51. Schenker N, Raghunathan T, Chiu P-L, Makuc D, Zhang G, Cohen A:
Multiple imputation of family income and personal earnings in the
National Health Interview Survey: methods and examples. Hyattsville, MD:
Centers for Disease Control and Prevention, National Center for Health
Statistics 2005.
52. Hueglin C, Gehrig R, Baltensperger U, Gysel M, Monn C, Vonmont H:
Chemical characterisation of PM2.5, PM10 and coarse particles at urban,
near-city and rural sites in Switzerland. Atmos Environ 2005, 39:637-651.
53. Rodríguez S, Querol X, Alastuey A, Viana M-M, Alarcón M, Mantilla E,
Ruiz CR: Comparative PM10-PM2.5 source contribution study at rural,
urban and industrial sites during PM episodes in Eastern Spain. Sci Total
Environ
2004, 328:95-113.
54.
Tanner RL, Parkhurst WJ, Valente ML, David Phillips W: Regional
composition of PM2.5 aerosols measured at urban, rural and
“background” sites in the Tennessee valley. Atmos Environ 2004,
38:3143-3153.
55. Schenker N, Raghunathan TE, Chiu P-L, Makuc DM, Zhang G, Cohen AJ:
Multiple imputation of missing income data in the national health
interview survey. J Am Stat Assoc 2006, 101:924-933.
Nachman and Parker Environmental Health 2012, 11:25
/>Page 11 of 12
56. Pleis JR, Lethbridge-Çejku M: Summary health statistics for U.S. adults:
National health interview survey, 2005. Vital Health Stat 10 2006,
232:1-153.
57. Wilson WE, Mage DT, Grant LD: Estimating separately personal exposure
to ambient and nonambient particulate matter for epidemiology and
risk assessment: why and how. J Air Waste Manag Assoc 2000,
50:1167-1183.
58. Bell ML, Dominici F, Ebisu K, Zeger SL, Samet JM: Spatial and temporal
variation in PM(
2.5
) chemical composition in the United States for health
effects studies. Environ Health Perspect 2007, 115:989-995.
59. Liu W, Wang Y, Russell A, Edgerton ES: Atmospheric aerosol over two
urban-rural pairs in the southeastern United States: Chemical
composition and possible sources. Atmospheric Environment 2005,
39:4453-4470.
60. Gauderman WJ, Vora H, McConnell R, Berhane K, Gilliland F, Thomas D,
Lurmann F, Avol E, Kunzli N, Jerrett M, Peters J: Effect of exposure to
traffic on lung development from 10 to 18 years of age: a cohort study.
Lancet 2007, 369:571-577.
61. Franco Suglia S, Gryparis A, Schwartz J, Wright RJ: Association between
traffic-related black carbon exposure and lung function among urban
women. Environ Health Perspect 2008, 116:1333-1337.
62. McCreanor J, Cullinan P, Nieuwenhuijsen MJ, Stewart-Evans J, Malliarou E,
Jarup L, Harrington R, Svartengren M, Han IK, Ohman-Strickland P,
Chung KF, Zhang J: Respiratory effects of exposure to diesel traffic in
persons with asthma. N Engl J Med 2007, 357:2348-2358.
63. Aligne CA, Auinger P, Byrd RS, Weitzman M: Risk factors for pediatric
asthma. Contributions of poverty, race, and urban residence. Am J Respir
Crit Care Med 2000, 162:873-877.
64. Byrd RS, Joad JP: Urban asthma. Curr Opin Pulm Med 2006, 12:68-74.
65. Drake KA, Galanter JM, Burchard EG: Race, ethnicity and social class and
the complex etiologies of asthma. Pharmacogenomics 2008, 9:453-462.
66. Akinbami LJ, Schoendorf KC: Trends in childhood asthma: prevalence,
health care utilization, and mortality. Pediatrics 2002, 110:315-322.
67. Haselkorn T, Lee JH, Mink DR, Weiss ST: Racial disparities in asthma-
related health outcomes in severe or difficult-to-treat asthma. Ann Allergy
Asthma Immunol 2008, 101:256-263.
68. Scirica CV, Celedon JC: Genetics of asthma: potential implications for
reducing asthma disparities. Chest 2007, 132:770S-781S.
69. Wright RJ, Subramanian SV: Advancing a multilevel framework for
epidemiologic research on asthma disparities. Chest 2007, 132:757S-769S.
70. Yang JJ, Burchard EG, Choudhry S, Johnson CC, Ownby DR, Favro D,
Chen J, Akana M, Ha C, Kwok P-Y, Krajenta R, Havstad SL, Joseph CL,
Seibold MA, Shriver MD, Williams LK: Differences in allergic sensitization
by self-reported race and genetic ancestry. J Allergy Clin Immunol 2008,
122:820-827, e829.
71. De Marco R, Poli A, Ferrari M, Accordini S, Giammanco G, Bugiani M,
Villani S, Ponzio M, Bono R, Carrozzi L, Cavallini R, Cazzoletti L, Dallari R,
Ginesu F, Lauriola P, Mandrioli P, Perfetti L, Pignato S, Pirina P, Struzzo P:
The impact of climate and traffic-related NO2 on the prevalence of
asthma and allergic rhinitis in Italy. Clinical & Experimental Allergy 2002,
32:1405-1412.
72. Dumanovsky T, Matte TD: Variation in adult asthma prevalence in
Hispanic subpopulations in New York City. J Asthma 2007, 44:297-303.
73. Hunninghake GM, Weiss ST, Celedon JC: Asthma in Hispanics. Am J Respir
Crit Care Med 2006, 173:143-163.
74. Jerrett M, Shankardass K, Berhane K, Gauderman WJ, Kunzli N, Avol E,
Gilliland F, Lurmann F, Molitor JN, Molitor JT, Thomas DC, Peters J,
McConnell R: Traffic-related air pollution and asthma onset in children: a
prospective cohort study with individual exposure measurement. Environ
Health Perspect 2008, 116:1433-1438.
75. Koren HS: Associations between criteria air pollutants and asthma.
Environ Health Perspect 1995, 103(Suppl 6):235-242.
76. Delfino RJ: Epidemiologic evidence for asthma and exposure to air
toxics: linkages between occupational, indoor, and community air
pollution research. Environ Health Perspect 2002, 110(Suppl 4):573-589.
77. Chen E, Schreier HM: Does the social environment contribute to asthma?
Immunol Allergy Clin North Am 2008, 28:649-664, x.
78. Liu LY, Coe CL, Swenson CA, Kelly EA, Kita H, Busse WW: School
examinations enhance airway inflammation to antigen challenge. Am J
Respir Crit Care Med 2002, 165:1062-1067.
79. Kang DH, Coe CL, McCarthy DO, Ershler WB: Immune responses to final
exams in healthy and asthmatic adolescents. Nurs Res 1997, 46:12-19.
80. Kang DH, Fox C: Th1 and Th2 cytokine responses to academic stress. Res
Nurs Health 2001, 24:245-257.
81. Morello-Frosch R, Shenassa ED: The environmental “riskscape” and social
inequality: implications for explaining maternal and child health
disparities. Environ Health Perspect 2006, 114:1150-1153.
82. Gee GC, Payne-Sturges DC: Environmental health disparities: a framework
integrating psychosocial and environmental concepts. Environ Health
Perspect 2004, 112:1645-1653.
83. Chen E, Schreier HM, Strunk RC, Brauer M: Chronic traffic-related air
pollution and stress interact to predict biologic and clinical outcomes in
asthma. Environ Health Perspect 2008, 116:970-975.
84. Chen E, Miller GE, Walker HA, Arevalo JM, Sung CY, Cole SW: Genome-wide
transcriptional profiling linked to social class in asthma. Thorax 2009,
64:38-43.
doi:10.1186/1476-069X-11-25
Cite this article as: Nachman and Parker: Exposures to fine particulate
air pollution and respiratory outcomes in adults using two national
datasets: a cross-sectional study. Environmental Health 2012 11:25.
Submit your next manuscript to BioMed Central
and take full advantage of:
• Convenient online submission
• Thorough peer review
• No space constraints or color figure charges
• Immediate publication on acceptance
• Inclusion in PubMed, CAS, Scopus and Google Scholar
• Research which is freely available for redistribution
Submit your manuscript at
www.biomedcentral.com/submit
Nachman and Parker Environmental Health 2012, 11:25
/>Page 12 of 12