Traffic air pollution and mortality from cardiovascular disease and all causes: a Danish cohort study doc
Bạn đang xem bản rút gọn của tài liệu. Xem và tải ngay bản đầy đủ của tài liệu tại đây (372.71 KB, 12 trang )
Raaschou-Nielsen et al. Environmental Health 2012, 11:60
/>
RESEARCH
Open Access
Traffic air pollution and mortality from
cardiovascular disease and all causes: a Danish
cohort study
Ole Raaschou-Nielsen1*, Zorana Jovanovic Andersen1,2, Steen Solvang Jensen3, Matthias Ketzel3, Mette Sørensen1,
Johnni Hansen1, Steffen Loft4, Anne Tjønneland1 and Kim Overvad5
Abstract
Background: Traffic air pollution has been linked to cardiovascular mortality, which might be due to co-exposure
to road traffic noise. Further, personal and lifestyle characteristics might modify any association.
Methods: We followed up 52 061 participants in a Danish cohort for mortality in the nationwide Register of Causes
of Death, from enrollment in 1993–1997 through 2009, and traced their residential addresses from 1971 onwards in
the Central Population Registry. We used dispersion-modelled concentration of nitrogen dioxide (NO2) since 1971
as indicator of traffic air pollution and used Cox regression models to estimate mortality rate ratios (MRRs) with
adjustment for potential confounders.
Results: Mean levels of NO2 at the residence since 1971 were significantly associated with mortality from
cardiovascular disease (MRR, 1.26; 95% confidence interval [CI], 1.06–1.51, per doubling of NO2 concentration) and
all causes (MRR, 1.13; 95% CI, 1.04–1.23, per doubling of NO2 concentration) after adjustment for potential
confounders. For participants who ate < 200 g of fruit and vegetables per day, the MRR was 1.45 (95% CI, 1.13–1.87)
for mortality from cardiovascular disease and 1.25 (95% CI, 1.11–1.42) for mortality from all causes.
Conclusions: Traffic air pollution is associated with mortality from cardiovascular diseases and all causes, after
adjustment for traffic noise. The association was strongest for people with a low fruit and vegetable intake.
Keywords: Traffic, Air pollution, Cardiovascular mortality, Total mortality, Cohort
Background
Although several recent studies have shown associations
between long-term exposure to traffic-related air pollution and mortality from cardiovascular disease and all
causes [1-9], several questions remain open. Exposure to
road traffic noise might explain the observed associations,
as this has been associated with morbidity and mortality
from cardiovascular disease [10]. Furthermore, air pollution could affect the risk for cardiovascular disease
through mechanisms involving systemic oxidative stress
and inflammation, which could drive atherosclerosis progression and other long-term effects as well as serve as
triggers of events through changes in vascular function,
thrombogenecity, plaque stability and autonomic balance
* Correspondence:
1
Danish Cancer Society Research Center, Copenhagen, Denmark
Full list of author information is available at the end of the article
[11]; the amount of fruit and vegetables in the diet,
containing antioxidants and related compounds, might
therefore modify the effect of air pollution as suggested
for short-term mortality in a case-crossover study in
Hongkong [12]. People with pre-existing cardiovascular
disease or diabetes mellitus might be particularly susceptible to the effects of air pollution on cardiovascular
mortality. Exposure to air pollution decades back in time
and perhaps throughout life might be important in the
development of chronic cardiovascular disease [13]. Most
previous studies of long-term exposure, however, have
focused on the addresses of participants at baseline, and
few studies have investigated exposure assessed from
address history [4,6,14,15].
We report here the results of a Danish cohort study of
the a-priori hypothesis that mortality from cardiovascular disease and all causes is associated with long-term
© 2012 Raaschou-Nielsen et al.; licensee BioMed Central Ltd. This is an Open Access article distributed under the terms of the
Creative Commons Attribution License ( which permits unrestricted use,
distribution, and reproduction in any medium, provided the original work is properly cited.
Raaschou-Nielsen et al. Environmental Health 2012, 11:60
/>
exposure to traffic-related air pollution at the residence,
derived from residential histories from 1971 onwards.
Road traffic noise and other potential confounders were
adjusted for, and possible effect modification by personal
and lifestyle characteristics was investigated.
Methods
Design and study participants. Between 1993 and 1997, a
population-based sample of 57 053 men (48%) and women
(52%) aged 50–64 years and living in the Copenhagen and
Aarhus areas, born in Denmark and with no previous
cancer diagnosis, were enrolled into the Diet, Cancer and
Health cohort study [16]. The examination at baseline, i.e.
enrollment, included a self-administered questionnaire on
average dietary habits over the last year, which covered
192 food and beverage items. The participants also filled
in a questionnaire on smoking habits (status, intensity and
duration), occupation, length of school attendance,
physical activity, history of diseases and medication, and a
number of other health-related items [16]. Staff in the
study clinics obtained anthropometric measurements,
including height and weight. The average gross income in
the municipality of residence at the time of enrollment
was provided by Statistics Denmark. Relevant Danish
ethical committees and data protection agencies approved
the study, and written informed consent was obtained
from all participants.
Each cohort member was followed up for death,
including date and underlying cause, from cardiovascular
disease (ICD-10 codes I00–I99), from the date of inclusion into the cohort until 31 December 2009 in the
Danish Register of Causes of Death, by use of the unique
personal identification number [17]. Participants who
died of external causes (ICD-10 codes S–Z) were
censored at the date of death. We extracted the date of
emigration or disappearance and the addresses of all
cohort members between 1 January 1971 and 31 December
2009 from the Central Population Registry by use of the
personal identification number, including the dates of
moving to and from each address. The addresses were
linked to the Danish address database to obtain geographical coordinates (‘geocodes’), which were obtained for 94%
of the addresses.
Exposure assessment. The outdoor concentration of
nitrogen dioxide (NO2) was calculated at the residential
addresses of each cohort member with the Danish AirGIS
dispersion modeling system (see />air/models/airgis/). AirGIS is based on a geographical
information system (GIS) and provides estimates of
traffic-related air pollution with high temporal and
address-level spatial resolution. Air pollution at a location
was calculated as the sum of: (1) local air pollution from
street traffic, calculated from traffic (intensity and type),
emission factors for the car fleet, street and building
Page 2 of 12
geometry and meteorology; (2) urban background, calculated from data on urban vehicle emission density, city
dimensions and building heights; and (3) regional background, estimated from trends at rural monitoring stations and from national vehicle emissions. With the
geocode of an address and a specified year as the starting
point, the AirGIS system automatically generates street
configuration data for the street pollution model, including street orientation, street width, building heights in
wind sectors, amount of traffic, speed and type as well as
other required data.
The AirGIS system has been validated in several studies
[18-21], and the correlation between modelled and
measured half-year mean NO2 concentrations at 204
positions in the greater Copenhagen area showed a
correlation coefficient of 0.90, measured concentrations
being on average 11% lower than those modelled [20].
We also compared modelled and measured 1-month
mean concentrations of NOx and NO2 over 12 years
(1995–2006) on a busy street in Copenhagen (Jagtvej, 25
000 vehicles per day, street canyon), with correlation coefficients of 0.88 for NOx and 0.67 for NO2. The modelled
mean concentration over the whole 12-year period was
6% lower than the measured concentrations of NOx and
12% lower than those of NO2[21]. Thus, the model
predicted both geographical and temporal variation well.
We used the concentration of NO2 as an indicator of
air pollution from traffic. We calculated the yearly
averages of NO2 concentration at all addresses from 1
January 1971 until date of death, censoring or end of
follow-up and entered time-weighted average NO2 concentration from 1971 as a time-dependent variable into
the statistical risk model, thus recalculating exposure for
survivors at the time of each death. If an address could
not be geocoded, the preceding address was used for
NO2 calculation; if the first address was missing, the
subsequent address was used. We included only participants for whom the residential addresses were known
and geocoded for 80% or more of the time from 1 January
1971 to death, censoring or end of follow-up.
Potential confounders and effect modifiers. We defined
potential confounding factors a priori from evidence of an
association with mortality and modeled them as categorical
or continuous. The continuous variables were modeled as
linear or a non-linear cubic spline function. The covariates,
assessed at baseline, were: sex; calendar year (spline); unemployment during year before enrollment (yes/no); length
of school attendance (< 8, 8–10 and > 10 years); risky occupation, defined as job held for a minimum of 1 year with
potential exposure to smoke, particles, fumes or chemicals
(yes/no) (mining, rubber industry, tannery, chemical industry, wood-processing industry, metal processing [welding,
painting, electroplating], foundry, steel-rolling mill, shipyard, glass industry, graphics industry, building industry
Raaschou-Nielsen et al. Environmental Health 2012, 11:60
/>
[roofer, asphalt worker, demolition worker], truck, bus or
taxi driver, manufacture of asbestos or asbestos cement,
asbestos insulation, cement article industry, china and pottery industry, painter, welder, hairdresser, auto mechanic);
smoking status (never, former, current); smoking intensity
(lifetime average, spline, calculated by equating a cigarette
to 1 g, a cheroot or a pipe to 3 g, and a cigar to 4.5 g of
tobacco); smoking duration (total number of years smoking, linear) (smoking status, intensity and duration were
adjusted for as three separate variables); environmental
tobacco smoke (indicator of exposure, e.g. “smoker in the
home or/and exposure at work for at least 4 h/day”); physically active sport (categorical yes/no indicator and linear
intensity among active people); body mass index (spline);
waist circumference (linear); alcohol intake (categorical
yes/no indicator and spline for intensity among drinkers);
fat intake (linear); fruit and vegetable intake (linear); fiber
intake (linear); fish intake (linear); folate intake (linear); use
of hormone replacement therapy (categorical yes/no
indicator and linear duration among users); noise at the
baseline address (linear); and average gross income in 1995
in the municipality of residence at the time of enrollment
(spline).
Road traffic noise was calculated as the A-weighted
sound pressure level at the most exposed facade of the
baseline residence during the day, evening and night,
expressed as Lden as an indicator of the overall noise
level during 24 h, with a 5 dB penalty for the evening
and a 10 dB penalty for the night [22]. We used the
noise calculation software Soundplan (version 6.5,
) and the joint Nordic prediction method for road traffic noise, which has been the
standard method for noise calculation in Scandinavia for
many years; see details elsewhere [22]. The prespecified
potential effect modifiers were: sex, educational level,
body mass index, physical activity, intake of fruit and
vegetables, smoking status and pre-existing morbidity at
baseline.
Statistical methods. Mortality rate ratios (MRRs) were
estimated from Cox proportional hazards models with
Stata 11.0 and left truncation, with age as the time scale.
Participants were censored at the time of loss to followup due to emigration or disappearance or 31 December
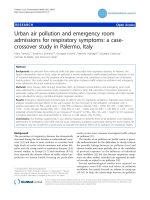
2009, whichever came first. NO2 was modeled as a timedependent variable. The distribution of NO2 levels at
addresses from 1971 until death or censoring was rightskewed (Figure 1); we log-transformed the NO2 concentration using logbase 2, corresponding to interpretation
of MRRs as “per doubling of exposure” to avoid excessive influence from observations in the right tail of the
distribution and because the NO2-mortality function
fitted better to a linear model after log-transformation of
NO2. We investigated the shape of the exposure–mortality
function for each continuous potential confounder using
Page 3 of 12
Figure 1 Distribution of NO2. Time-weighted average
concentrations of NO2 at the residential addresses of 52 061 cohort
participants from 1971 onwards.
cubic splines to determine whether the variable should be
modeled as linear or as a spline in the final models.
We investigated interactions with the likelihood ratio
test, comparing models with and without an interaction
term. The potential effect modifiers were tested one at a
time in the fully adjusted model. Marital status (single,
married, divorced, widow or widower) did not fulfill the
proportional hazard assumption and, therefore, we did
not adjust for this variable. Instead we specified separate
baseline hazards for each level of marital status (stratified Cox model). Exposure–response functions with 95%
confidence limits (CIs) were estimated and visualized
using restricted cubic splines (library Survival and library
Design in R statistical software 2.9.0) adjusting for the
potential confounders.
We used 5% as level of significance.
Sensitivity analyses. We tested the sensitivity to alternative exposure definitions, adjustment for pre-existing
disease, use of non-logged NO2 concentrations and use
of frailty models with municipality as a random effect to
take into account spatial correlation at municipality level
(see Additional file 1: Supplemental methods).
Results
Of 57 053 enrolled cohort members, 571 were excluded
because of a cancer diagnosis before baseline, two because
of uncertain date of cancer diagnosis, 960 for whom an
address history was not available in the Central Population
Registry or their address at baseline could not be geocoded,
948 because exposure was assessed for less than 80% of the
time between 1 January 1971 and death or censoring, and
2511 for whom a value was missing for a potential confounder or effect modifier, leaving 52 061 cohort members
for the study. These participants were followed up for an
Raaschou-Nielsen et al. Environmental Health 2012, 11:60
/>
average of 13.0 years, during which time 5534 died from
non-external causes, providing a crude mortality rate of
817 per 100 000 person–years at risk.
Table 1 and Table S1 (see Additional file 2: Table S1)
show the baseline characteristics of the 52 061 cohort
members, who were on average 56.7 years old, with
slightly more women than men. Compared to the whole
cohort, those who died during follow up had shorter
school attendance, more were divorced, unemployed, occupationally exposed to air pollution, smokers and
exposed to environmental tobacco smoke, had a higher
intake of fat, a lower intake of fruit and vegetables, were
less physically active, had pre-existing cardiovascular disease and were living close to dense traffic and in a municipality with low average income. Furthermore, among
those living at locations with high NO2 levels, more were
single or divorced, were smokers and exposed to environmental tobacco smoke, less physical activity, used hormone replacement therapy and were exposed to a higher
noise level; many characteristics were, however, similar
for people living at residences with high and low levels
of NO2. The mean NO2 concentration at the residences
of all participants after 1971 was 16.9 μg/m3 (minimum,
10.5 μg/m3; median, 15.1 μg/m3; maximum, 59.6 μg/m3),
with similar mean and median values for participants living in municipalities below the median income level
(16.8 and 14.5 μg/m3) and above the median income
level (16.9 and 15.9 μg/m3). Noise at the baseline
addresses of the study participants correlated with the
NO2 measures: Spearman’s correlation coefficient (rs) = 0.59
in comparison with the average NO2 at all addresses after
1971 and rs = 0.64 in comparison with NO2 at the baseline
address.
Table 2 shows that NO2 at the residence after 1971
was associated with mortality from cardiovascular disease and all causes. The MRRs for the different causes of
death ranged from 1.40 to 2.50 in association with a
doubling of the NO2 concentration in the basic model,
with adjustment for age and sex. All MRRs were attenuated by further adjustment for various covariates; additional adjustment for road traffic noise at the
enrollment address further attenuated the MRRs, although only marginally for mortality from cerebrovascular disease and ‘other’ cardiovascular diseases. In the
fully adjusted model, a doubling of the NO2 concentration at the residence was associated with a 26% (95% CI,
6–51%) higher cardiovascular mortality rate, a 71% (95%
CI, 25-137%) higher ‘other’ cardiovascular mortality rate
and a 13% (95% CI, 4–23%) higher all-cause mortality
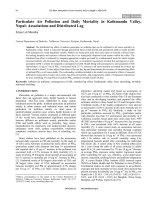
rate. Figure 2 shows almost linear exposure–response
functions between log-NO2 and MRRs for all cardiovascular disease, ischemic heart disease and all causes. Tentative adjustment for pre-existing morbidity at baseline
provided virtually identical results (results not shown).
Page 4 of 12
We compared the results based on our primary exposure measure (NO2 since 1971) with those for four alternative exposure measures: NO2 since 1991, NO2 at the
baseline address, presence of a major road within 50 m
and total traffic load within 200 m of the baseline address (Table 3). The two long-term NO2 measures (NO2
since 1971 and 1991) showed the strongest associations
with mortality; NO2 at the baseline address showed
weaker associations, and the two measures of traffic at
the baseline address showed even weaker associations.
The results for the subcohort living at the baseline address throughout the followup period were virtually
identical (Additional file 3: Table S2).
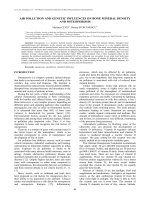
Figure 3 and Table 4 show effect modification by intake of fruit and vegetables, which was consistent for all
three cardiovascular mortality end-points: the MRRs
were highest for people with low intake of fruit and
vegetables (< 200 g/day), intermediate for those eating
200–400 g fruit and vegetables per day and lowest for
those with a high intake (> 400 g/day). The results showed
no clear differences in MRRs between people with and
without pre-existing morbidity at baseline or any of the
other potential effect modifiers (Table 4). Additional file 4:
Table S3, gives the numbers of deaths and person–years at
risk corresponding to the cells in Table 4.
NO2 concentration at the residences since 1971, without log-transformation, was associated with a 16% (95%
CI, 3–31%) higher cardiovascular mortality rate and an
8% (95% CI, 1–14%) higher all-cause mortality rate per
10 μg/m3 NO2 (Additional file 5:Table S4).
Frailty models with municipality included as a random
effect indicated area level confounding for all cause but not
for cardiovascular mortality (Additional file 6: Table S5).
Discussion
We found associations between long-term measures of
traffic-related air pollution at the residence and mortality
from cardiovascular disease and all causes, in agreement
with previous studies [1-9]. Adjustment for road traffic
noise attenuated the estimated MRRs, but associations
with NO2 concentration remained. The association between NO2 and mortality was strongest for people with
the lowest intake of fruit and vegetables and weakest (or
absent) for people with the highest intake.
The strengths of this study include a 13-year prospective
follow-up of a large cohort and adjustment for road traffic
noise and other potential confounders. Follow-up for
cause-specific mortality and vital status was possible
through nationwide population-based registries. Further,
exposure assessment at individual addresses allowed detection of within-city contrasts, which might be more strongly
associated with cardiovascular events than between-city
contrasts [23,24]. The model used to calculate NO2
concentrations at addresses requires comprehensive input
Characteristica
All-cause deathsb
Cohort
% (No.)
All participants
Median
(5–95 percentile)
100% (52 061)
Age at baseline (years)
% (No.)
Median
(5–95 percentile)
10.6% (5534)
56.1 (50.7-64.1)
NOc <19.0 μg/m3
2
% (No.)
Median
(5–95 percentile)
75.0% (39 045)
59.1 (51.2-64.7)
NO2≥19.0 μg/m3
% (No.)
Median
(5–95 percentile)
25.0% (13 016)
56.1 (50.7-64.1)
56.2 (50.7-64.2)
Sex
Male
47.5% (24 734)
59.5% (3 292)
48.0% (18 734)
46.1% (6 000)
Female
52.5% (27 327)
40.5% (2 242)
52.0% (20 311)
53.9% (7 016)
<8
32.8% (17 064)
42.2% (2 349)
32.4% (12 653)
33.9% (4 411)
8-10
46.2% (24 066)
41.1 % (2 274)
46.5% (18 169)
45.3% (5 897)
> 10
21.0% (10 931)
16.5% (911)
21.1% (8 223)
20.8% (2 708)
School attendance (years)
2
Body mass index (kg/m )
25.5 (20.4-33.3)
26.0 (19.8-34.6)
25.5 (20.5-33.1)
25.6 (20.3-33.9)
Raaschou-Nielsen et al. Environmental Health 2012, 11:60
/>
Table 1 Characteristics of 52 061 study participants, those who died during follow-up and those exposed to low and high levels of NO2 at their residences
(See Additional file 2: Table S1, Additional file 2 for further characteristics)
Physical activity (sport)
No
45.7% (23 787)
Yes (h/week)
54.3% (28 274)
60.4% (3 345)
2.0 (0.5-7.0)
39.6% (2 189)
43.8% (17 104)
2.0 (0.5-7.0)
56.2% (21 941)
51.3% (6 683)
2.0 (0.5-6.5)
48.7% (6 333)
2.0 (0.5-7.0)
Smoking
Never
36.0% (18 766)
18.4% (1 021)
37.5% (14 667)
31.5% (4 099)
Former
27.6% (14 354)
22.6% (1 249)
28.5% (11 107)
24.9% (3 247)
Current
36.4% (18 941)
59.0% (3 264)
34.0% (13 271)
43.5% (5 670)
d
14.8 (3.8-34.4)
17.3 (6.0-36.7)
14.6 (3.7-34.6)
15.2 (4.0-34.1)
Duration (years) d
33.0 (7.0-46.0)
38.0 (12.0-49.0)
32.0 (7.0-46.0)
34.0 (8.0-46.0)
Fruit and vegetable
intake (g/day)
312 (96.0-734)
265 (71.8 -704)
315 (101-726)
301 (85.0 -754)
Intensity (g/day)
Cardiovascular disease at enrolment
(any of the five below)
23.1% (12 015)
33.0% (1 828)
23.0% (8 973)
23.4% (3 042)
Myocardial infarction
2.0% (1 061)
6.4% (356)
2.0% (768)
2.2% (293)
Angina pectoris
3.1% (1 604)
6.3% (348)
3.0% (1 190)
3.2% (414)
1.3% (682)
3.4% (187)
1.3% (498)
1.4% (184)
16.3% (8 485)
22.6% (1 251)
16.1% (6 303)
16.8% (2 182)
7.4% (3 880)
10.0% (554)
7.6% (2 985)
6.9% (895)
Stroke
Hypertension
Hypercholesterolemia
NO2 at front door (μg/m3) since 1971c
2.0% (1 069)
5.1% (284)
15.1 (11.5-27.1)
1.9% (754)
16.6 (11.6-29.5)
2.4% (315)
14.2 (11.4-18.5)
22.1 (19.2-34.8)
Page 5 of 12
Diabetes mellitus at baseline
Major roade within 50 m of address
at baseline
No
92.0% (47 886)
89.6% (4 958)
97.0% (37 856)
77.1% (10 030)
Yes
8.0% (4 175)
10.4% (576)
3.0% (1 189)
22.9% (2 986)
Traffic load within 200 m of the
address at baseline (103 vehicle
km/day)
Noise (Lden) at baseline address (dB)
a
2.5 (0.3-15.1)
3.5 (0.3-16.1)
1.7 (0.2-12.0)
6.9 (0.6-22.9)
56.4 (48.4-70.0)
57.9 (48.9-71.0)
54.6 (48.0-66.3)
63.4 (52.2-73.1)
At baseline unless otherwise specified.
b
Excluding external cause of death.
c
Time-weighted average for the period 1 January 1971 to death, censoring or end of follow-up.
d
Based on all people who had ever smoked; lifetime average smoking intensity.
e
More than 10 000 vehicles per day.
Raaschou-Nielsen et al. Environmental Health 2012, 11:60
/>
Table 1 Characteristics of 52 061 study participants, those who died during follow-up and those exposed to low and high levels of NO2 at their residences
(See Additional file 2: Table S1, Additional file 2 for further characteristics) (Continued)
Page 6 of 12
Raaschou-Nielsen et al. Environmental Health 2012, 11:60
/>
Page 7 of 12
Table 2 Mortality rate ratios associated with time-weighted average concentration of NO2 from 1971 onwards at
residential addresses
Mortality rate ratioa (95% CI)
Mortality (ICD-10 codes)
Ndeaths
Model with adjustment
for sex and ageb
Model with further adjustment
for various variablesc
Model with further
adjustment for noised
All causes (except external, S-Z)
5534
1.52 (1.42-1.62)
1.18 (1.10-1.26)
1.13 (1.04-1.23)
Cardiovascular (I00-99)
1285
1.71 (1.50-1.94)
1.33 (1.16-1.54)
1.26 (1.06-1.51)
Ischemic heart disease (I20-25)
548
1.48 (1.21-1.82)
1.23 (0.99-1.54)
1.12 (0.85-1.47)
Cardiac rhythm disturbances
(I44 + I47-49)
25
2.32 (0.95-5.67)
1.41 (0.50-3.94)
1.01 (0.28-3.65)
Heart failure (I50)
44
1.89 (0.94-3.80)
1.14 (0.52-2.51)
0.94 (0.35-2.53)
Cerebrovascular disease (I60-69)
292
1.40 (1.06-1.86)
1.13 (0.83-1.53)
1.11 (0.78-1.63)
Other cardiovascular disease
376
2.46 (1.96-2.09)
1.80 (1.41-2.32)
1.71 (1.25-2.37)
Results based on 677 761 person-years at risk for 52 061 cohort participants from baseline (1993-1997) through 2009.
a
Given per doubling of the NO2 concentration.
b
Adjusted for sex and age (age was the time scale in the Cox models).
c
Adjusted for sex, age (age was the time scale), calendar year, employment status, school attendance, occupation with potential exposure to smoke and fumes,
smoking status, smoking intensity, smoking duration, environmental tobacco smoke, alcohol, fat, fish, fruit and vegetables, fiber, folate, body mass index, waist
circumference, physical activity with sport, hormone replacement therapy, average gross income of municipality of residence in 1995. The Cox model stratified for
marital status.
d
As previous model with further adjustment for noise at the baseline address.
data and has been validated [19-21] and applied [25-27].
Although model-based estimates of air pollution concentrations are inevitably somewhat uncertain, any resulting non-
differential misclassification would create artificial associations only in rare situations [28]. The data on mortality
were from the Danish Registry of Causes of Death, and the
Figure 2 Spline functions between NO2 and mortality. Spline functions (filled lines; 95% confidence limits indicated by dashed lines) between
average NO2 concentration (μg/m3) at residences from 1971 onwards and mortality from all causes and cardiovascular disease. Functions
adjusted for the same potential confounders as those relevant for results in the last column of Table 2.
Raaschou-Nielsen et al. Environmental Health 2012, 11:60
/>
Page 8 of 12
Table 3 Mortality rate ratios associated with different exposure measures at residential addresses
Mortality rate ratioa (95% confidence interval)
Exposure
All causes
(n = 5534)
Cardiovascular disease Ischemic heart disease Cerebrovascular disease Other cardiovascular disease
(n = 1285)
(n = 548)
(n = 292)
(n = 376)
NO2 from 1971 onwardsb 1.13 (1.04-1.23)
1.26 (1.06-1.51)
1.12 (0.85-1.47)
1.11 (0.76-1.63)
1.72 (1.25-2.37)
NO2 from 1991 onwardsb 1.13 (1.05-1.22)
1.21 (1.02-1.42)
1.13 (0.88-1.45)
0.99 (0.70-1.41)
1.56 (1.17-2.10)
NO2 (1-year mean) at
address at baselineb
1.09 (1.01-1.19)
1.16 (0.99-1.37)
1.09 (0.85-1.41)
1.06 (0.75-1.52)
1.42 (1.06-1.92)
Major road within 50
of address at baseline
0.94 (0.85-1.05)
0.98 (0.79-1.21)
1.04 (0.76-1.44)
0.87 (0.54-1.39)
1.03 (0.71-1.49)
Traffic load within 200 m 1.01 (0.99-1.03)
of address at baselinec
1.02 (0.98-1.06)
1.01 (0.95-1.07)
1.02 (0.94-1.11)
1.03 (0.96-1.11)
Results based on 677 761 person–years at risk for 52 061 cohort participants from baseline (1993–1997) through 2009.
a
Adjusted for sex, age (age was the time scale), calendar year, employment status, school attendance, occupation with potential exposure to smoke and fumes,
smoking status, smoking intensity, smoking duration, environmental tobacco smoke, alcohol, fat, fish, fruit and vegetables, fiber, folate, body mass index, waist
circumference, physical activity with sport, hormone replacement therapy, average gross income of municipality of residence in 1995 and noise at the baseline
address. The Cox model stratified for marital status.
b
The mortality rate ratio is given per doubling of the NO2 concentration. The three NO2 measures correlated strongly; rs = 0.92 between NO2 from1971 and NO2
from 1991; rs = 0.87 between NO2 from1971 and NO2 at baseline; rs = 0.95 between NO2 from1991 and NO2 at baseline.
c
The mortality rate ratio is given per doubling of the traffic load.
underlying cause of death was defined from information on
death certificates [17]. A validation study showed that the
Danish Registry of Causes of Death has a predictive value
of 70% and a sensitivity of 81% for death due to acute myocardial infarction [29]. Misclassification of the underlying
cause of death is unlikely to be associated with air pollution
levels and would change the MRRs towards 1.00 rather
than create artificial associations. Personal characteristics of
the participants were collected at baseline. Some factors
(e.g. smoking duration and intensity, educational level
Figure 3 Mortality rate ratios by intake of fruit and vegetables.
Mortality rate ratios (MRR, dots) with 95% confidence intervals
(whiskers) for all causes, all cardiovascular disease, ischemic heart
disease and cerebrovascular disease associated with NO2
concentrations at residences since 1971, by three levels of intake of
fruit and vegetables.
and HRT use) covered the whole life until baseline;
others covered a shorter period (e.g. dietary habits which
covered the last year before baseline); and others (such as
BMI and waist circumference) referred to one point in
time (baseline). It is uncertain to which degree the
collected information covers also the time after baseline
and for e.g. diet and BMI also the time many years before
baseline. The study population was between 50 and 64
years old at baseline, and lifestyle at these ages are usually
relatively stable and representative for the decades before
and after. However, participants who developed a disease
after baseline might indeed have changed lifestyle, which
might cause misclassification when using baseline
characteristics.
Previous studies of NO2 and mortality from cardiovascular disease and all causes have shown both stronger
[3,8,14,30], similar [4,8,31,32] and weaker [2,8,9] associations than this study when comparing effect estimates
corresponding to 10 μg/m3 NO2. The differences might
be due to different methods or differences in the air
pollution mixture for which NO2 is a marker. The confidence intervals of the present study overlap widely with
those of corresponding results from the previous studies
indicating that chance might also explain the differences.
Several risk factors for mortality, such as length of
school attendance, smoking and physical activity, were
associated with NO2 levels at the residence, and adjustment for these (and other) factors reduced the MRRs
substantially, as expected. Exposure to road traffic noise
is associated with both traffic-related air pollution and
cardiovascular health [10] and was therefore also a
potential confounder in the present study. Although
adjustment for road traffic noise reduced the risk estimates associated with NO2, the effects on mortality from
cardiovascular disease and all causes remained. An effect
Raaschou-Nielsen et al. Environmental Health 2012, 11:60
/>
Page 9 of 12
Table 4 Mortality rate ratios associated with NO2 at the front door from 1971 onwards among 52 061 cohort
participants, by potential effect modifiers
Potential effect modifier
Mortality rate ratio (95% CI)a
Covariate level
All causes
Whole cohortb
Cardiovascular disease Ischemic heart disease Cerebrovascular disease
1.13 (1.04-1.23)
1.12 (0.85-1.47)
1.11 (0.78-1.63)
Male
1.19 (1.07-1.32)
1.28 (1.05-1.56)
1.15 (0.85-1.54)
1.31 (0.84-2.04)
Female
Sex
1.26 (1.06-1.51)
1.05 (0.94-1.19)
1.22 (0.93-1.60)
1.03 (0.65-1.53)
0.89 (0.53-1.50)
p for interaction
0.08
0.74
0.66
0.20
<8
1.15 (1.03-1.29)
1.25 (1.00-1.56)
1.07 (0.76-1.50)
1.13 (0.68-1.87)
8-10
1.16 (1.03-1.30)
1.34 (1.05-1.71)
1.17 (0.80-1.71)
1.02 (0.61-1.71)
> 10
School attendance (years)
0.99 (0.83-1.19)
1.11 (0.76-1.61)
1.20 (0.65-2.23)
1.34 (0.64-2.78)
p for interaction
0.22
0.79
0.65
0.80
< 25
1.12 (1.00-1.26)
1.13 (0.90-1.55)
1.14 (0.74-1.74)
0.99 (0.58-1.68)
25-30
1.15 (1.02-1.29)
1.33 (1.06-1.67)
1.22 (0.85-1.73)
1.31 (0.81-2.13)
> 30
Body mass index (kg/m2)
1.13 (0.96-1.32)
1.24 (0.93-1.66)
0.96 (0.62-1.49)
0.92 (0.42-1.99)
p for interaction
0.91
0.84
0.51
0.90
No
1.17 (1.05-1.29)
1.25 (1.02-1.53)
1.15 (0.84-1.56)
1.05 (0.68-1.64)
Yes
Physical activity (sport)
1.08 (0.95-1.22)
1.29 (1.01-1.66)
1.07 (0.72-1.59)
1.22 (0.72-2.07)
0.25
0.80
0.75
0.63
p for interaction
Fruit and vegetable consumption (g/day) < 200
1.25 (1.11-1.42)
1.45 (1.13-1.87)
1.45 (0.98-2.14)
1.38 (0.79-2.37)
200-400
1.06 (0.95-1.20)
1.23 (0.97-1.56)
1.10 (0.76-1.58)
1.29 (0.79-2.11)
> 400
1.07 (0.93-1.23)
1.09 (0.82-1.47)
0.82 (0.51-1.31)
0.63 (0.32-1.24)
0.04
0.12
0.05
0.08
p for interaction
Smoking status
Never
1.18 (1.00-1.39)
1.29 (0.90-1.85)
1.35 (0.78-2.35)
0.79 (0.37-1.70)
Former
1.05 (0.90-1.22)
1.02 (0.75-1.39)
0.97 (0.62-1.53)
0.99 (0.50-1.96)
Current
1.15 (1.04-1.27)
1.36 (1.11-1.67)
1.13 (0.82-1.56)
1.27 (0.82-1.97)
0.94
0.39
0.78
0.22
No
1.13 (0.99-1.28)
1.43 (1.15-1.79)
1.38 (0.97-1.96)
1.18 (0.74-1.86)
Yes
1.15 (1.04-1.26)
1.17 (0.94-1.60)
1.00 (0.72-1.40)
1.09 (0.66-1.79)
0.79
0.13
0.13
0.79
p for interaction
c
Pre-existing morbidity at baseline
p for interaction
a
Per doubling of NO2 concentration. Adjusted for sex, age (age was the time scale), calendar year, employment status, school attendance, occupation with
potential exposure to smoke and fumes, smoking status, smoking intensity, smoking duration, environmental tobacco smoke, alcohol intake, fat, fish, fruit and
vegetables, fiber, folate, body mass index, waist circumference, physical activity with sport, hormone replacement therapy, average gross income of municipality
of residence in 1995 and noise at the baseline address. The Cox model stratified for marital status.
b
Identical to estimates in the last column of Table 2; shown here for comparison.
c
Myocardial infarction, angina pectoris, stroke, hypertension, hypercholesterolemia or diabetes mellitus. The model included adjustment for main effects of
pre-existing morbidity.
of air pollution on mortality from cardiovascular disease
independent of concomitant noise is in line with the
results of two recent studies [33,34].
It is uncertain which period of exposure is relevant for
an association between exposure to air pollution and
morbidity and mortality from cardiovascular disease. We
found stronger associations of mortality from all cardiovascular disease with exposure since 1971 and 1991 than
with 1-year average exposure at the baseline address,
although the difference was small. This might indicate
the relevance of decades of exposure, perhaps explained
by effects of air pollution on the chronic process of
atherogenesis [13] or other mechanisms of importance
for the development of cardiovascular diseases [11]. Our
study addressed long-term exposure; however, people
living in highly polluted areas are probably also more
likely to be exposed to high peak exposures. Strong correlations (rs between 0.87 and 0.95) for NO2 over the
three periods precluded a more detailed analysis of the
effect of timing of exposure in the present study.
In contrast to our findings with modeled NO2 at residences, we found no significant associations with indicators
of traffic at the residence. This difference might be due to
the fact that the air pollution model takes into account a
number of factors of relevance for the air pollution concentration (such as street width, building geometry, amount,
Raaschou-Nielsen et al. Environmental Health 2012, 11:60
/>
type, speed and emission factors of traffic, background
contributions), providing a more precise assessment of air
pollution than the simple traffic counts used for the traffic
indicators. Previous studies have shown associations with
simple traffic indicators, however without adjustment for
road traffic noise [2,6,35,36]. Post-hoc analyses without
adjustment for noise showed associations between the
simple traffic indicators and mortality from cardiovascular
disease and all causes (Additional file 7: Table S6). Thus,
when NO2 and noise were assessed in state-of-the art
exposure models with extensive input data of similar
quality, significant associations were found between NO2
concentration and mortality from cardiovascular disease
and all causes also after adjustment for road traffic noise.
When the simple, less precise proxy measures of air
pollution, traffic indicators, were adjusted for the more
precisely determined street noise levels, the estimated
effect of traffic might be ‘over-adjusted’.
We adjusted for noise at the baseline address even
when estimating effects of air pollution over much
longer time periods, because noise calculations were not
available at all addresses since 1971. This might imply
insufficient adjustment for noise, i.e. residual confounding.
However, the results also showed a significant effect of air
pollution after adjustment for noise when estimating both
air pollution and noise at the baseline address and restricting to cohort participants who lived at the same address
from baseline onwards (Additional file 3: Table S2).
Dietary intake of fruit and vegetables modified the
association between NO2 and mortality, so that the association was strongest for people with a low intake of
fruit and vegetables and weakest (or absent) among
people with a high intake. This is in line with a casecrossover study of short-term effects of air pollution,
which showed the strongest effects on mortality among
those with a low intake of fruit and vegetables [12]. We
found associations between NO2 concentration and
mortality; NO2 is not only an airway irritant but also an
indicator of vehicle engine exhaust, which is a complex
mixture of many chemicals, including particulate matter
with absorbed polycyclic aromatic hydrocarbons, quinones, transition metals and other substances. Thus,
associations observed between NO2 and cardiovascular
diseases might be caused by multiple of these correlated
substances, which in general can cause oxidative stress
and inflammation, which in turn can promote cardiovascular disease mechanisms including short-term related
endothelial dysfunction, plaque rupture, thrombogenecity and autonomic imbalance and long-term related
atherosclerosis progression, plague instability, insulin
resistance and dyslipidemia [11,13,37,38]. A possible
mechanism for a protective effect of fruit and vegetables
that are rich in antioxidants and related compounds is
scavenging of free radicals and reactive oxygen species
Page 10 of 12
generated by exposure to air pollution before they can
affect vascular function, oxidize lipids and activate
proinflammatory, prothrombotic and other relevant
pathways as well as up-regulation of protective enzymes
[39-42]. Although a single previous study supports this
hypothesis [2], we cannot exclude the possibility that the
interaction between intake of fruit and vegetables and
mortality from cardiovascular disease observed in this
study is a chance finding. Also, a high intake of fruit and
vegetables might be an indicator of a generally healthy
lifestyle, and the apparent effect modification by fruit
and vegetables might be due to other characteristics that
were not sufficiently adjusted for in our study. However,
the ‘dose–response’ association for three levels of fruit
and vegetable intake, the consistency by end-point and
biological plausibility speak in favor of a true interaction.
We did not find stronger associations between air pollution and mortality among cohort members with a previous
diagnosis of myocardial infarction, angina pectoris, stroke,
hypertension, hypercholesterolemia or diabetes mellitus, in
line with previous results [8,9,24]. This result, with the finding that adjustment for pre-existing morbidity had virtually
no effect on MRRs, indicates that death due to air pollution
does not affect only susceptible people with pre-existing
cardiovascular disease or diabetes mellitus and that the
underlying biological mechanisms of long-term air pollution exposure are general and affect large populations.
These conclusions are in line with recent proposals that air
pollution promotes the life-long process of atherogenesis
and that underlying subclinical atherosclerosis increases the
pool of people prone to ‘events’ [13,43].
A previous study indicated a stronger association
between air pollution and mortality among women than
among men [32], but the results of our and other studies
show no such sex difference [4,8,9,44]. Some studies
indicated stronger associations between air pollution
and cardiovascular events among people with a high
body mass index [24,45], which was not confirmed in
the present or another study [8]. Two studies suggested
that air pollution had the strongest effects on all-cause
mortality among people with the lowest educational
level [2,44], but our and other studies did not confirm
this for all causes [30] or for cardiovascular events
[4,24]. Some [2,44,45] but not other studies [8,24,30,46]
showed stronger effects of air pollution among people
who had never smoked; however, we found no effect
modification by smoking status.
Our results show associations between NO2 concentration and mortality from ‘other’ cardiovascular diseases, covering a heterogeneous variety of relatively rare
causes of death. In view of the large number of other
causes of death, the few deaths from each cause and the
lack of an a priori hypothesis, we abstained from an
explorative analysis for this subgroup.
Raaschou-Nielsen et al. Environmental Health 2012, 11:60
/>
Conclusions
In conclusion, this cohort study shows associations between
traffic-related air pollution at residential addresses over
several decades and mortality from cardiovascular disease
and all causes, after adjustment for road traffic noise and
other potential confounders. The association between air
pollution and mortality was strongest for people with a low
intake of fruit and vegetables, which needs confirmation in
future studies.
Additional files
Additional file 1: Supplemental methods.
Additional file 2: Table S1. Characteristics of study participants, those
who died and those with low and high levels of NO2 at their residences.
Additional file 3: Table S2. Mortality rate ratios associated with
different exposure measures at residential addresses, based on cohort
participants who lived at the same address from baseline (1993–1997)
through 2009.
Additional file 4: Table S3. Number of deaths and person-years at risk
by potential effect modifier among 52 061 participants followed up from
baseline (1993–1997).
Additional file 5: Table S4. Mortality rate ratios in association with nonlogged time-weighted average concentration of NO2 from 1971 onwards
at residential addresses.
Additional file 6: Table S5. Mortality rate ratios in association with
time-weighted average concentration of NO2 from 1971 onwards at
residential addresses estimated in frailty models with municipality as a
random effect.
Additional file 7: Table S6. Mortality rate ratios associated with
exposure measures at residential addresses, based on cohort participants
who lived at the same address from baseline (1993–1997) through 2009
and without adjustment for road traffic noise.
Abbreviations
CI: Confidence Interval; GIS: Geographical Information System;
ICD: International Classification of Diseases; MRR: Mortality Rate Ratio;
OSPM: Operational Street Pollution Model; rs: Spearman’s Correlation
Coefficient.
Competing interest
The authors have no competing interests.
Authors’ contributions
ORN conceived and designed the study, participated in acquisition of
environmental data and exposure assessment, participated in planning data
analyses and drafted the manuscript. ZA participated in planning the
statistical analyses, performed record linkages, data processing and statistical
analyses. SSJ and MK developed the air pollution modelling system and
conducted the air pollution calculations. JH defined the occupations
associated with higher mortality. SL contributed to the manuscript. AT and
KO established the Diet Cancer and Health cohort and provided cohort data.
All authors participated in interpretation of the data, commented on the
manuscript and approved the final manuscript for publication.
Acknowledgements
We thank Kristin Miller for fruitful discussions on methodological aspects and
Martin Hvidberg for geocoding addresses and calculating the traffic
variables. The project was supported by the Danish Agency for Science,
Technology and Innovation, as part of the Danish Centre of Excellence on
Air Pollution and Health, AIRPOLIFE (grant 2052-03-0016), and by the Danish
Cancer Society. The funding sources had no role in any aspect of the
research process.
Page 11 of 12
Author details
1
Danish Cancer Society Research Center, Copenhagen, Denmark.
2
Department of Public Health, Center for Epidemiology and Screening,
University of Copenhagen, Copenhagen, Denmark. 3Department of
Environmental Science, Aarhus University, Roskilde, Denmark. 4Department of
Public Health, Section of Environmental Health, University of Copenhagen,
Copenhagen, Denmark. 5Department of Epidemiology, School of Public
Health, Aarhus University, Aarhus, Denmark.
Received: 30 March 2012 Accepted: 28 August 2012
Published: 5 September 2012
References
1. Nafstad P, Haheim LL, Wisloff T, Gram F, Oftedal B, Holme I, Hjermann I,
Leren P: Urban air pollution and mortality in a cohort of Norwegian men.
Environ Health Perspect 2004, 112:610–615.
2. Beelen R, Hoek G, van den Brandt PA, Goldbohm RA, Fischer P, Schouten LJ,
Jerrett M, Hughes E, Armstrong B, Brunekreef B: Long-term effects of
traffic-related air pollution on mortality in a Dutch cohort (NLCS-AIR
study). Environ Health Perspect 2008, 116:196–202.
3. Jerrett M, Finkelstein MM, Brook JR, Arain MA, Kanaroglou P, Stieb DM,
Gilbert NL, Verma D, Finkelstein N, Chapman KR, Sears MR: A cohort study
of traffic-related air pollution and mortality in Toronto, Ontario, Canada.
Environ Health Perspect 2009, 117:772–777.
4. Rosenlund M, Bellander T, Nordquist T, Alfredsson L: Traffic-generated air
pollution and myocardial infarction. Epidemiology 2009, 20:265–271.
5. Lipfert FW, Wyzga RE, Baty JD, Miller JP: Air pollution and survival within
the Washington University-EPRI veterans cohort: risks based on modeled
estimates of ambient levels of hazardous and criteria air pollutants. J Air
Waste Manag Assoc 2009, 59:473–489.
6. Gan WQ, Tamburic L, Davies HW, Demers PA, Koehoorn M, Brauer M:
Changes in residential proximity to road traffic and the risk of death
from coronary heart disease. Epidemiology 2010, 21:642–649.
7. Ostro B, Lipsett M, Reynolds P, Goldberg D, Hertz A, Garcia C, Henderson
KD, Bernstein L: Long-term exposure to constituents of fine particulate air
pollution and mortality: results from the California Teachers Study.
Environ Health Perspect 2010, 118:363–369.
8. Yorifuji T, Kashima S, Tsuda T, Takao S, Suzuki E, Doi H, Sugiyama M,
Ishikawa-Takata K, Ohta T: Long-term exposure to traffic-related air
pollution and mortality in Shizuoka, Japan. Occup Environ Med 2010,
67:111–117.
9. Gan WQ, Koehoorn M, Davies HW, Demers PA, Tamburic L, Brauer M: Longterm exposure to traffic-related air pollution and the risk of coronary
heart disease hospitalization and mortality. Environ Health Perspect 2011,
119:501–507.
10. Babisch W: Transportation noise and cardiovascular risk: updated review
and synthesis of epidemiological studies indicate that the evidence has
increased. Noise Health 2006, 8:1–29.
11. Brook RD, Rajagopalan S, Pope CA III, Brook JR, Bhatnagar A, Diez-Roux AV,
Holguin F, Hong Y, Luepker RV, Mittleman MA, Peters A, Siscovick D, Smith
SC Jr, Whitsel L, Kaufman JD: Particulate matter air pollution and
cardiovascular disease: An update to the scientific statement from the
American Heart Association. Circulation 2010, 121:2331–2378.
12. Ou CQ, Wong CM, Ho SY, Schooling M, Yang L, Hedley AJ, Lam TH: Dietary
habits and the short-term effects of air pollution on mortality in the
Chinese population in Hong Kong. J Epidemiol Community Health 2012,
66:254–258.
13. Kunzli N, Perez L, von Klot S, Baldassarre D, Bauer M, Basagana X, Breton C,
Dratva J, Elosua R, de Faire U, Fuks K, de Groot E, Marrugat J, Penell J,
Seissler J, Peters A, Hoffmann B: Investigating air pollution and
atherosclerosis in humans: concepts and outlook. Prog Cardiovasc Dis
2011, 53:334–343.
14. Gehring U, Heinrich J, Kramer U, Grote V, Hochadel M, Sugiri D, Kraft M,
Rauchfuss K, Eberwein HG, Wichmann HE: Long-term exposure to ambient
air pollution and cardiopulmonary mortality in women. Epidemiology
2006, 17:545–551.
15. Rosenlund M, Berglind N, Pershagen G, Hallqvist J, Jonson T, Bellander T:
Long-term exposure to urban air pollution and myocardial infarction.
Epidemiology 2006, 17:383–390.
16. Tjonneland A, Olsen A, Boll K, Stripp C, Christensen J, Engholm G, Overvad
K: Study design, exposure variables, and socioeconomic determinants of
Raaschou-Nielsen et al. Environmental Health 2012, 11:60
/>
17.
18.
19.
20.
21.
22.
23.
24.
25.
26.
27.
28.
29.
30.
31.
32.
33.
34.
35.
36.
participation in Diet, Cancer and Health: a population-based prospective
cohort study of 57,053 men and women in Denmark. Scand J Public
Health 2007, 35:432–441.
Helweg-Larsen K: The Danish Register of Causes of Death. Scand J Public
Health 2011, 39:26–29.
Jensen SS, Berkowicz R, Hansen SH, Hertel O: A Danish decision-support
GIS tool for management of urban air quality and human exposures.
Transport Res Part D: Transport Environ 2001, 6:229–241.
Raaschou-Nielsen O, Hertel O, Vignati E, Berkowicz R, Jensen SS, Larsen VB,
Lohse C, Olsen JH: An air pollution model for use in epidemiological
studies: evaluation with measured levels of nitrogen dioxide and
benzene. J Expo Anal Environ Epidemiol 2000, 10:4–14.
Berkowicz R, Ketzel M, Jensen SS, Hvidberg M, Raaschou-Nielsen O:
Evaluation and application of OSPM for traffic pollution assessment for
large number of street locations. Environ Model Software 2008, 23:296–303.
Ketzel M, Berkowicz R, Hvidberg M, Jensen SS, Raaschou-Nielsen O:
Evaluation of AIRGIS – a GIS-based air pollution and human exposure
modelling system. Int J Environ Pollut 2011, 47:226–238.
Sorensen M, Hvidberg M, Andersen ZJ, Nordsborg RB, Lillelund KG, Jakobsen J,
Tjonneland A, Overvad K, Raaschou-Nielsen O: Road traffic noise and stroke: a
prospective cohort study. Eur Heart J 2011, 32:737–744.
Jerrett M, Burnett RT, Ma R, Pope CA III, Krewski D, Newbold KB, Thurston G,
Shi Y, Finkelstein N, Calle EE, Thun MJ: Spatial analysis of air pollution and
mortality in Los Angeles. Epidemiology 2005, 16:727–736.
Miller KA, Siscovick DS, Sheppard L, Shepherd K, Sullivan JH, Anderson GL,
Kaufman JD: Long-term exposure to air pollution and incidence of
cardiovascular events in women. N Engl J Med 2007, 356:447–458.
Raaschou-Nielsen O, Andersen ZJ, Hvidberg M, Jensen SS, Ketzel M,
Sørensen M, Loft S, Overvad K, Tjonneland A: Lung cancer incidence and
long-term exposure to air pollution from traffic. Environ Health Perspect
2011, 119:860–865.
Andersen ZJ, Hvidberg M, Jensen SS, Ketzel M, Loft S, Sorensen M,
Tjonneland A, Overvad K, Raaschou-Nielsen O: Chronic Obstructive
Pulmonary Disease and Long-Term Exposure to Traffic-Related Air
Pollution: A Cohort Study. Am J Respir Crit Care Med 2011, 183:455–461.
Raaschou-Nielsen O, Andersen ZJ, Hvidberg M, Jensen SS, Ketzel M,
Sorensen M, Hansen J, Loft S, Overvad K, Tjonneland A: Air pollution from
traffic and cancer incidence: a Danish cohort study. Environ Health 2011,
10:67.
Dosemeci M, Wacholder S, Lubin JH: Does nondifferential misclassification
of exposure always bias a true effect toward the null value? Am J
Epidemiol 1990, 132:746–748.
Madsen M, Davidsen M, Rasmussen S, Abildstrom SZ, Osler M: The validity
of the diagnosis of acute myocardial infarction in routine statistics: a
comparison of mortality and hospital discharge data with the Danish
MONICA registry. J Clin Epidemiol 2003, 56:124–130.
Filleul L, Rondeau V, Vandentorren S, Le Moual N, Cantagrel A, AnnesiMaesano I, Charpin D, Declercq C, Neukirch F, Paris C, Vervloet D, Brochard
P, Tessier JF, Kauffmann F, Baldi I: Twenty five year mortality and air
pollution: results from the French PAARC survey. Occup Environ Med 2005,
62:453–460.
Rosenlund M, Picciotto S, Forastiere F, Stafoggia M, Perucci CA: Trafficrelated air pollution in relation to incidence and prognosis of coronary
heart disease. Epidemiology 2008, 19:121–128.
Chen LH, Knutsen SF, Shavlik D, Beeson WL, Petersen F, Ghamsary M, Abbey
D: The association between fatal coronary heart disease and ambient
particulate air pollution: Are females at greater risk? Environ Health
Perspect 2005, 113:1723–1729.
Beelen R, Hoek G, Houthuijs D, van den Brandt PA, Goldbohm RA, Fischer P,
Schouten LJ, Armstrong B, Brunekreef B: The joint association of air
pollution and noise from road traffic with cardiovascular mortality in a
cohort study. Occup Environ Med 2009, 66:243–250.
Selander J, Nilsson ME, Bluhm G, Rosenlund M, Lindqvist M, Nise G,
Pershagen G: Long-term exposure to road traffic noise and myocardial
infarction. Epidemiology 2009, 20:272–279.
Schikowski T, Sugiri D, Ranft U, Gehring U, Heinrich J, Wichmann HE, Kramer
U: Does respiratory health contribute to the effects of long-term air
pollution exposure on cardiovascular mortality? Respir Res 2007, 8:20.
Kan H, Heiss G, Rose KM, Whitsel EA, Lurmann F, London SJ: Prospective
analysis of traffic exposure as a risk factor for incident coronary heart
Page 12 of 12
37.
38.
39.
40.
41.
42.
43.
44.
45.
46.
disease: the Atherosclerosis Risk in Communities (ARIC) study. Environ
Health Perspect 2008, 116:1463–1468.
Delfino RJ, Sioutas C, Malik S: Potential role of ultrafine particles in
associations between airborne particle mass and cardiovascular health.
Environ Health Perspect 2005, 113:934–946.
Moller P, Jacobsen NR, Folkmann JK, Danielsen PH, Mikkelsen L,
Hemmingsen JG, Vesterdal LK, Forchhammer L, Wallin H, Loft S: Role of
oxidative damage in toxicity of particulates. Free Radic Res 2010, 44:1–46.
Dauchet L, Amouyel P, Dallongeville J: Fruits, vegetables and coronary
heart disease. Nat Rev Cardiol 2009, 6:599–608.
Kelly FJ: Dietary antioxidants and environmental stress. Proc Nutr Soc
2004, 63:579–585.
Moller P, Loft S: Dietary antioxidants and beneficial effect on oxidatively
damaged DNA. Free Radic Biol Med 2006, 41:388–415.
Romieu I, Castro-Giner F, Kunzli N, Sunyer J: Air pollution, oxidative stress
and dietary supplementation: a review. Eur Respir J 2008, 31:179–197.
Kunzli N: Is air pollution of the 20th century a cause of current asthma
hospitalisations? Thorax 2012, 67:2–3.
Pope CA III, Burnett RT, Thun MJ, Calle EE, Krewski D, Ito K, Thurston GD:
Lung cancer, cardiopulmonary mortality, and long-term exposure to fine
particulate air pollution. JAMA 2002, 287:1132–1141.
Puett RC, Schwartz J, Hart JE, Yanosky JD, Speizer FE, Suh H, Paciorek CJ,
Neas LM, Laden F: Chronic particulate exposure, mortality, and coronary
heart disease in the nurses' health study. Am J Epidemiol 2008,
168:1161–1168.
Puett RC, Hart JE, Suh H, Mittleman M, Laden F: Particulate Matter
Exposures, Mortality, and Cardiovascular Disease in the Health
Professionals Follow-up Study. Environ Health Perspect 2011,
119:1130–1135.
doi:10.1186/1476-069X-11-60
Cite this article as: Raaschou-Nielsen et al.: Traffic air pollution and
mortality from cardiovascular disease and all causes: a Danish cohort
study. Environmental Health 2012 11:60.
Submit your next manuscript to BioMed Central
and take full advantage of:
• Convenient online submission
• Thorough peer review
• No space constraints or color figure charges
• Immediate publication on acceptance
• Inclusion in PubMed, CAS, Scopus and Google Scholar
• Research which is freely available for redistribution
Submit your manuscript at
www.biomedcentral.com/submit