Exposure to ambient air pollution and prenatal and early childhood health effects potx
Bạn đang xem bản rút gọn của tài liệu. Xem và tải ngay bản đầy đủ của tài liệu tại đây (205.68 KB, 17 trang )
DEVELOPMENTAL EPIDEMIOLOGY
Exposure to ambient air pollution and prenatal and early childhood health effects
Marina Lacasan
˜
a
1,2,3
, Ana Esplugues
1,2
& Ferran Ballester
1,4
1
Epidemiology and Statistics Unit, Valencian School of Studies for Health, Valencia, Spain;
2
University Hospital La Fe,
Valencia, Spain;
3
Center for Environmental Health, Center for Research in Populational Health, National Institute of Public
Health, Cuernavaca, Mexico;
4
Public Health Department, History of Science and Gynaecology, Miguel Herna
´
ndez University,
Alicante, Spain
Accepted in revised form 7 September 2004
Abstract. Over the last years, concern for the pos-
sible influence of exposure to air pollutants in
children during gestation or the first years of life
has grown; exposure levels which may be reached
nowadays in our dwellings and in our streets. In the
present study evidence over the possible impact of
ambient air pollution on the foetus and the infants
(i.e.: less than 1 year) published during the last dec-
ade, 1994–2003, are revised. Studies on infant mor-
tality and exposure to particles show an outstan ding
consistence in the magnitude of the effects, despite the
different designs used. As a whole, data show that an
increase in 10 lg/m
3
of particle concentration (mea-
sured as PM
10
) is associated with to about 5% in-
crease in post-neonatal mortality for all causes and
around 22% for post-neonatal mortality for respira-
tory diseases. Regarding damage in foetal health,
although results are not always consistent, most
studies show associations with exposure to air pol-
lution during pregnancy. However, the precise
mechanisms of action of air pollutants on adverse
reproductive results are still unknown, so is the per-
iod of exposure most relevant during pregnancy and
the specific pollutant which may represent a higher
risk. Follow-up studies evaluating personal exposure
to different air pollutants are required, allowing for
the adequate evaluation of the impact of each pol-
lutant in different periods of pregnancy, as well as
providing hypotheses on their possible mechanisms
of action.
Key words: Ambient air pollution, Congenital defects, Intrauterine growth retardation, Low birth weight,
Mortality, Preterm delivery
Abbreviations: BW = birth weight; CI = confidence interval; CO = carbon monoxide; IQR = interquartile
range; IUGR = intrauterine growth retardation; LBW = low birth weight; NO
x
= nitrogen oxides; O
3
=
ozone; PAH = polycyclic aromatic hydrocarbons; PCB = polichlorinated biphenyls; PM
10
= parti-
cles £ 10 lm diameter; PM
2.5
= particles £ 2.5 lm diameter; TSP = total suspended particles; SGA = small
for gestational age; SIDS = sudden infant death syndrome; SMR = standardized mortality ratio; SO
2
=
sulphur dioxide; WP = weeks of pregnancy
Introduction
Foetal growth may be altered by maternal patholo-
gies (diabetes, hypertension, etc.), by deficient diets,
by exposure to toxic substances (tobacco, alcohol,
drugs), and by ambient pollutants in air [1–3], in
water and in soil [4, 5].
The foetus and the infant present a special vul-
nerability, compared to adults, regarding ambient
toxicants due to differences in exposure, physiological
immaturity, and longer life expectancy after expo-
sure. Results from epidemiological and experimental
studies show that foetuses and infants are especially
susceptible to the toxic effects of pollut ants such as
suspended particles, polycyclic aromatic hydrocar-
bons (PAH), and tobacco smoke [6]. In the case of
exposure to air pollutants where exposure occurs
through inhalation, children inhale a relatively higher
volume of air than adults.
In recent years there is a growing concern about
the possible influence on health of the exposure to air
pollutants during pregnancy or first childhood;
exposure to concentrations which may be reached
nowadays in our homes or streets. Recent studies
have added proofs of the impact of exposure to air
pollution on the risk of intrauterine or post-neonatal
death [7, 8], or congenital defects [9], prematurity
[10, 11] and foetal development [1, 3, 12].
We review the original studi es which have evalu-
ated the possible impact of ambient air pollution on
the foetus and the first year of life, published in the
last 10 years, from January 1994 to December 2003.
European Journal of Epidemiology (2005) 20: 183–199 Ó Springer 2005
Methods and materials
Search strategy
A bibliographic al search was carried out in the online
database MEDLINE ( />entrez/query.fcgi). With the MESH Thesaurus, the
following search syntax was used (‘Air Pollu-
tion’[MeSH] AND (‘Pregnancy’ OR ‘reprod*’ OR
‘infant’ OR ‘foetal’) AND ‘Exposure’ Limits: 10
Years, Human). As a time frame, 10 years previous to
the search date (December 2003) were selected.
Additional to the search in MEDLINE, a search in
the bibliographical database of the authors was car-
ried out and in the references of the selected articles,
The study by Bobak and Leon, 1992 [13] was in-
cluded for its relevance, despite having been pub-
lished before the period considered in this revision.
Inclusion criteria
The arti cles included follow these criteria: (a) original
article; (b) observational epidemiological study; (c)
exposure to outdoor air pollutants; (d) prenatal or up
to first year of life exposure, and (e) languages:
English, French, Spa nish, Portuguese or Italian.
Exclusion criteria
Articles which only dealt with (a) passive exposure to
tobacco smoke; (b) exposure to indoor air pollutants,
or (c) working place exposure, were excluded.
Comparison of individua l estimates
In order to facilitate comparison between studies, the
odds ratios or risks ratios showed in Figures 1a and b
Study
3rd trimester
Retrospective
Cohort
Ritz & Yu,1999
Rogers et al, 2000
Annual
Population based
Case-control
Annual
Lin et al ,2001
Geographical
Exposure
Design
Annual
Geographical
Landgren, 1996
0,5
1
1,5
2
2,5
3
3,5
4
4,5
SO2
NOx TSPSO2
CO Petrochemical
area
HC
OR
RR/OR
0,6
0,8
1
1,2
1,4
1,6
1,8
TSP
TSP
NOxNOx SO2SO2SO2TSPSO2 CO NO2
PM10PM10
CO
Exposure
Study
Design
Bobak & Leon 1999
Geographical
Bobak, 2000 Maisonet et al, 2001
Annual
Case-control
nested in a
cohort
Whilhelm et al, 2003
Annual
Wang et al, 1997
Prospective
cohort
3rd trimester
Maroziene &
Grazuleviciene, 2002
Annual
3rd trimester
3rd trimester
(a)
(b)
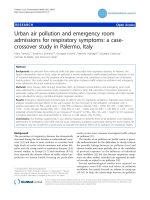
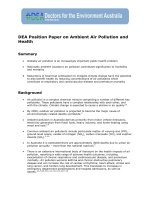
Figure 1. (a) Risk of low birth weight in studies evaluating its association with exposure to different ambient air pollutants
(measured as an increase of 10 lg/m
3
of TSP, PM
10
,SO
2
or NO
x
and as an increase of 1 mg/m
3
de CO) during pregnancy.
(b) Risk of low birth weight in studies evaluating its association with exposure to ambient air pollution (exposed vs. control
area) during pregnancy.
184
and 2 were recalculated to obtain the estimated effect
of each outcome for every increase in the levels of
TSP, PM
10
,SO
2
and NO
x
of 10 lg/m
3
, and of 1 mg/
m
3
in the levels of CO.
Meta-analysis
In general, for most of the outcomes at study a very
scarce number of studies met with similar criteria for:
outcome, exposure or design. So a formal meta-
analysis could not be attempted.
However, for the case of infant mortality, espe-
cially for post-neonatal mortality, and for low
birth weight some studies included quite likely mea-
sures of exposure and, therefore, an approximation
to some overall estimates was done. Most of these
studies included an indicator of particulates but not
always the same, so, in order to have comparable
measures, we approximate different levels of expo-
sure to 10 lg/m
3
of PM
10
by using the following
correction factors:
PM
10
¼ 0:6 Â TSP
PM
2:5
¼ 0:7 Â PM
10
:
Both corrections have been used by different agencies
or programmes in order to dispose of comparable
measures for particles (see Apheis Report 3 in www/
appheis.net, in press). Particularly, the first correction
factor is used in Central Europe, an d it is very
appropriate here, as we are converting TSP measures
from Check Republic.
The quantitative summary of study specific results
was obtained by means of meta-analysis techniques,
using STATA statistical package. The combined
estimates were obtained by weighted regression,
in which the weights were the inverse of the local
variances, i.e.: using the ‘fixed effect model’ [14]
Heterogeneity was checked by a chi-square test under
the fixed effect hypothesis and, if heterogeneity was
detected, the ‘random effect model’ was applied. For
the purposes of this analysis, heterogeneity was
assumed to be present if p < 0.20, however, in all
meta-analyses carried out, the value of p for hetero-
geneity test was alw ays above 0.20.
Results and discussion
Using the above strategy, a total of 31 articles was
obtained. The adverse reproductive effects evaluated
in the selected articles were: intrauterine mortality,
child mortality within the first year of life, birth
weight, premature delivery, intrauterine growth
retardation, congenital defects, (Table 1)
Low birth weight, intrauterine growth retardation
and premature delivery
Low birth weight (<2500 g) and premature delivery
(<37 weeks of gestational age) are considered
important predictors of foetal, neonatal and infant
Table 1. Adverse reproductive effects evaluated in the
selected studies
Adverse reproductive effects Total
(n = 31)
Low birth weight (<2500 g) 12
Very low birth weight (<1500 g) 2
Birth weight 3
Premature delivery (<37 weeks gestation) 10
Intrauterine growth retardation (weight at birth
< percentile 10 for gestational age and sex)
3
Congenital defects 2
Mortality (<28 weeks gestation, <1 year of life) 10
In several articles more than one adverse reproductive effect
is evaluated, therefore the amount of articles which evaluate
specific results do not sum the total.
0,8
0,9
1
1,1
1,2
1,3
1,4
1,5
1,6
Bobak and León, 1999
Bobak M, 2000
Maisonet M et al, 2001
Wilhelm M et al, 2003
Wang X et al, 1997
combined
Bobak and León, 1999
Bobak M, 2000
Maisonet M et al, 2001
Wang X et al, 1997
combined
Maisonet M et al, 2001
Wilhelm M et al, 2003
combined
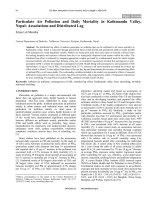
RR/OR
Study
Pollutant PM
10
SO
2
CO
Figure 2. Relative risk (and 95% CI) of low birth weight in studies evaluating its association with exposure to PM
10
and
SO
2
(measured as an increase of 10 lg/m
3
) and CO (measured as an increase of 1 mg/m
3
) during pregnancy.
185
mortality, as well as of infant morbidity [15–18] and it
could even be a risk factor for adult morbidity [19].
Therefore, the ambient facto rs which may contribute
to reducing the weight at birth are a great concern for
public health [20].
Birth weight and prematurity are highly related,
since the weight at birth reflects two major physio-
logical processes: the foetal growth rate and the
extension or duration of gestation. Therefore, low
birth weight may be due to either a short gestation
period or an intrauterine growth retardation (birth
weight < percentile 10 for gestational age and sex)
[21, 22] or to a combination of both causes. Low birth
weight may be considered as a foetal growth measure
if the analyses are adjusted by gestational age or if
LBW studies are restricted to full-term births [23], in
this revision all the studies on the effect of air pollu-
tion on LBW, adjusted the statistical models by ges-
tational age or analyses were restricted to full-term
births except for the study carried out by Bobak M,
2000 [24].
We found 12 studies evaluating the association
between exposure to outdoor air pollutants and low
birth weight (LBW), 2 evaluate very low birth weight,
3 birth weight (BW), 10 premat urity and 3 evaluate
intrauterine growth retardation (IUGR). The most
studied pollutants have been: total suspended parti-
cles (TSP), SO
2
and CO (Tables 2 and 3). In most
studies the evaluation to exposure was carried out
assigning the levels of air pollutants (year, trimester
or month means) reported by air pollution monitor-
ing stations regarding the proximity to the residence
of the mother at the time of delivery. In other studies
exposure was assigned according to the distance of
the place of residence to an industrial area; and only
in one case an individual and direct evaluation of
exposure was carried out. In this study, performed by
Perera et al. [12] they evaluated exposure to PAH
during the third trimester of pregnancy through
personal air sampling in a sample of 263 Afro-
American and Dominican non-smoking women of
between 18 and 35-year-old, living in New York and
who were registered in gynaecology and obstetrics
clinics during week 20 of gestation. Exposure to PAH
among Afro-American women was significantly
associated with a lower weight at birth and smaller
head circumference after adjusting for potential
confounders.
In all the studies reviewed, except in two [25, 26], a
higher risk of low birth weight was observed, signif-
icantly associated to air pollution levels. However,
there is no consistency regarding to which pregnancy
trimester could be more relevant and the specific
pollutant which may represent a higher risk.
Figures 1a and 1b summarise the results from studies
which have evaluated the associati on between expo-
sure to air pollutants and LBW. Figure 1a represents
the results from the 6 studies which evaluat ed the
association between low birth weight (LBW) with
annual or third trimester of g estation exposure to
specific pollutants (measured as an increase of 10 lg/
m
3
of TSP, PM
10
,SO
2
,NO
x
or NO
2
and as an
increase of 1 mg/m
3
de CO during pregnancy).
Figure 1b shows the results of four studies evaluating
exposure in a dichotomous way (exposed vs. control
area), observing with odds ratios higher than null
value and significant in all cases except in the study
by Landgren [26].
Results from meta-analysis in studies which ana-
lyse the effect of exposure to PM
10
,SO
2
and CO on
low birth weight show what we indicated previously
in a summarised way (Figure 2). Combined estimates
show that a 10 lg/m
3
increase of PM
10
or SO
2
(an-
nual or third gestational trimester mean) is associated
with a 1.6% (CI 95%, 1.0–2.2%) and 1.5% (CI 95%,
0.7–2.4%) increase in the risk of low birth weight
(<2500 g), respectively. On the other hand, a 1 mg/
m
3
increase of CO (annual or third gestational tri-
mester mean) is associated with a 21% (CI 95%, 7.0–
36%) increase of LBW risk.
Regarding premature delivery (<37 gestational
weeks), all the studies, except the one by Landgren
[26], observe association, although sometimes very
small, with exposure to air pollutants. From the 10
selected studies, only 5 studied the effect associated to
specific pollutants (Table 3), therefore, due to the
scarcity of studies evaluating this outcome and also
the variability among those studies regarding the
relevant exposure period considered, we do not
present the combined effects estimates.
Intrauterine growth retardation was studied
in three articles [3, 24, 27]. In two of them
[3, 27], association with exposure to particles was
found (PM
10
and PM
2.5
) and in the second study
also with PAH. Dejmek et al. [3] studied this
effect by exposure in each month of pregnancy,
observing association with exposure in the first
month of gestation. The authors highlight the
idea that, possibly, the effect which exposure to
particles supposes for risk of IUGR depends highly
on the concentration of toxic compounds contained
in these particles, rather than on the level of particles
alone [3]. In fact the PAH, especially those which
are big molecules, are better absorbed by the fine
particles.
The mechanisms of action of air pollutants on
these adverse reproductive effects are not accurately
known today. The same could be said about the most
relevant critical periods of exposure during preg-
nancy due to the lack of consistency between the
different studies regarding the magnitude of the effect
according to the mother’s exposure along the differ-
ent trimesters of pregnancy. However, some mecha-
nisms of action have been postulated:
(1) Infection of the mother of different aetiologies
is an important causal factor of premature delivery
[28] being the association with genitourinary infection
the most documented [29], therefore, it can be high-
186
Table 2. Studies evaluating the relationship between birth weight, low birth weight and intrauterine growth retardation and exposure to ambient air pollution
Authors,
year,
[reference]
Design Study population:
setting, period and
number
Outcome
a
Exposure, pollutants
(levels in lg/m
3
, mg/m
3
for CO)
Control
variables
Level of
comparison
b
Results: OR/RR (95% CI)
c
Landgren,
1996
[26]
Geographical Malmo
¨
hus county,
Sweden, 1985–1990,
n ¼ 38,718 infants
Low birth weight,
very low birth weight
Mean concentration of SO
2
(8.0),
hydrocarbons (6.6) and NO
x
(14.7) by
municipality
Year of birth, maternal
age and parity
Municipality OR municipalities above and below the
average value:
LBW: SO
2
0.92 (0.83–1.01); Hydrocarbons
0.91 (0.82–1.00); NO 0.95 (0.86–1.05) ?
No association was observed for very low
birth weight
Wang et al.,
1997
[32]
Prospective
cohort
83,998 pregnant women
and 74,671 first-parity
births (gestational age
37–44 weeks) and
>1000 g, Beijing,
1988–1991
Low birth weight Daily average of
SO
2
(range 9–308)
and TSP (range 211–618) measured
during 2–3 weeks each month at two
monitors
Gestational age,
residence, year of birth,
maternal age and infant
gender
Newborn OR by increase of 100 lg/m
3
in the
pollutant concentration during the third
trimester of pregnancy: SO
2
1.11
(CI 95%, 1.06–1.16);
TSP 1.10 (CI 95%, 1.56–1.14).
Bobak and
Leon,
1999
[33]
Geographical 222,370 live births of 45
(of 85) districts in the
Czech Republic,
1986–1988
Low birth weight Annual geometric mean:
TSP (68.5), SO
2
(31.9), NO
x
(35.1)
Socioeconomic
characteristics, other
two
pollutants
District OR by increase of 50 lg/m
3
in the
pollutant concentration: TSP 1.03
(0.95–1.11); SO
2
1.10 (1.01–1.20);
NO
x
0.99 (0.89–1.10)
Dejmek et al.,
1999
[27]
Geographical Teplice District (TD),
Czech Republic
1994–1996, n ¼ 1 943
Intrauterine growth
retardation
Ambient daily levels PM
10
: (47.6) and
PM
2.5
(35.6)
Averages for 9 consecutive 30 day period
after estimated date of conception for
PM
10
(47.7; tertil: <40, 40–50, !50) and
PM
2.5
(35.7; <27, 27–37, !37)
Sociodemographic
characteristics,
reproductive
factors, alcohol and
tobacco habits of
parents and maternal
passive smoking
Newborn TD first month of gestation.
PM
10
:
OR 2nd tertile 1.62 (1.07–2.46)
OR 3rd tertile: 2.64 (1.48–4.71)
PM
2.5
:
OR 2nd tertile: 1.26 (0.81–1.95)
OR 3
rd
tertile: 2.11 (1.20–3.70)
Ritz and Yu,
1999
[53]
Retrospective
cohort
125,573 singleton children
(37–44 weeks of
gestation). Los Angeles,
California,
1989–1993
Low birth weight Last trimester of pregnancy average of
CO: 2.97
Socioeconomic,
characteristics, race,
reproductive factors,
travel time to work and
walking to work
Newborn Third trimester of pregnancy, CO!6.30
vs. 2.52 mg/m
3
All children: 1.22 (1.03–1.44)
Multigravidae mothers: 1.33 (1.07–1.65);
Mothers under 20-year-old: 1.54 (1.07–2.22)
Bobak,
2000 [24]
Geographical 108,173 singleton live births
of 67 districts in Czech Re-
public, 1990–1991
Low birth weight Intrauter-
ine growth retardation
(IUGR)
Arithmetic means in each trimester of
pregnancy of all daily measurements
taken by all monitors in the district of birth
of each infant.
SO
2
(32), NO
x
(38), TSP (72)
Socioeconomic character-
istic and reproductive
\factors
District OR by increase of 50 lg/m
3
in the pollutant
concentration during the first trimester; SO
2
:
1.20 (1.11–1.30); TSP: 1.15 (1.07–1.24).
When the exposure was during the second
and third trimester the association was
weaker although significant for SO
2
and TSP
Further adjustment for gestational age elimi-
nated the effects of SO
2
but not those of TSP.
NO
x
which were not significantly associated
with LBW
No association with IUGR was observed
187
Table 2. (Continued)
Authors,
year,
[reference]
Design Study population:
setting, period and
number
Outcome
a
Exposure, pollutants
(levels in lg/m
3
, mg/m
3
for CO)
Control
variables
Level of
comparison
b
Results: OR/RR (95% CI)
c
Dejmek et al.,
2000
[3]
Geographical Teplice District (TD)
and Prachatice
District (PD),
Czech Republic.
1994–1998
n (TD) = 3378
n (PD) = 1505
Intrauterine growth
retardation
Ambient daily levels PM
10
(47.6) and PM
2.5
(35.6)
Averages for 9 consecutive 30 day period
after estimated date of conception for PM
10
(47.7; tertile: < 40, 40–50, !50) and PM
2.5
(35.7; <27, 27–37, !37)
Sociodemographic
characteristics,
reproductive factors,
alcohol and tobacco
habits of parents, and
maternal passive
smoking
Newborn TD first month of gestation.
PM
10
: OR 2nd tertile: 1.44 (1.03–2.02),
OR 3rd tertile: 2.14 (1.42–3.23)
PM
2.5
: OR 2nd tertile: 1.38 (0.95–1.95)
OR 3rd tertile: 1.9 (0.49–2.46)
PD first month of gestation
PM
10
: OR 2nd tertile: 2.11 (1.03–4.33),
OR 3rd tertile: 1.9 (0.49–2.46)
Dolk et al.,
2000
[54]
Geographical 275,347 residents near
coke works Great
Britain (GB),
1981–1992
Low birth weight Areas 0–7.5 km (0–2 km for highest
exposure) from plant vs. regional rates in
GB
Year, sex and
deprivation score
and region
Areas near coke
works vs. control
areas
There was no evidence of an increased risk
of low birth weight
Rogers et al.,
2000
[2]
Population based
case-control
study
143 mothers of very
low birth weight
babies and 202
controls Atlanta,
Georgia 1986–1988
Very low birth weight
(<1500 g)
The exposure estimates were based on
annual TSPSO
2
(TSP + SO
2
)(lg/m
3
)
emissions data from 32 industrial facilities.
Median of TSPSO
2
in the study area:
9.94 lg/m
3
Socioeconomic
characteristics, race,
alcohol and drug
consumption, active
and passive cigarette
smoking, urban and
rural residence
Newborn TSP and SO
2
levels (lg/m
3
)
<9.94: 1 (median of TSPSO2 levels
for the controls),
9.94–25.18: 0.99 (0.51–1.72)
25.18–56.75: 1.27 (0.68–2.37)
>56.75: 2.88 (1.16–7.13)
SO2 (14.38 vs. 3.80 (lg/m
3
): 1.49 (0.77–2.89),
TSP (43.60 vs. 5.93 (lg/m
3
): 2.36 (0.88–6.28)
Bobak et al.,
2001
[56]
Cross-sectional 5362 live births in
England, Scotland
and Wales.
During 1 week in
March 1946
Birth weight Air pollution index in four pollution groups
based on domestic coal consumption per
square mile. Mean annual concentrations
of: smoke: 67, 138, 217, 281; SO
2
90, 130,
191, 257
Socioeconomic and
characteristics
geographical region,
reproductive factors.
Four air pollution
groups
Significant differences in mean birth weight
(in grams) between air pollution groups
Ha et al.,
2001 [20]
Geographical 276,763 singleton
births in Seoul,
South Korea
1996–1997
Low birth weight
among all full-term
births (37–44 weeks of
pregnancy)
Twenty-fifth, 50th and 75th percentiles of
air pollutants concentration of the first
trimester of pregnancy: CO: 1.1, 1.3, 1.6;
NO
2
: 57.9, 63.2, 66.6; SO
2
: 28.6, 37.8, 46.3;
TSP: 76.7, 82.3, 91.0; O
3
: 31.2, 44.8, 58.4
The levels of air pollutants of the third
trimester were similar
Socioeconomic
characteristics,
reproductive factors
and concentration of
each air pollutant in
the other trimester of
pregnancy
Newborn Association for each interquartile increase
in exposure in the first trimester: CO 1.07
(0.99–1.17); NO
2
1.08 (1.02–1.14)
SO
2
1.07 (0.98–1.17); TSP 1.04 (1.00–1.08);
O
3
0.96 (0.87–1.07).
No significant associations with air
pollutants in third trimester of pregnancy
Lin et al.,
2001a
[57]
Geographical 2545 first-parity and
singleton live birth in
two areas in Taiwan,
1993–1996
Low birth weight Annual geometric mean for 1995
(petrochemical area vs. control area): SO
2
(17.3 vs. 5.5); NO
2
(22.7 vs. 16.1); PM
10
(85.9 vs. 59.2)
Socioeconomic
characteristics, season
and infant sex
Exposed area vs.
control area
OR 1.77 (1.00–3.12)
Maisonet et al.,
2001
[1]
Geographical Singleton term live births
(37–44 weeks of gesta-
tion) in six north-eastern
cities of the USA, 1994–
1996 n = 89,557
Low birth weight Twenty-fifth, 50th and 75th percentiles of air
pollutants concentration of the third trimester
of pregnancy: CO: 1.1, 1.2, 1.4; SO
2
: 16.6, 24.2,
33.7; PM
10
: 24.7, 30.2, 35.6. The levels of air
pollutants in the three trimesters were similar
Socioeconomic charac-
teristics, race or ethni-
city, season, reproductive
factors, smoking, and al-
cohol consumption
Newborn OR by increase of 1 ppm in CO concentration
during the third trimester of pregnancy 1.31
(1.06–1.62).
Second trimester exposures to SO2 at levels
above 18.9 lg/m
3
increase the risk.
There were no associations with exposure to
PM
10
.
188
Table 2. (Continued)
Authors,
year,
[reference]
Design Study population:
setting, period and
number
Outcome
a
Exposure, pollutants
(levels in lg/m
3
, mg/m
3
for CO)
Control
variables
Level of
comparison
b
Results: OR/RR (95% CI)
c
Maroziene and
Grazuleviciene,
2002
[11]
Geographical 3988 singleton births,
City of Kaunas,
Lituania, 1998
Low birth weight Annual mean of formaldehyde (3.14) and
NO
2
(11.69)
Socioeconomic
characteristics,
reproductive factors,
parental smoking,
season and other air
pollutant
Newborn OR by increase of 10 lg/m
3
in NO
2
levels:
annual exposure 1.28 (0.97–1.68);
3rd trimester of pregnancy 1.32 (0.92–1.91)
OR by increase of 5 lg/m
3
in formaldehyde
levels: annual exposure 1.36 (0.75–2.47);
1st trimester of pregnancy 2.39 (1.07–5.32)
Perera et al.,
2003
[12]
Prospective
cohort
263 non-smoking
African American and
Dominican women
(cotinine¼25 ng/ml),
ages 18–35.
New York City
Birth weight Polycyclic aromatic hydrocarbons (PAH)
personal air sampling during the
3rd trimester of pregnancy average
3.7 ng/m
3
range (0.36–36.47 ng/m
3
)
Body mass index,
parity, gestational age
and infant sex,
cotinine and plasma
levels of chlorpyrifos
Mother-Newborn Interaction between PAH exposure during
the third trimester of pregnancy and
ethnicity.
Among African American prenatal
exposure to PAH was associated with lower
birth weight (b = )0.10, p = 0.02).
After adjusting for other PAH sources
(dietary PAH and environmental tobacco
smoke as measured by cotinine) the
associations between PAH and birth
outcomes remained significant
Wilhem et al.,
2003
[58]
Case-control
nested in a
cohort
3771 cases with low
birth weight born at
term and 26,351
controls. Los Angeles,
California, 1994–1996
Low birth weight Distance weighted traffic density measure.
Annual average of CO, PM
10
,O
3
and NO
2
in quartiles: CO (< 1.5, 1.5–1.9, 2.0–
2.3, ‡ 2.4); PM
10
(<36.19, 36.19–41.11,
41.12–42.78, ‡ 42.79), NO
2
(<60.54, 60.54–
81.78, 81.97-85.54, ‡ 85.73), O
3
(<35.4,
35.4–36.0, 36.2–47.4, ‡ 47.6)
Socioeconomic
characteristics, race/
ethnicity,
reproductive factors,
season, and year of
birth
Newborn Distance weighted traffic density measure
Annual exposure: !Percentile 80:
OR adj. 1.14 (CI 95% 1.00–1.29) p trend
>0.05).
Third trimester of pregnancy autumn/
winter (birth month January June).
! Percentile 80: OR adj. 1.39 (CI 95%
1.16–1.67) p trend <0.05)
By air pollutant
OR by increase of 1 ppm in CO levels 1.19
(1.00–1.42), None significant associations
with, PM
10
,O
3
and NO
2
Yang et al.,
2003
[59]
Geographical 13,396 singleton
live births,
mother’s first
delivery,
Kaohsiung city,
Taiwan,
1995–1997
Low birth weight Tertiles (33rd and 67th) by
trimester of pregnancy.
1st trimester:
SO
2
(26.02, 36.07); PM
10
(62.43, 100.44)
2nd trimester:
SO
2
(25.76, 35.63);
PM
10
(59.22, 98.64)
3rd trimester
SO
2
(25.39, 36.96);
PM
10
(61.98, 100.91)
Socioeconomic
characteristics,
season, infant
gender
Newborn SO
2
> 36.7 vs. <26.02 lg/m
3
during the
1st trimester of pregnancy: associated with a
reduction in birth weight of 18.11 g (95% CI,
1.88–34.34).
An increase in SO
2
of 1 lg/m
3
in the 1st
trimester was associated with a significant
reduction in the mean of birth weight 0.52 g
(95% CI 0.09–0.63) grams.
An increase in PM
10
of 1 lg/m
3
in the 1st was
associated with a reduction in the mean of
birth weight of 0.52 g (95% CI, 0.19–0.85).
a
Reproductive outcomes definitions: low birth weight (<2500 g); Very low birth weight (<1500 g); intrauterine growth retardation ((birth weight <10th percentile by gender and gestational week).
b
Information at the individual level.
c
Relative risk or odds ratio (and 95% CI) as in the original study.
189
Table 3. Studies evaluating the relationship between prematurity and exposure to ambient air pollution
Authors,
year
[reference]
Design Study population:
Setting, period
and number
Outcome
a
Exposure, pollutants (levels
in lg/m
3
, mg/m
3
for CO)
Control variables Level of
comparison
b
Results: OR/RR (95% CI)
c
Xu et al,
1995
[30]
Prospective
cohort
25,370 women in
Beijing, China, who
gave first live births in
1988
Prematurity and
gestational age
Annual mean concentrations of SO
2
and
TSP (average 24 h)
Dongcheng district:
SO
2
108 (SD = 141) lg/m
3
,
TSP 350 (SD = 172) lg/m
3
Xicheng district:
SO
2
93 (SD = 122) lg/m
3
,
TSP 390 (SD = 180) lg/m
3
Quintiles of
temperature and
humidity, day of
week, season,
residential area,
maternal age, and
infant gender
Newborn The regression coefficients for both SO
2
and
TSP increased with the number of lag days,
reached the maximum at 7 and 8 lag days,
and decreased thereafter.
Gestational age
For each 100 lg/m
3
increase in:
SO
2
: length of gestation was reduced in
0.075 weeks (12.6 h)
TSP: length of gestation was reduced in
0.042 weeks (7.1 h)
The TSP effect was 4.5 fold greater in
winter than in summer.
Prematurity
OR for each ln lg/m
3
increase in
SO
2
1.21 (1.01–1.45) and
TSP 1.10 (1.01–1.20)
Landgren,
1996
[26]
Geographical Malmo
¨
hus county,
Sweden, 1985–1990.
n: 38718
Prematurity and very
sort gestational
duration
Mean concentration of SO
2
(8.0),
hydrocarbons (6.6) and NO (14.7) by
municipality
Year of birth,
maternal age and
parity
Municipality No associations with air pollutants
Bobak,
2000
[24]
Geographical 108,173 singleton live
births of 67 districts
in Czech Republic,
1990–1991
Prematurity Arithmetic means in each trimester of
pregnancy of all daily measurements taken
by all monitors in the district of
birth of each infant: SO
2
(32), NO
x
(38),
TSP (72)
Socioeconomic
factors, parity, month
of birth
District OR by increase of 50 lg/m
3
in the pollutant
concentration during the first trimester:
SO
2
1.27 (1.16–1.39); TSP 1.18 (1.05–1.31);
NO
x
1.10 (1.00–1.21)
When the exposure was during the second and
third trimester the association was weaker,
although significant, for SO
2
and TSP
Ritz et al.,
2000
[10]
Geographical 97,158 singleton
births (26–44 weeks of
gestation) born in
Southern California,
within 2 miles of one
monitoring station,
1989–1993
Prematurity CO (average 1 h between 6 am and 9 am);
PM
10
(average 24h); O
3
: (average 1 h
between 9 am to 5 pm); NO
2
average 24 h)
Six weeks before birth:
CO
-
(2.99); PM
10
(47.5); O
3
(73.8);
NO
2
(77.6)
First month of pregnancy :
CO (3.09); PM
10
(49.3); O
3
(73.8);
NO
2
(80.5)
Socioeconomic
characteristics, race,
reproductive factors,
infant gender, tobacco
smoking during
pregnancy, season of
birth or conception
and multiple
pollutants
Newborn OR by increase of 50 lg/m
3
in PM
10
:
Six weeks before birth: 1.19 (1.01-1.40),
First month of pregnancy: 1.12 (0.97-1.29);
OR by increase of 3.44 mg/m
3
in CO:
Six weeks before birth: 1.05 (0.97–1.12)
First month of pregnancy: 1.03 (0.96–1.10)
Lin et al.,
2001b
[60]
Geographical 543,098 first-parity
and singleton live
birth in two areas in
Taiwan, 1993–1996
Prematurity An exposed area to petrochemical air
pollution vs. control area
Socioeconomic
characteristics, season
and infant sex
Exposed area vs.
control area
OR 1.41 (CI 95%, 1.08–1.82)
Maroziene and
Grazuleviciene,
2002
[11]
Geographical 3988 singleton births
City of Kaunas,
Lituania, 1998
Prematurity Annual mean of formaldehyde (3.14) and NO
2
(11.69)
Socioeconomic charac-
teristics, parental smok-
ing, season, parity and
other air pollutant
Newborn OR by increase of 10 lg/m
3
in NO
2
levels
annual average exposure 1.25 (1.07–1.46); 1st
trimester of pregnancy 1.69 (1.28–2.23)
190
Table 3.(Continued)
Authors,
year
[reference]
Design Study population:
Setting, period
and number
Outcome
a
Exposure, pollutants (levels
in lg/m
3
, mg/m
3
for CO)
Control variables Level of
comparison
b
Results: OR/RR (95% CI)
c
Yang et al.,
2002
[63]
Geographical 57,127 singleton and
first-parity births,
5338 in exposed area
and 51,789 in
non-exposed area,
1993–1996
Prematurity An area exposed to petrochemical air
pollution vs. control area
Socioeconomic
characteristics and
season
Exposed area vs.
control area
1.18 (CI 95%, 1.04–1.34)
Tsai et al.,
2003
[61]
Geographical 64,215 singleton
deliveries and first
parity births in two
areas in Taiwan:
14 545 births in
industrial area;
49,670 in control area,
1994–1997
Prematurity Exposed area: 2 km radius around multiple
sources of industrial complexes. Air
pollutant levels are not indicated
Socioeconomic
characteristics, infant
gender, season, place
of birth
Newborn OR 1.11 (CI 95%, 1.02–1.21)
Woodruff et al.,
2003
[62]
Geographical 4,098,740 singleton
birth in 48 contiguous
states in USA,
1998–1999
Prematurity and small
for gestational age
(SGA)
Air pollution index representing long-term
exposure to the five criteria pollutants (five-
point scale); The authors used the following
measures for each of the pollutants:
PM
10
,SO
2
,NO
2
,: annual mean of the
average 24 h;
O
3
: annual mean of the maximum 1- hr
value per day;
Socioeconomic
characteristics, race/
ethnicity, region
Country Prematurity
OR by unit increase in air pollution index
1.04 (1.00–1.08)
OR highest decile of index 1.05 (0.99–1.12).
None association with SGA
CO: annual mean of the highest 8- hr period
for each day
Wilhem et al.,
2003
[58]
Case-control
nested in a
cohort
3509 preterm
infants with low
birth weight and
13,464 preterm totals
and 21,124 controls.
Los Angeles, California,
1994–1996
Prematurity Distance weighted traffic density measure.
Annual average of CO, PM
10
,O
3
and
NO
2
in quartiles: CO (<1.5,1.5–1.9,
2.0–2.3, ‡ 2.4); PM
10
(<36.19,
36.19–41.11,41.12–42.78, ‡ 42.79),
NO
2
(<60.54, 60.54–81.78,
81.97–85.54, ‡ 85.73),
O
3
(<35.4, 35.4–36.0, 36.2–47.4, ‡ 47.6)
Socioeconomic
characteristics,
race/ethnicity,
reproductive
factors, season, and
year of birth
Newborn Distance weighted traffic density measure:
Annual exposure: ‡ percentile 80: 1.08 (CI 95%,
1.01–1.15),
Third trimester of pregnancy autumn/winter
(birth month January June):
‡ Percentile 80: 1.15 (CI 95%, 1.05-1.26)
p trend < 0.05).
By air pollutant:
OR by increase of 1 ppm in CO levels
1.11 (CI 95% 1.01–1.15),
No significant associations with PM
10
,O
3
and NO
2
a
Reproductive outcomes definitions: Prematurity ( < 37 weeks of gestation); very sort gestational duration ( < 32 weeks); Small for gestational age ( birth weight less than the 10th
percentile at each week of gestational age).
b
Information at the individual level.
c
Relative risk or odds ratio (and 95% CI) as in the original study.
191
lighted that the possibility of respiratory infections
associated with the inhalation of air pollutants during
pregnancy could be a causal factor of premature
delivery [30].
(2) Viscosity increa se of blood and of plasmatic
fibrogen due to inflammatory processes of peripheral
air ways associated with air pollution [31], this could
lead to an alteration of the umbilical and placental
blood flow, tranplacental glucose and total insulin,
which determine foetal growth [11, 24, 32–34].
(3) Diminution of the provision of oxygen in the
uterus, as a result of a diminution in the capability of
transporting oxygen due to an increase of carboxy-
hemoglobin as a consequence of acute or chronic
exposure to carbon monoxide [20].
(4) The foetal toxicity of exposure to polycyclic
aromatic hydrocarbons (PAH) has been associated
with effects on DNA or its transcription, through the
formation of PAH–DNA adducts [11, 24, 33], which
may result in the activation of the apoptosis [34], or
the binding to receptors of placental growth factors,
resulting in the decreased exchange of oxygen and
nutrients [3].
(5) High exposure near to the end of gestation
may cause disturbances of the pituitary-adrenocor-
tico-placental system [35], with possible anti-estro-
genic effects which may lead to a foetal toxicity [4].
(6) NO
2
is capable of oxidising tissue components
(e.g., proteins and lipids) and of eliminating the
anti-oxidising protect ive systems of the organism.
Increased lipidic peroxidation in the maternal or
foetal compartment has been associated to prematu-
rity. It has been observed in experimental studies that
NO
2
during pregnancy induces lipid peroxidation in
the placenta, high post-implantation embryonic
lethality, and disturbances of postnatal development
[36].
(7) The pathogenesis of IUGR is produced by an
abnormal reaction between the trophoblast and the
uterine tissues within the first weeks of gestation,
therefore, an alteration of growth may result from
a suboptimal placentation and maternal hemody-
namic maladaptation [37] which could be due to
exposure to air pollutants during the first month of
gestation [3].
Congenital defects
Only in two articles associ ation between exposure to
air pollutants and the risk of congenital defects has
been evaluated [9, 38]. In the study by Dummer et al.
[38] mortality by congenital defects in areas close to
incinerators and crematoriums is studied; observing
an increase of risk in both areas (see Table 4).
In another study, Ritz et al. [9], in the cohort
of neonates and foetuses delivered in southern Cali-
fornia in 1987–1993, observed an increase of risk of
cardiac anomalies with the exposure to CO and O
3
during the second month of gestation, period which
coincides with the genesis of the heart. Adjusted odds
ratios at levels of CO ‡ 2.60 mg/m
3
was 2.84 (1.15–
6.99) for defects in the ventricular wall; and at levels
of O
3
‡ 57.2 lg/m
3
was 2.51 (0.99–6.37) for valve and
aorta artery defects. This study may be considered as
an important referent due to the strong association
found, as well as for its population-based character-
istics, accounting for a large number of individuals
under study, availability of wide coverage covariables
at individual level and examining vulnerable periods
of gestation.
Intrauterine and infant mortality
Foetus and infant mortality forms a group of serious
effects which has been related to exposure to air
pollution during pregnancy and early stages of life.
Among the 10 studies identified, 2 have evaluated
intrauterine mortality (stillbirth after week 28) as
outcome, 5 have studied the relationship of exposure
to air pollution with infant mortality (during the first
year of life) and the remaining 3 have included dif-
ferent outcomes from the other two groups.
A summary of these studies is provided in Table 4.
Different designs have been used but, given the low
frequency of the outcomes being studied; the infor-
mation has been obtained in all cases from public
registers and statistics. In seven studies a comparison
using aggregated population data was carried out,
four of them performed comparisons between the
mortality rates among different geographical units and
the other three are tim e series studies which evaluated
the short term effect of the variations in the levels of air
pollutants on the number of deaths at the earliest
stages of life. Of the three studies with an individual
basis, two have used a retrospective cohort design [7,
39] and the other one, cases and controls [40].
Most studies use air pollution data from public
registers and surveillance and control systems. In two
of them exposure is evaluated based on the distance
to exact sources such as coke works [41] or inciner-
ators and crematoriums [38]. Only in the study in
Me
´
xico City air pollution measurements from a
monitoring station operated by the investigators
were used [42]. Particles (in different forms such as
TSP, PM
10
or PM
2.5
), SO
2
and nitrogen oxides have
been included in seven of the eight studies which
present data of pollutants. CO and ozone have been
included in two of the time series studies. In the
study in Sweden [26] the possible effect of hydro-
carbons was examined and in the Sao Paulo study [8]
an index of overall pollution was developed to avoid
certain problems from correlation between pollutants
in the statistical analysis.
A common problem of these studies is that related
with errors in the measurement of exposure, mainly
due to differences between measurements from sta-
tions and real exposure of each person in a given
192
Table 4. Studies evaluating the relationship between perinatal and infant mortality and exposure to ambient air pollution
Authors,
year
[reference]
Design Study population:
Setting, period and
number
Outcome (mortality)
a
Exposure, pollutants
(levels in lg/m
3
, mg/m
3
for CO)
Control variables Level of
comparison
b
Results: OR/RR (95% CI)
c
Intrauterine mortality
Pereira et al.,
1998
[8]
Time series Sao Paulo, Brazil,
1991–1992
Daily counts of
Intrauterine mortality
(>28 WP
d
or BW
e
1000 g or
length > 35 cm)
Ambient daily levels, NO
2
(157), SO
2
(19),
O
3
(68), PM
10
(65), CO (5.7);
index of overall pollution (IOP)
Seasonality and
meteorological
variables;
all the other
pollutants
Day RR NO
2
by 10 lg/m
3
levels 5-day moving
average: 1.069 (1.025–1.113).
Significant association with IOP.
Less consistent results with PM
10
,SO
2
and
CO
Bobak and
Leon,
1999
[33]
Geographical 45 (of 85) districts in
the Czech Republic,
1986–1988.
n=223,929 births
Stillbirth: birth of a
dead infant
weighing>1000 g or
of ‡ 28 WP. Annual
prevalence
Annual geometric mean: TSP (68.5), SO
2
(31.9), NO
x
(35.1)
Sociodemographic
variables of other two
pollutants.
District No significant association with air
pollutants
Perinatal and infant mortality
Landgren,
1996
[26]
Geographical Malmo
¨
hus county,
Sweden,
1985–1990
n=38,718 births
Stillbirths
deaths during first
week of life
later infant deaths
(>1 week<1year)
Mean concentrations of SO
2
(8.0),
hydrocarbons, HC, (6.6), and NO
X
(14.7)
by municipality
Year of birth,
maternal age and
parity
Municipality No significant association with air
pollutants
Dolk et al.,
1999
[41]
Geographical Residents near coke
works Great Britain
(GB), 1981–1992
n: 275,347 births
Stillbirth
Neonatal (<1 mo)
Post neonatal
(>1 mo <1 year)
Post neonatal
Respiratory
Post neonatal SIDS
f
Areas 0–7.5 km (or 0–2 km for highest
exposure) from plant vs. regional rates
in GB
Year, sex and
deprivation score
Areas near
coke work vs.
control areas
No statistically significant positive
association unexpected result for post
neonatal Respiratory mortality in
0–7.5 km areas: SMR
g
: 0.74 (0.61–0.88)
Dummer et al.,
2003
[38]
Retrospective
cohort
Cumbria, UK
1956–1993
n: 244,758 births
Stillbirths
(>28 WP, >24 from
1/10/92)
Neonatal deaths
(<4 w of life)
Lethal congenital
anomalies (ICD9:
740-759): Neural:
anencephaly/spina
bifida; Heart; Other
A function of the distance (D)to
incinerators and crematoriums:
1/(D + 0.1)
2
Social class, year of
birth, birth order,
multiple births
Birth Incinerators OR
No association with mortality
Lethal congenital anomalies
–spina bifida: 1.17 (1.07-1.28)
–heart defects: 1.12 (1.03-1.22)
Crematoriums OR
Stillbirth: 1.04 (1.01-1.07)
Anencephaly: 1.05 (1.0-1.10
Infant mortality
Bobak and
Leon,
1992
[13]
Geographical 45 (of 85) districts in the
Czech Republic, 1986–
1988.n: 222,370 live
births
Annual mortality
rates for:
Neonatal mortality
Post neonatal
mortality
Post neonatal
respiratory mort ality
Annual level: PM
10
(69; 1st quintile:
< 53.6 5th q > 84.7), SO
2
(32), NO
x
(35)
Sociodemographic vari-
ables the other two pol-
lutants
District Neonatal mortality: non-significant
Postneonatal mortality: PM
10
: RR (5th vs. 1
quintile) = 1.42 (1.09–1.84), p for trend: 0.013
NO
X
p for trend: 0.06
Postneonatal respiratory mortality:
PM
10
: RR (5th vs. 1 quintile) = 2.41 (1.10–
5.28), p for trend: 0.013
SO2: p for trend: 0.06
193
Table 4. (Continued)
Authors,
year
[reference]
Design Study population:
Setting, period and
number
Outcome (mortality)
a
Exposure, pollutants
(levels in lg/m
3
, mg/m
3
for CO)
Control variables Level of
comparison
b
Results: OR/RR (95% CI)
c
Woodruff et al.,
1997
[7]
Retrospective
cohort
Infants born in 86
metropolitan areas in
USA, 1989–1991.n: 3
788,079
Post neonatal
mortality
(>1 m onth < 1 year):
All causes
SIDS
Respiratory deaths
All other causes
Mean of the PM
10
levels for the first
2 months of life in the area of residence at
the time of birth: PM
10
(31; tertiles:
<28, 28–40, >40)
Sociodemographic
variables, ambient
temperature
Children Significant results for All causes, SIDS and
respiratory deaths
Post neonatal; RR higher vs. lower tertil,
all causes: 1.10 (1.04–1.16)
SIDS 1.26 (1.14–1.39)/ respiratory:
1.40 (1.05-1.85),
By 10 ug/m
3
increase: respiratory:
1.20 (1.06-1.36)
Loomis et al.,
1999
[42]
Time series South western part of
Mexico City, 1993–
1995 (population: 2,5
million people; infant
deaths 942)
Daily deaths
age < 1 year
1 Monitoring station operated by the
investigators. Mean daily levels: PM 2.5
(27.8); SO
2
NO
2
(70.9); O
3
(88.2)
Seasonality and
meteorological
variables, the other
two pollutants
Day PM
2.5
:RR10lg/m
3
:
1.069 (1.025–1.113), lag 3–5, one pollutant
model,
1.063 (0.995–1.132), lag 3–5, three pollutant
model,
Less consistent results with the other
pollutants
Bobak and Leon,
1999
[33]
Matched
population
based case-
control
All infants born in
Czech Republic,
1989–1991
Cases: 2494,
controls: 25642
Neonatal mortality
(28 d)
All causes
RespiratoryPost
neonatal mortality
(28 d to 1 y)
All causes
Respiratory
Arithmetic mean of all the 24 h
measurements in the district of residence
between the birth and death of the case
TSP (71.9), SO
2
(39.1), NO
X
(40.0)
Sociodemographic
variables. Maternal
age, parity, birth
weight, birth length,
and gestational age
Children RR per 50 lg/m
3
increase in pollutant levels
Post neonatal Respiratory mortality:
TSP: 1.95 (1.09–3.50),
SO
2
: 1.74 (1.01-2.98)
Ha,
2003
[55]
Time series Seoul, Korea,
1981–1992
Post neonatal
mortality (>1 month
<1 year):
all causes,
respiratory causes
Mean daily levels:
PM
10
(69.2; IQR: 42.9
g
),
NO
2
(61.1), SO
2
(31.7),
O
3
(42.4), CO (1.7)
Seasonality and
meteorological
variables.
Autoregressive terms
Day RR for an IQR increase in the same
day levels of pollutants;
All causes
PM10: 1.14 (1.10–1.19)
SO
2
: 1.09 (1.03–1.15)
CO, NO
2
,O
3
: non significant
Respiratory mortality:
PM
10
: 2.02 (1.78–2.28)
CO: 1.39 (1.01–1.91)
SO
2
,NO
2
,O
3
: non significant
a
Mortality indicators (if different indicated in the table). (1) Intrauterine mortality (stillbirth) foetal loss at gestational age 28 weeks or more. (2) Infant mortality: deaths during the first
year of life: (a) Neonatal: 1–27 days. (i) Early: 0–6 days, (ii) Late: 7–27 days. (b) Post neonatal: 28–364 days. (3) Perinatal: intrauterine mortality plus early neonatal mortality.
b
Information at the individual level.
c
Relative risk or odds ratio (and 95% CI) as in the original study.
d
WP: weeks of pregnancy.
e
BW: Birth weight.
f
SIDS: post neonatal sudden
infant death syndrome.
g
SMR: standardized mortality ratio.
h
IQR: interquartile range.
194
area. However, when daily variances of particles be-
tween the two types of measur ements have been
compared, a high correlation was found [43]. Also, it
has been showed that the possible error in measure-
ment would lead to an underestimation of the asso-
ciation [44]. This finding may not be so clear for
gases. Thus, in a study carried out in Boston [45], a
good correlation between ambient particles and
personal exposure to particles was found together
with little correlation between ambient gaseous
pollutants and personal exposure to gases. Paradox-
ically, external concentrations of gaseous pollutants
seem to correlate well with personal exposure to fine
particles (PM
2.5
) for which the associations found
between gases and mortality could be due to exposure
to particles [45].
The pollutant levels described are very variable,
with values ranging from moderate, as those de-
scribed by Wodruff et al. [7] in the USA, to high,
typical of areas which hav e historically suffered high
pollution levels such as some districts in Czec h
Republic or cities with serious environmental prob-
lems such as Seoul or Mexico.
Nearly all studies controlled for potential con-
founders, such as social-demographic variables. Only
studies with an individual basis (and a geographical
one [26]) controlled for variables related with gesta-
tion such as maternal or gestational age. In time
series studies, in which comparison is performed day
by day on the same population, the variables to
control are those which may co-variate in time with
the outcome and/or wi th the exposure, i.e.: variables
which present seasonality or trend.
Although most studies obtained positive associa-
tions with pollution, results are not always consistent.
The most studied outcome related with exposure
during pregnancy has been stillbirth or intrauterine
mortality after 28 weeks. Only two of the five studies
which have evaluated such relationship have found
some significant association. The first one, carried out
by Pereira et al. in Sao Paulo [8], where the increases
of air pollutants (mai nly NO
2
and an overall index of
pollution) were associated to increases in the daily
number of foetuses over 28 weeks of pregnancy. SO
2
and CO also showed some but less consistent rela-
tionship with intrauterine mortality. In this same
study a signi ficant association between the levels of
carboxyhemoglobin of umbilical blood cord and
ambient CO levels in children born from non-smok-
ing women was described, adding some evidence to
the potential for a role of air pollution in the
promotion of health effects on foetuses. Recently,
Dummer et al. [37] suggested some excess of risk for
stillbirth in women living near crematoriums but not
in areas near incinerators.
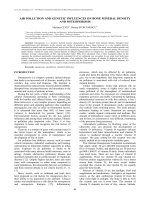
Results on the possible influence of air pollution on
the risk of dying during the first months of life are
higher and results are more consistent. Figure 3
summarises the main results of these studies for the
most frequently studied pollutants (particles, SO
2
and
NO
2
). In most of them a positive association was
found between levels of pollutants and infant mor-
0,6
0,8
1,0
1,2
1,4
1,6
1,8
PM10
SO2
NOx
PM10
SO2
NOx
PM10
SO2
NOx
PM10
SO2
NO2
PM10
SO2
NO2
PM2.5
NO2
TSP
SO2
NO2
TSP
SO2
NO2
TSP
SO2
NO2
TSP
SO2
NO2
PM10
PM10
RR/OR
Pollutant
InfantPostneonatal Postneonatal Postneonatal Postneonatal
Bobak & Leon 1992 Bobak & Leon 1999
All causes Respiratory All causes Respiratory All causes Respiratory All causes Respiratory All causes Respiratory
Cause
Geographical Time series
Loomis 1999
Ha 2003
Mortality
Study
Design
Population based case-control
Retrospective cohort
Woodruff 1997
NeonatalNeonatal
All causes All causes
Figure 3. Relative risk (and 95% CI) of death of the studies examining the association between air pollution (measured as
an increase of 10 lg/m
3
in particles, SO
2
or NO
2
) and mortality during the first year of life.
195
tality. The consistency of the estimates for particles
is worth highlighting: the coefficients obtained are
positive in all cases and significant in most of them.
The association is clearer when analysing the post
neonatal period as compared to the neonatal one.
Deaths in the early neonatal period have been asso-
ciated with exposure during pregnancy or related to
health care during delivery. Also, during this period,
the infant remains at hospital for some days, so the
measurement of the assigned exposure based on res-
idence would not be adequate [7]. All this seems
to indicate that increase in the risk of death would
be due to exposure at early stages of life but not
through intrauterine exposure. Results suggest a
specificity of the association, therefore they appear to
be clearer when analysing the impact on mortality by
respiratory causes.
Meta-analysis results from the studies which ana-
lyse post-neonatal mortality and exposure to PM
10
clearly show what we have mentioned above. The
meta-analysis included separate calculation for both,
acute exposure (i.e. time series (two studies [42, 46]))
and chronic exposure designs (three studies [7, 13,
40]) (Figure 4). For acute exposure, the combined
estimates show that a 10 lg/m
3
increase of PM
10
in
the daily levels is associated with a 3.3% (CI 95%
2.4–4.3%) acute increase in post-neonatal mortality.
This result suggests a higher increase than the one
found in time series studies on adults, in which the
magnitude of the association between total mortality
and a 10 lg/m
3
increase of PM
10
is typically situated
around 1% on [47].
On the other hand, the combined estimates of the
results of the studies which evaluate the effects of
chronic exposure showed an association with post-
neonatal mortality for all causes of 4.8% (2.2–7.5%),
which increases to 21.6% (10.2–34.2%) with post-
neonatal mortality for respiratory causes. In the
biggest cohort study in adults carried out up to now,
Pope et al. have described that a10lg/m
3
increase of
PM
2.5
is related with a 4% increased risk in all-causes
mortality [48]. Provided the ratio between PM
10
and
PM
2.5
(around 0.5 and 0.85) it could be approached
that chronic impact in post neonatal mortality by all
causes is approximately two times that among adults.
On the other hand, it is worth highlighting that the
relative impact of particles on mortality due to
chronic exposure compared with acute exposure is
smaller for infants compared with ad ults, it seems to
be only about two times higher. This may be due to
the fact that the studied period for chronic exposure
in the case of infant mortality is, by definition, of only
one year, whereas for chronic exposure among adults
the studied period is of quite more years.
It is difficult to assign specificity to an isol ated
pollutant. Taking into account their correlation and
shared sources, one of them could be a proxy of a
complex mixture. Furthermore, an additive effect
between some of the pollutan t could occur. However,
considering the results of the articles reviewed, a
clearer association with particles has been observed.
It is important to mention that, apart from the results
showed by Ha et al. [46] who describe an important
association between neonatal respiratory mortality
and CO. Furthermore, studies with children have
showed their capability of suffering respiratory and
immunoalergical disorders related to exposure to air
pollutants [49–51]. Among the physiopathological
mechanisms described, the role that metal composi-
tion of ambient fine particles could play in the
severity of allergic respiratory disease has been
highlighted [52].
0,9
1,0
1,1
1,2
1,3
1,4
1,5
1,6
1,7
Loomis
*
Ha
Combined
Bobak & Leon, 92
Woodroof
Bobak & Leon, 99
Combined
Combined
Bobak & Leon, 92
Woodroof
Bobak & Leon, 99
Postneotal (*infant) all causes
Acute exposure: Time series
Posteonatal All causes
RR/OR
Cause of Mortality
Study
Exposure: Design
Posteonatal Respiratory causes
Chronic exposure: Geographical, cohort, case-control
Figure 4. Relative risk (and 95% CI) of death of the studies examining the association between particulate air pollution
(measured as an increase of 10 lg/m
3
in PM
10
) and mortality during the first year of life.
196
Conclusions
Evidence available up to the present, shows a little
effect on foetal growth or prematurity associated with
exposure to particles (measured as PM
10
), CO, SO
2
and NO
x
.
The studies on infant mortality and exposure to
particles show an outstanding consistency in the
magnitude of the effects, regardless of the different
designs used. As a whole, it could be said that a
10 lg/m
3
increase in the daily concentration of
particles (measured as PM
10
) would be associated to
an increase of around 3% of post-neonatal mortal-
ity. Regarding chronic exposure, the same increase
in the average levels of PM
10
was associated with a
5% increase in post-neonatal mortality by all causes
and around 22% in post-neonatal mortality by
respiratory causes. These results show the higher
susceptibility of infants, not only by the magnitude
of the effect found compared to the studies among
adults, but by the time of exposure for developing a
serious damage is shorter among infants. If the
association suggested by the estimates found were
causal, the impact that exposure to air pollution
would have in terms of public health, would be
dramatically high. In the first place, for being a
worldwide risk factor to which infants of all con-
ditions can be exposed to. In the second place,
because behind the death of an infant underlies a
very serious concern in terms of life expectancy or
loss of life years.
Regarding damage to foetal health during preg-
nancy due to exposure, the epidemiological evidence
is less clear. However, even if the damage is small, it is
important to highlight that prenatal stage exposure
may have serious consequences for adult life stages.
In this sense, weight at birth seems to be quite sen-
sitive to the toxic effect of air pollutants, and since it
is collected as routine in birth registers, it could be
used as a sentinel event, as health indicator for the
surveillance of environmental risks [54].
As we have mentioned before, in most studies, the
evaluation of exposure was carried out assigning the
levels of air pollutants reported by the air pollution
monitoring stations regarding their proximity to
mother, or infant, residence. Only in the study by
Perera et al. [12] was exposure evaluated through
personal monitoring. Therefore, more prospective
studies using personal monitoring of different air
pollutants or identifying different biomarkers of
exposure (e.g. DNA adducts by PAH exposure) are
required to evaluate the impact of each pollutant on
reproductive health in different periods of pregnancy.
Acknowledgements
This project was supported by the Spanish Ministry
of Health, Thematic Research Net. ‘Childhood and
Environment’ (03/176), FIS 03/1615 and by the
Health Council of the Generalitat Valenciana (PI017/
2003).
References
1. Maisonet M, Bush TJ, Correa A, Jaakkola JJ. Relation
between ambient air pollution and low birth weight
in the northeastern United States. Environ Health
Perspect 2001; 109 (Suppl) (3): 351–356.
2. Rogers JF, Thompson SJ, Addy CL, McKeown RE,
Cowen DJ, Decoufle
´
P. Association of very low birth
weight with exposures to environmental sulfur dioxide
and total suspended particles. Am J Epidemiol 2000;
151: 602–613.
3. Dejmek J, Solansky I, Benes I, Lenicek J, Sram RJ.
The impact of polycyclic aromatic hydrocarbons and
fine particles on pregnancy outcome. Environ Health
Perspect 2000; 108: 1159–1164.
4. Bui QQ, Tran MB, West WL. A comparative study of
the reproductive effects of methadone and benzo[a]py-
rene in the pregnant and pseudopregnant rat. Toxi-
cology 1986; 42: 195–204.
5. Ribas-Fito N, Sala M, Mazo
´
n C, et al. Association of
hexachlorobenzene and other organochlorine com-
pounds with anthropometric measures and thyroid
hormone status at birth. Pediatr Res 2002; 52: 163–167.
6. Perera FP, Illman SM, Kinney PL, et al. The challenge
of preventing environmentally related disease in young
children: community-based research in New York City.
Environ Health Perspect 2002; 110: 197–204.
7. Woodruff T, Grillo J, Schoendorf KC. The relationship
between selected causes of post-neonatal infant mor-
tality and particulate air pollution in the United States.
Environ Health Perspect 1997; 105: 608–612.
8. Pereira L, Loomis DP, Conceiao GMS, et al. Associ-
ation between air pollution and intrauterine mortality
in Sao Paulo, Brazil. Environ Health Perspect 1998;
106: 325–329.
9. Ritz B, Yu F, Fruin S, Chapa G, Shaw GM, Harris
JA. Ambient air pollution and risk of birth defects
in Southern California. Am J Epidemiol 2002; 155: 17–
25.
10. Ritz B, Yu F, Chapa G, Fruin S. Effect of air pollution
on preterm birth among children born in Southern
California between 1989 and 1993. Epidemiology 2000;
11: 502–511.
11. Maroziene L, Grazuleviciene R. Maternal exposure
to low-level air pollution and pregnancy outcomes:
a population-based study. Environ Health 2002; 1: 6.
12. Perera FP, Rauh V, Tsai WY, et al. Effects of trans-
placental exposure to environmental pollutants on
birth outcomes in a multiethnic population. Environ
Health Perspect 2003; 111: 201–206.
13. Bobak M, Leon DA. Air pollution and infant mortality
in the Czech Republic, 1986–88. Lancet 1992;
340(8826): 1010–1014.
14. Der-Simonian R, Laird N. Meta-analysis in clinical
trials. Control Clinical Trials 1986; 7: 177–188.
15. Witter FR. Perinatal mortality and intrauterine growth
retardation. Curr Opin Obstet Gynecol 1993; 5: 56–59.
16. Chen SJ, Vohr BR, Oh W. Effects of birth order,
gender, and intrauterine growth retardation on the
197
outcome of very low birth weight in twins. J Pediatr
1993; 123: 132–136.
17. Luke B, Williams C, Minogue J, Keith L. The changing
pattern of infant mortality in the US: the role of pre-
natal factors and their obstetrical implications. Int J
Gynaecol Obstet 1993; 40: 199–212.
18. Spinillo A, Capuzzo E, Egbe TO, Fazzi E, Colonna L,
Nicola S. Pregnancies complicated by idiopathic
intrauterine growth retardation. Severity of growth
failure, neonatal morbidity and two-year infant neu-
rodevelopmental outcome. J Reprod Med 1995; 40:
209–215.
19. Joseph KS, Kramer MS. Review of the evidence on
fetal and early childhood antecedents of adult chronic
disease. Epidemiol Rev 1996; 18: 158–174.
20. Ha EH, Hong YC, Lee BE, Woo BH, Schwartz J,
Christiani DC. Is air pollution a risk factor for low birth
weight in Seoul? Epidemiology 2001; 12: 643–648.
21. Arnold CC, Kramer MS, Hobbs CA, McLean FH,
Usher RH. Very low birth weight: a problematic cohort
for epidemiologic studies of very small or immature
neonates. Am J Epidemiol 1991; 134: 604–613.
22. Kramer MS. Determinants of low birth weight: meth-
odological assessment and meta-analysis. Bull World
Health Organ 1987; 65: 663–737.
23. Glinianaia SV, Rankin J, Bell R, Pless-Mulloli T,
Howel D. Particulate air pollution an fetal health.
A systematic review of the epidemiologic evidence.
Epidemiology 2004; 15: 36–45.
24. Bobak M. Outdoor air pollution, low birth weight, and
prematurity. Environ Health Perspect 2000; 108: 173–
176.
25. Bhopal R, Phillimore P, Moffatt S, Foy C. Is living
near a coking works harmful to health? A study of
industrial air pollution. J Epidemiol Community
Health 1994; 48(237): 247.
26. Landgren O. Environmental pollution and delivery
outcome in southern Sweden: a study with central
registries. Acta Paediatr 1996; 85: 1361–1364.
27. Dejmek J, Selevan SG, Benes I, Solansky I, Sram RJ.
Fetal growth and maternal exposure to particulate
matter during pregnancy. Environ Health Perspect
1999; 107: 475–480.
28. Lamont RF. The role of infection in preterm labour
and birth. Hosp Med 2003; 64: 644–647.
29. Andrews WW, Hauth JC, Goldenberg RL. Infection and
preterm birth. Am J Perinatol 2000; 17: 357–365.
30. Xu X, Ding H, Wang X. Acute effects of total sus-
pended particles and sulfur dioxides on preterm deliv-
ery: a community-based cohort study. Arch Environ
Health 1995; 50: 407–415.
31. Peters A, Do
¨
ring A, Wichmann HE, Koenig W.
Increased plasma viscosity during an air pollution
episode: a link to mortality? The Lancet 1997; 349:
1582–1587.
32. Wang X, Ding H, Ryan L, Xu X. Association between
air pollution and low birth weight: a community-based
study. Environ Health Perspect 1997; 105: 514–520.
33. Bobak M, Leon DA. Pregnancy outcomes and outdoor
air pollution: an ecological study in districts of the
Czech Republic 1986–1988. Occup Environ Med 1999;
56: 539–543.
34. Wood KA, Youle RJ. The role of free radicals and
p53 in neuron apoptosis in vivo. J Neurosci 1995; 15(8):
5851–5857. Perera FP, et al. Environ Health Perspect
2003; 111: 201–206.
35. Wilhelm M, Ritz B. Residential proximity to traffic
and adverse birth outcomes in Los Angeles county,
California, 1994–1996. Environ Health Perspect
2003; 111: 207–216.
36. Tabacova S, Baird DD, Balabaeva L. Exposure to oxi-
dized nitrogen: lipid peroxidation and neonatal health
risk. Arch Environ Health 1998; 53: 214–221.
37. Duvekot JJ, Cheriex EC, Pieters FA, Peeters LL.
Severely impaired fetal growth is preceded by maternal
hemodynamic maladaptation in very early pregnancy.
Acta Obstet Gynecol Scand 1995; 74: 693–697.
38. Dummer TJ, Dickinson HO, Parker L. Adverse preg-
nancy outcomes around incinerators and crematoriums
in Cumbria, north west England, 1956–1993. J Epi-
demiol Community Health 2003; 57: 456–461.
39. Mathieu-Nolf M. Poisons in the air: a cause of chronic
disease in children. J Toxicol Clin Toxicol 2002; 40:
483–491.
40. Bobak M, Leon DA. The effect of air pollution on
infant mortality appears specific for respiratory causes
in the post-neonatal period. Epidemiology 1999; 10:
666–670.
41. Dolk H, Thakrar B, Walls P, et al. Mortality among
residents near cokeworks in Great Britain. Occup
Environ Med 1999; 56: 34–40.
42. Loomis D, Castillejos M, Gold DR, McDonnell W,
Borja-Aburto VH. Air pollution and infant mortality
in Mexico City. Epidemiology 1999; 10: 118–123.
43. Janssen NA, Hoek G, Brunekreef B, Harssema H,
Mensink I, Zuidhof A. Personal sampling of particles
in adults: relation among personal, indoor, and out-
door air concentrations. Am J Epidemiol 1998; 147:
537–547.
44. Zeger S, Thomas D, Dominici F, Samet JM,
Schwartz J, Dockery DW, Cohen AJ. Exposure mea-
surement error in time-series studies of air pollution:
concepts and consequences. Environ Health Perspect
2000; 108: 419–426.
45. Sarnat JA, Schwartz J, Catalano PJ, Suh HH. Gaseous
pollutants in particulate matter epidemiology: con-
founders or surrogates? Environ Health Perspect 2001;
109: 1053–1061
46. Ha EH, Lee JT, Kim H, et al. Infant susceptibility of
mortality to air pollution in Seoul, South Korea.
Pediatrics 2003; 111: 284–290.
47. Stieb, DM, Judek S, Burnett RT. Meta-analysis of
time-series studies of air pollution and mortality: effects
of gases and particles and the influence of cause of
death, age, and season’, J Air Waste Manag Assoc
2002; 52; 470–484.
48. Pope CA, Burnett RT, Thun MJ, Calle EE, Krewski D,
Ito K, Thurston GD. Lung cancer, cardiopulmonary
mortality, and long-term exposure to fine particulate
air pollution. JAMA 2002; 287: 1132–1141.
49. Peters JM, Avol E, Navidi W, et al. A study of twelve
Southern California communities with differing levels
and types of air pollution. I. Prevalence of respiratory
morbidity. Am J Respir Crit Care Med 1999; 159: 760–
767.
50. Gauderman WJ, Gilliland GF, Vora H, et al. Associa-
tion between air pollution and lung function growth
in southern California children: results from a second
198
cohort. Am J Respir Crit Care Med 2002; 166:
76–84.
51. Brauer M, Hoek G, Van Vliet P, et al. Air pollution from
traffic and the development of respiratory infections and
asthmatic and allergic symptoms in children. Am J
Respir Crit Care Med 2002; 166: 1092–1098.
52. Gavett SH, Haykal-Coates N, Copeland LB, Heinrich J,
Gilmour MI. Metal Composition of ambient PM2.5
influences severity of allergic airways disease in mice.
Environ Health Perspect 2003; 111: 1471–1477.
53. Ritz B, Yu F. The effect of ambient carbon monoxide
on low birth weight among children born in southern
California between 1989 and 1993. Environ Health
Perspect 1999; 107: 17–25.
54. Dolk H, Pattenden S, Vrijheid S, et al. Perinatal and
infant mortality and low birth weight among residents
near cokeworks in Great Britain. Arch Environ Health
2000; 55: 26–30.
55. Ha EH, Lee JT, Kim H et al. Infant susceptibility of
mortality to air pollution in Seoul, South Korea.
Pediatrics 2003; 111: 284–290.
56. Bobak M, Richards M, Wadsworth M. Air pollution
and birth weight in Britain in 1946. Epidemiology 2001;
16: 358–359.
57. Lin MC, Yu HS, Tsai SS, et al. Adverse pregnancy
outcome in a petrochemical polluted area in Taiwan.
J Toxicol Environ Health 2001a; 63: 565–574.
58. Wilhelm M, Ritz B. Residential proximity to traffic and
adverse birth outcomes in Los Angeles county, Cali-
fornia, 1994–1996. Environ Health Perspect 2003; 111:
201–216.
59. Yang CY, Tseng YT, Chang CC. Effects of air pollu-
tion on birth weight among children born between 1995
and 1997 in Kaohsiung, Taiwan. J Toxicol Environ
Health 2003; 66: 807–816.
60. Lin MC, Chiu HF, Yu HS, et al. Increased risk of
preterm delivery in areas with air pollution from a
petroleum refinery plant in Taiwan. J Toxicol Environ
Health 2001b; 64: 637–644.
61. Tsai SS, Yu HS, Liu CC, Yang CY. Increased inci-
dence of preterm delivery in mothers residing in an
industrialized area in Taiwan. J Toxicol Environ
Health 2003; 66: 987–994.
62. Woodruff TJ, Parker JD, Kyle AD, Schoendorf KC.
Disparities in exposure to air pollution during pregnancy
Environ Health Perspect 2003; 111: 942–946.
63. Yang CY, Chiu HF, Tsai SS, Chang CC, Chuang HY.
Increased risk of preterm delivery in areas with cancer
mortality problems from petrochemical complexes
Environ Res 2002; 89: 195–200.
Address for correspondence: Marina Lacasan
˜
a Navarro,
Center for Environmental Health, National Institute of
Public Health, Av Universidad, 655 62100, Cuernoveco,
Mor. Mexico
Phone: +52-777-3293000, ext 3377; Fax: +52-777-3111148
E-mails: ,
199