Báo cáo khoa học: Space, time and nitric oxide – neuronal nitric oxide synthase generates signal pulses pptx
Bạn đang xem bản rút gọn của tài liệu. Xem và tải ngay bản đầy đủ của tài liệu tại đây (414.31 KB, 12 trang )
Space, time and nitric oxide – neuronal nitric oxide
synthase generates signal pulses
John C. Salerno
1
and Dipak K. Ghosh
2
1 Biology Department, Kennesaw State University, GA, USA
2 Department of Medicine, Hematology and Oncology, Duke University and Veterans Affairs Medical Center, Durham, NC, USA
Introduction
Biological signaling takes place across spatial and tem-
poral regimes spanning many orders of magnitude,
and has applications in development, homeostasis,
neuroscience and environmental studies. Signaling and
control theories have been extensively developed by
electrical engineers and mathematicians [1]. Their work
underlies the design of many of the artifacts of our civ-
ilization, and is as germane to signaling and control in
biology as it is to data transmission in a shielded cable
or feedback control of temperature in a building. The
stability of positive and negative feedback loops in bio-
logical systems is governed by the same mathematical
principles, which place stringent requirements on the
gain and time response of components; this has
become recognized in computational biology [2] but is
not often considered in biochemistry.
Signal transduction is a developing area of explo-
sive growth; in contrast, enzymology is, by any rea-
sonable standard, a mature field. Classic descriptions
of activity (Michaelis–Menten [3], Cleland [4] and
King-Altman [5]) rely on formalisms explicitly depen-
dent on steady-state assumptions. The incremental
development of powerful analytical approaches has
contributed greatly to the understanding enzymes in
the steady-state, providing excellent descriptions of
the ‘enzymes of mass conversion’ functioning in the
interconversion of metabolites in biochemical path-
ways.
Signaling enzymes are well known and intensively
studied [6,7]. Signal generators differ from ‘metabolic
enzymes’ in that, in addition to performing chemistry,
they also transfer information. Steady-state mass con-
Keywords
autoinhibition; diffusion; nitric oxide; nitric
oxide synthase; pulse signaling
Correspondence
J. C. Salerno, Biology Department,
Kennesaw State University, 1000
Chastain Road, Kennesaw, GA 30144,
USA
Fax: +1 770 423 6625
Tel: +1 770 423 6177
E-mail:
(Received 23 June 2009, revised 4
September 2009, accepted 15 September
2009)
doi:10.1111/j.1742-4658.2009.07382.x
The temporal aspects of signaling are critical to the function of signals in
communications, feedback regulation and control. The production and
transduction of biological signals by enzymes comprises an area of central
importance and rapid progress in the biomedical sciences. Treatment of sig-
naling enzymes almost universally employs steady-state analyses that are
suitable for mass catalysis but inappropriate for components in an informa-
tion channel or a feedback ⁄ control system. In the present study, we show
that, at 37 °C, neuronal nitric oxide synthase (EC 1.14.13.39) is progres-
sively inhibited by the formation of an inhibited state during the first few
turnovers (approximately 200 ms) after the initiation of catalysis, leading
to pulse formation of nitric oxide. The general mechanism may be of wide
importance in biological signaling.
Abbreviations
BH4, tetrahydrobiopterin; BTP, bis-tris propane; CaM, calmodulin; eNOS, endothelial nitric oxide synthase; iNOS, inducible nitric
oxide synthase; NHA, N-hydroxy arginine; nNOS, neuronal nitric oxide synthase; NOS, nitric oxide synthase; sGC, soluble guanylate cyclase.
FEBS Journal 276 (2009) 6677–6688 ª 2009 The Authors Journal compilation ª 2009 FEBS 6677
version is the product of time and steady-state rate. By
contrast, information transfer in the unmodulated
steady-state is zero because information transfer
depends on bandwidth [8]. Almost all work on signal
transducing enzymes treats them as steady-state cata-
lysts. This is adequate only when the time regime is
long and information transfer is slow.
Nitric oxide synthases (NOS) are signal generators
in such diverse physiological processes as the control
of vascular tone [9,10], signal transduction in the cen-
tral nervous system [11–13] and the immune response
[14–16]. NOS (EC 1.14.13.39) generates NO from
l-arginine, consuming 2 mol of O
2
and 1.5 mol of
NADPH (three electrons) per mol of NO, and forming
citrulline with N-hydroxy arginine (NHA) as an inter-
mediate. NO production by endothelial (eNOS) and
neuronal (nNOS) isoforms is regulated by calmodulin
(CaM) via the control of electron input to the catalytic
site [17]. NO activates soluble guanylate cyclase (sGC)
and affects many other sites [18,19].
Recent developments in NO signaling implicate
important secondary targets in addition to sGC [19].
The steady-state diffusion profiles of NO are notable
for their shallow spatial gradients, enabling NO pro-
duced by eNOS to serve as a paracrine signal [20].
NOS isoforms nonetheless target distinct receptors in
nearby cells or even in the same cell [20]. One of us
recently suggested that the effective range of diffusion
is limited by time-dependent signal production [21].
Measurement of NO formation on a millisecond time
scale is difficult. However, the observation of heme
intermediates provides an avenue for investigation of
the time dependence of NO synthesis.
Results
Global model and NO inhibition
The product NO inhibits NOS [22]. In iNOS and
eNOS, inhibition is largely relieved by NO scavengers
(e.g. hemoglobin) [23]; relief by scavengers is less effec-
tive in nNOS. Santolini et al. [24,25] proposed a sim-
plified ‘global model’ that accounts for the major
features of NO inhibition. The core of this model pos-
its that quasi-geminate NO binds to ferriheme before
escaping the active site. Ferriheme NO (FeIII–NO) is
unstable but, if an additional electron is delivered from
FMN before NO escapes, stable ferrous NO forms. As
shown in Fig. 1, FeIII–NO reduction and NO release
partition the cycle at each turnover; relief of inhibition
proceeds primarily by reaction with O
2
[24,26]. Strictly
speaking, the rate constants in Fig. 1 connect rapid
reaction segments, and not individual states. These
reactions segments will be denoted here by the letters
A–H, partly to emphasize this, but also because the
reaction segments are characterized by different argi-
nine derivatives and the states of the biopterin cofac-
tors. Ignoring this point leads to errors in chemistry.
The scheme shows the most significant states but omits
the reaction intermediates and alternative states.
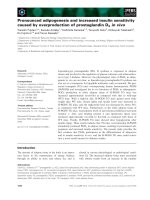
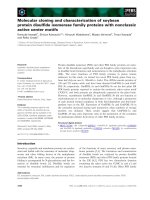
The cycle begins with the reduction of ferriheme
(FeIII) (segment A) to ferroheme (FeII) (segment B),
followed by O
2
binding (leading to the initial FeII–O
2
complex; segment C). The first oxygenase reaction
forms NHA and FeIII (segment D); a second heme
reduction (moving the system to segment E) triggers
oxygen binding (forming the second FeII–O
2
complex;
segment F) and, subsequently, a second oxygenase
reaction, forming NO and citrulline (initially present
primarily as FeIII–NO; segment G). O
2
binding and
subsequent catalytic steps in both reactions are rapid
compared to electron transfer. Because of differences
in the rate constants between isoforms, nNOS is more
sensitive to quasi-geminate NO inhibition, and is
approximately 80% inhibited when turning over in
steady-state at 10 °C at high O
2
tension ( 100 torr)
[24].
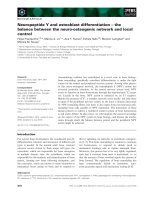
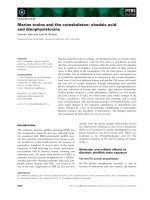
Reasonable projection of rate constants to 37 °C
suggests that nNOS produces short ( 140 ms) pulses
of NO [21]; simulations during the first second of
catalysis are provided in Fig. 2. The differential equa-
tions describing this model are presented in Fig. S1.
Progressive formation of FeII–NO (segment H) causes
a decay of NO production after the first turnover. The
sharp peak in NO production depends on the progres-
sive formation of inhibitory FeII–NO. Therefore, the
hypothesis of pulsatile NO production at 37 °C can
Fig. 1. Schematic of reaction cycle for NO synthesis [27]. Rapid
reaction segments are labeled by characteristic states. All states
are saturated with arginine or N-OH arginine (starred states), except
the NO complexes, which are initially formed with citrulline bound.
Rate constants k
1
, k
4
and k
8
correspond to heme reduction; k
2
and
k
5
correspond to oxygen binding; and k
3
and k
6
correspond to cata-
lytic steps. k
7
and k
9
correspond to the release of NO from ferric
and ferrous enzyme, and k
10
corresponds to the reaction of the
ferrous NO complex with oxygen. The long-lived FeII–NO complex
is inhibitory.
Space, time and nitric oxide J. C. Salerno and D. K. Ghosh
6678 FEBS Journal 276 (2009) 6677–6688 ª 2009 The Authors Journal compilation ª 2009 FEBS
be critically tested by examining the formation of
FeII–NO during the first few turnovers.
Spectra of intermediates
As indicated in the preceding section, heme species
with distinct spectra appear during catalysis. These
include high spin ferriheme, ferroheme and ferroheme
O
2
(each with either arginine or NHA); ferriheme NO;
and ferroheme NO in the presence of citrulline (as
formed) or arginine (after exchange). High spin ferri-
heme has a broad Soret band near 395 nm [27], shift-
ing to 410 nm on reduction and 419 nm as the O
2
adduct at low temperature [28]. Ferroheme O
2
formed
after initiation of turnover at 10 °C has a Soret band
at 427 nm [29]. In arginine-saturated eNOS, the ‘heme-
oxy II’ species has absorbance maxima near 432, 564
and 597 nm, but, with NHA bound, ferrous O
2
peaks
are significantly blue shifted to 428, 560 and 593 nm
[30]. In nNOS, ferric NO with arginine has a Soret
maximum at 440 nm and has been reported to be simi-
lar to N-OH arginine; ferrous NO was reported with a
Soret peak at 436 nm and a visible transition at
567 nm [31].
As shown in Fig. S2, we observed similar species.
We also prepared ferrous NO complex with saturating
arginine and with 1 mm citrulline. The ternary ferro-
heme–arginine–NO complex is identical to the species
described by Wang et al. [31] with a Soret peak at
436 nm. The spectrum of the ferrous–citrulline–NO
complex is very similar (Fig. S2, inset), allowing use of
total FeII–NO in simulations. Obvious changes in the
trough of the Soret difference spectra are caused by
low spin ⁄ high spin thermal equilibrium in citrulline-
saturated NOS.
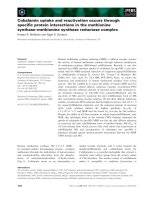
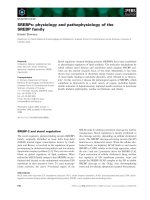
Figure 3 (upper trace) shows a difference spectrum
obtained by subtracting the spectrum of nNOS,
NADPH and arginine from the spectrum of nNOS,
NADPH and arginine, 1 s after initiation of turnover
in air-saturated buffer ( 150 torr O
2
). The lower trace
in Fig. 3 shows a difference spectrum of ferroheme
NO of nNOS oxygenase domain minus the nNOS oxy-
genase with arginine. The Soret and 567 nm bands are
marked with arrows. Clearly, the majority species
formed during turnover at 37 °C is ferroheme NO,
accounting for 74 ± 7% of total heme.
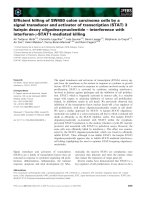
Figure 4 shows the results of stopped flow experi-
ments measuring the absorbance at 440 nm (lower
trace) and 426 nm (upper trace). Wavelengths were
chosen to maximize the contributions of the heme NO
complexes (440 nm) and the ferroheme oxygen com-
plex (426 nm). The 426 nm band has been fit to an
exponential with a rate constant of 50 s
)1
; this ade-
quately described the rise of the absorbance, which
slightly falls off after 500 ms. This is a reasonable mea-
sure of the time frame formation of the ferrous oxygen
complex, which is limited by the rate of reduction of
heme. The absorbance at 440 nm is dominated by the
ferric and ferrous NO complexes. As shown in Fig. 3,
as the reaction progresses, the ferrous NO complex is
dominant. At short times, both complexes contribute,
with the ferric NO complex forming slightly earlier in
the first turnover. The absorbance has been fit with
two exponentials. The majority contribution has a rate
Fig. 3. Difference spectra of nNOS after 1 s of turnover at 37 °C
minus holoenzyme before activation of turnover in stopped flow
(upper trace) and ferrous NO complex of nNOSox minus oxidized
nNOSox, showing that the majority turnover species formed is the
ferrous NO complex.
Fig. 2. Simulations of NO production and population of states in
the catalytic cycle at 37 °C. Solid line, rate of NO formation (s
)1
);
dashed line, fractional occupation of FeII–NO segment; black dash–
dot line, total fractional occupation of FeII–O
2
complexes; grey
dash––dot line, fractional occupation of FeIII–NO complex. Para-
meters: k
1
, k
4
=52s
)1
; k
8
=28s
)1
; k
2
, k
5
= 520 s
)1
; k
3
,
k
6
= 100 s
)1
; k
7
=50s
)1
; k
9
= 0.01 s
)1
; k
10
= 1.2 s
)1
.
J. C. Salerno and D. K. Ghosh Space, time and nitric oxide
FEBS Journal 276 (2009) 6677–6688 ª 2009 The Authors Journal compilation ª 2009 FEBS 6679
constant of 8 s
)1
, and contains contributions from
both NO complexes. A minority species accounting for
the initial 25% of the absorbance change has a time
constant of 50 s
)1
, most likely representing the tail of
the ferrous oxygen complex band. These rate constants
are only descriptive because the reaction sequence is
too complex to be modeled with a few exponentials
(see simulations in Fig. 5B, and in Fig. 7B below).
After the first 100 ms, a significant fraction of the
enzyme is no longer in the initial turnover cycle. In
particular, the rise of the ferrous NO complex is not a
single turnover event.
To obtain more information, spectra were recorded
at 1 ms intervals using an OLIS RMS rapid scan spec-
trometer. The traces shown are from experiments initi-
ated by mixing NADPH reduced nNOS with 200 lm
CaM, which essentially eliminates complications from
flavin spectra because both flavins are already reduced.
It is necessary to use high CaM concentrations because
the on-rate for CaM is otherwise not fast enough to
allow observation of the initial reactions. It is possible
that the initial reaction (heme reduction) is still some-
what affected by the CaM on-rate. The rise of ferro-
heme NO is obvious in all data sets and is consistent
with single wavelength kinetics at 440 nm. Fitting of
spectra at all positions to a three-component series
yields initial and final ferric heme components and a
ferroheme NO transient. The rise of the transient
corresponds to the falling edge of the NO pulse.
Additional components are indicated by residuals in
the early spectra.
To improve signal to noise, spectra were averaged
over intervals of 10 ms after the first few traces. As
shown in Fig. 5A, after the initiation of catalysis, a
Soret component at 427 nm rapidly forms, reaching
a maximum at 20 ms; this is followed by the rise of
longer wavelength components, which reach half maxi-
mal intensity after 50 ms. Long wavelength compo-
nents increase slowly until 500 ms, reaching a
plateau that extends until reagents are depleted. It is
Fig. 4. Stopped flow kinetics results at 37 °C showing traces at
426 nm (upper trace) and 440 nm (lower trace) after the initiation
of turnover by mixing nNOS pre-reduced with NADPH and satu-
rated with arginine with 200 l
M calmodulin and 1 mM CaCl
2
. The
fits shown are the single exponential with 50 s
)1
rate constant
(426 nm) and two exponentials with 50 and 8 s
)1
rate constants in
a 1 : 3 ratio. Absorbance unit scales for 426 and 440 nm are shown
on the right and left vertical axes, respectively.
A
B
Fig. 5. Kinetics of nNOS turnover of at 37 °C showing progressive
FeII NO inhibition. (A) Difference spectra of nNOS Soret region
during turnover. Baseline was averaged over the first four traces
(0–3 ms traces), except the 2 ms trace shows the unaveraged dif-
ference between 2 and 0 ms, which is reflected by the greater
noise. The major species are the 436–440 nm NO complexes, but
an early transient can be seen near 425 nm. (B) Time course of
absorbance changes at 440 and 425 nm together with simulations
based on the model in Fig. 1. Open circles, 440 nm absorbance;
closed diamonds, 425 nm absorbance; dashed line, decay of frac-
tional population of ferric heme; dotted line, time course of ferrous
O
2
complexes; light solid line, time course of ferrous NO complex;
dash–dot line, rise of total heme NO complex; heavy solid line,
combined absorbance of major states at 440 nm; medium solid
line, combined absorbance of major states at 425 nm. Simulation
parameters: k
1
, k
4
=52s
)1
; k
8
=28s
)1
; k
2
, k
5
= 1000 s
)1
; k
3
,
k
6
= 200 s
)1
; k
7
=50s
)1
; k
9
= 0.01 s
)1
; k
10
=1s
)1
.
Space, time and nitric oxide J. C. Salerno and D. K. Ghosh
6680 FEBS Journal 276 (2009) 6677–6688 ª 2009 The Authors Journal compilation ª 2009 FEBS
likely that, during the initial few 100 ms, ferroheme
NO is formed in the presence of citrulline but, at times
longer than 1 s, the dominant ferrous NO complex is
the arginine bound state.
Figure 5B shows a plot of absorbance at three wave-
lengths with simulations based on the model shown in
Fig. 1. Simulations are derived from a Runge–Kutta
numerical solution of the differential equations
describing the model as previously described [24].
Ferriheme declines from an initial value of 100% of
heme, reaching a steady-state of approximately 7%.
The simulation only approximates exponential decay,
primarily as a result of the contribution of ferriheme
N-OH arginine in segment D. The first transient
shown is the ferrous O
2
complex, which has two com-
ponents (segments C and F) corresponding to the two
oxygenase reactions. Hence, the first component is the
arginine ferrous O
2
complex and the second the N-OH
arginine ferrous O
2
complex. The second transient is
ferriheme NO, which has only a single component
(segment G); ferroheme NO increases monotonically,
approximating an exponential after a 20 ms lag.
The difference absorbance at 440 nm (open circles)
can be approximated by the sum of contributions from
segments G and H (ferrous and ferric NO complexes)
at times longer than 20 ms; at short times, there is a
small component from ferroheme O
2
. The simulation
shown includes equal contributions from these species.
Between 422 and 430 nm, absorbance changes are
dominated by segments C and F (ferrous oxy com-
plexes) with some apparent contribution from segment
G. The ferroheme contribution (not shown) is small,
peaking before 10 ms.
The parameters employed in Fig. 5 do not represent
a unique fit. However, the heme reduction rate is con-
sistent with projection from direct measurements at
lower temperatures, and the data presented require an
initial heme reduction rate in the range 45–60 s
)1
to
account for ferroheme O
2
formation (but see also the
three-electron model in the Discussion). The rates of
O
2
binding and catalysis are similarly constrained (pri-
marily at the low end), and the maximum 37 °C
steady-state turnover rate (2–3 s
)1
) provides an addi-
tional cross check.
Figure 6 shows the temperature dependence of the
rate of heme reduction in nNOS holoenzyme using
several experimental approaches. These include
stopped flow measurements of heme-CO derivatives,
single wavelength and spectral measurements made
during early turnover, and flash experiments initiating
electron transfer by CO dissociation [32]. Heme reduc-
tion is reasonably well described in this regime by a
single activation energy of 80 kJÆmol
)1
. NADPH
and CaM initiated rates fall on the same plot, indicat-
ing that any effects of CaM binding rates on the initia-
tion of electron transfer are secondary.
Although the quality of the data does not yet allow
deeper analysis of intermediates formed in the first
50 ms, it is clear that steady-state turnover at 37 °Cis
inhibited by the formation of a majority ferrous NO
complex, leading to production of a pulse of NO dur-
ing the initial few turnovers in 100–200 ms. It is
equally clear that the heme reduction rate is at least
50 s
)1
, and is not much faster than 70 s
)1
.
Figure 7 illustrates the results of experiments con-
ducted at 22 °C to investigate the ability of nNOS to
produce multiple pulses in sequence. Figure 7A shows
a sequence in which nNOS turning over in steady-state
is repeatedly stopped and started by the sequential
addition of the chelator EDTA and calcium. The ini-
tial sequence shows the steady-state consumption of
NADPH; pulses of higher activity are elicited by stop-
ping the reaction with EDTA and restarting with
Ca
2+
after an interval of 1–10 s. Neither EDTA nor
Ca
2+
alone produces a pulse. Simultaneous addition
of EDTA and Ca
2+
(with a slight excess of EDTA)
produces a small pulse expected for a mixing time of
0.5–1.0 s.
Figure 7B shows a similar experiment expanded to
show the details of the pulses. The top trace shows the
effect of adding Ca
2+
to nNOS turning over in steady-
state; no pulse is produced because quasi-geminate NO
Fig. 6. Temperature dependence of electron transfer rate in nNOS
holoenzyme. Rates of heme reduction at 10 °C are estimated from
CO binding stopped flow experiments [17] and at 15, 25 and
37 °C from turnover stopped flow experiments (present study). The
rate at 22 °C is taken from a flash dissociation initiated experiment
[32].
J. C. Salerno and D. K. Ghosh Space, time and nitric oxide
FEBS Journal 276 (2009) 6677–6688 ª 2009 The Authors Journal compilation ª 2009 FEBS 6681
is continuously generated in steady-state. The other
traces show pulses that increase with the interval
between EDTA and Ca
2+
addition. The lines represent
the steady-state rate, the initial pulse rate after full
recovery, and the initial pulse rate after 3 s recovery.
The maximum pulse rate is approximately eight-fold
greater than the steady-state rate, and approximately
half the maximum pulse can be elicited after 3–4 s.
The recovery of pulse intensity has a rate constant of
0.25 ± 0.05 s
)1
. This compares reasonably well to the
1s
)1
rate constant used for the reaction of oxygen
with the ferrous NO complex in 37 °C simulations,
and is consistent with the slightly greater inhibition
observed at 22 °C than at 10 °C. Strong pulses can be
elicited even after the steady-state activity slows down
(not shown), presumably because oxygen consumption
slows down the steady-state activity before the initial
rate decreases.
Discussion
Three-electron models
Simulations based directly on the original Santolini
model [24] account for the observations made during
turnover at 37 °C at the present level of detail, demon-
strating pulsed catalysis under these conditions. This
confirms the central premise of the model: the progres-
sive inhibition by formation of the ferrous NO com-
plex from quasi-geminate NO. The original model
does not account for all features of the catalytic cycle.
In particular, only two steps in the productive loop of
the model correspond to electron transfer from FMN
to heme.
The reactions producing NO from arginine require
three electrons. The first oxygenase reaction, producing
N-OH arginine from arginine, requires two electrons.
The first electron is explicitly accounted for in the ini-
tial step, in which the enzyme is primed for O
2
binding
by heme reduction. The second electron is supplied by
tetrahydrobiopterin (BH
4
) [33,34]; the reductive reac-
tion is subsumed into a catalytic step with rate con-
stant k
3
.BH
4
and heme are closely associated within
the oxygenase domain [35], and thermodynamically
favorable electron transfer between them should be
rapid in comparison to shuttle delivery of electrons via
FMN [36]. The second oxygenase reaction requires
only one electron to prime heme for O
2
binding. The
initial oxygenase reaction leaves biopterin as a one
electron oxidized radical, which must be subsequently
reduced to BH
4
for turnover to continue. The electron
is supplied from NADPH via FMN. BH
4
regeneration
is not included in the original two-electron model.
Several three-electron models that retain inhibitory
feedback differ in the position in which BH
4
is regener-
ated. In Fig. 8A, regeneration occurs immediately after
the first oxygenase reaction. Heme reduction is followed
by rapid biopterin reduction, so ferriheme predominates
in D and D1. The rate constant essentially describes
heme reduction by FMN. This is followed immediately
by ferriheme reduction, priming heme for O
2
binding to
start the second oxygenase reaction. Differential
equations describing the model are given in Fig. S3, in
addition to two other examples (Figs S4 and S5). In the
first, the electron for BH
4
regeneration is supplied
A
B
Fig. 7. Sequential pulse formation during NO synthesis by nNOS at
22 °C, monitored by measuring NADPH consumption at 340 nm.
Pulses were generated by stopping steady-state reaction with
60 l
M EDTA and, after a delay, restarting turnover by addition of
60 l
M CaCl
2
. Solutions were mixed with a 500 lL gas tight Hamil-
ton syringe. Initial conditions were: 2 l
M nNOS in 50 mM Mops (pH
7.5), 50 m
M KCl, 10% glycerol, 200 lM arginine, 2 lM calmodulin.
(A) Segments from upper left represent steady-state turnover,
pulse generated by starting and stopping with a 3 s interval, pulse
after a 2 s interval, pulse after simultaneous injection of EDTA and
Ca
+2
, pulse after 8 s interval, and pulse after 4 s interval. (B) Seg-
ments selected from a separate experiment showing pulse regions
in detail. Open circles, lack of a pulse when extra Ca
2+
is added
without stopping the reaction; filled diamonds, pulse after 2 s inter-
val; X characters, 8 s interval; filled triangles, 8 s intervals; open
squares, 3 s interval. Dashed lines represent the initial (maximum)
rate of the fully developed pulse, steady-state rate at high
( 120 torr) pO
2
, and the initial rate of pulse after a 3 s interval.
Space, time and nitric oxide J. C. Salerno and D. K. Ghosh
6682 FEBS Journal 276 (2009) 6677–6688 ª 2009 The Authors Journal compilation ª 2009 FEBS
during catalysis via an unspecified intermediate, pro-
ducing an early appearance of the second ferroheme
oxygen complex. In the second model, BH
4
regeneration
can occur either before or after oxygen complex for-
mation, producing a pathway branched at both the
regenerative step and the inhibitory loop.
Figure 8B shows a simulation of experimental data
from 37 °C kinetics experiments with the three-electron
model of Fig. 8A. A reasonable fit was obtained by
slight adjustment of kinetics parameters from the
simulation of Fig. 5B. Using this model, the best fits
are obtained with somewhat faster rates for the second
and third reductive steps, and a slightly slower rate of
catalysis for the first oxygenation. One possibility is
that the initial electron transfer reaction is slightly
affected by a 10 ms delay caused by the rate of binding
of calmodulin. We do not claim to be able to estimate
all the parameters to high accuracy from these
simulations because the simulations are insensitive to
some rates as long as they are fast, and because
parameters (other than the rates of heme reduction)
can often be be adjusted by a factor of two to three. It
is not yet feasible to discriminate between three-elec-
tron models based on fitting. Although two-electron
models account for kinetics, they should be replaced
by three-electron models that explicitly account for
stoichiometry.
Physiological implications
The experimental results presented here demonstrate
that nNOS is capable of pulsed production of NO at
37 °C, and provide an initial characterization of the
state of the enzyme during pulse formation and pro-
gressive inhibition. Pulsatile behavior of nNOS occurs
even in air-saturated buffer at an O
2
tension of
150 torr.
Physiological O
2
tension varies greatly between tissues
and, in some tissues, varies greatly between physiologi-
cal states. Tissue pO
2
varies from approximately
100 torr (in the lung) to 20 torr [37], and falls during
stress or exercise. As pO
2
falls, the removal of the
ferrous NO complex slows; ferrous NO formation from
the ferric NO branch point is independent of O
2
tension.
The inhibited state thus becomes increasingly prevalent.
Simulations using the models presented here suggest
that, in steady-state at 37 °C and 40 torr, nNOS is
inhibited by more than 90%, assuming that the removal
of ferroheme NO is first order in O
2
. Further details will
be made available in subsequent studies.
Pulsatile behavior of nNOS is therefore likely to be
even more pronounced at physiological pO
2
. The effec-
tive K
m
for O
2
is much lower for pulsed NO produc-
tion, and dominated by oxygen binding to ferrous
heme, than for steady-state NO production, in which
the relief of inhibition is critical. As a result, nNOS
steady-state activity is a significant fraction (20–30%)
of the uninhibited rate at the highest physiological
oxygen tensions but is a much smaller fraction at
lower O
2
tensions, whereas pulsed NO production is
almost maximal (for example, see [25]). As pointed out
by several groups, the apparent K
m
for nNOS is anom-
alously high for a heme oxygenase; Santolini et al. [24]
A
B
Fig. 8. Three-electron model for NO catalytic cycle. (A) Rapid reac-
tion segments are labeled A–H instead of labeling by characteristic
states. All states are assumed to be saturated with arginine or
N-OH arginine (starred states) except the NO complexes, which
are initially formed with citrulline bound. Rate constants k
1
, k
4
, k¢
4
and k
8
correspond to heme reduction; k
2
and k
5
correspond to
oxygen binding; and k
3
and k
6
correspond to catalytic steps. k
7
and
k
9
correspond to release of NO from ferric and ferrous enzyme,
and k
10
corresponds to reaction of the ferrous NO complex with
oxygen. Segment D is characterized by ferric heme, biopterin radi-
cal and N-OH arginine, whereas, in segment D
1
, the characteristic
state is ferric heme in the presence of BH
4
and N-OH arginine
because the first electron entering heme after N-OH arginine for-
mation regenerates BH
4
. The long-lived FeII–NO complex (segment
H) is inhibitory. (B) Simulations of absorbance kinetic data using the
three-electron model of Fig. 8A. Open circles, 436 nm absorbance
data; open triangles, 425 nm absorbance data; closed diamonds,
425 nm absorbance data; dashed line, decay of fractional popula-
tion of ferric heme; dotted line, time course of ferrous O
2
com-
plexes; light solid line, time course of ferrous NO complex; dash–
dot line, rise of total heme NO complex; heavy solid line, combined
absorbance of major states at 440 nm; medium solid line, com-
bined absorbance of major states at 425 nm. Parameters:
k
1
=45s
)1
; k
4
, k¢
4
=70s
)1
, k
8
=70s
)1
; k
2
, k
5
= 800 s
)1
;
k
3
=70s
)1
, k
6
=80s
)1
; k
7
= 120 s
)1
; k
9
= 0.02 s
)1
; k
10
= 0.5 s
)1
.
J. C. Salerno and D. K. Ghosh Space, time and nitric oxide
FEBS Journal 276 (2009) 6677–6688 ª 2009 The Authors Journal compilation ª 2009 FEBS 6683
have attributed this to the relief of inhibition. The pre-
steady-state rate of NO synthesis is essentially O
2
-inde-
pendent until hypoxic levels of oxygen are attained.
As noted previously [21], the pulsatile behavior of
nNOS produces very sharp spatial gradients of NO
that limit the range of NO signaling. As an example of
the spatial and temporal character of NO diffusion
from a pulse, Fig. S6 provides a simulation of diffu-
sion during and following a pulse from a generating
volume of eukaryotic dimensions (i.e. a sphere 20 lm
in diameter with internal layers 1 lm thick). The pulse
function used includes a 15 ms delay, a rapid (5 ms)
rise and a 140 ms exponential decay. The pulse is
truncated at 210 ms to produce a small marker dis-
continuity. Diffusion alone quickly reduces the NO
concentration in volume elements of cellular dimen-
sions or smaller, such that pulses in NO production
always lead to pulses in NO concentration in systems
of that magnitude. The concentration pulse produced
here is approximately twice the duration of NO syn-
thesis, and is limited to approximately 50 lm with
respect to the effective range. Sharper pulses and smal-
ler generating areas produce sharper pulses in space
and time. A small nNOS array in a postsynaptic
region would produce very short ranged pulsed signals.
We hope to explore this topic in subsequent studies.
Other isoforms
Quasi-geminate NO inhibits iNOS and eNOS less than
nNOS because of differences in the rate constants for
the reduction of steady-state ferroheme NO [27]. At
10 °C and 100 torr, steady-state activity in these iso-
forms is only marginally inhibited, such that NO
formed in pre-steady-state catalysis is negligible com-
pared to NO formed in steady-state. However, at low
pO
2
, inhibition by quasi-geminate NO can be signifi-
cant. In constitutively active iNOS, this primarily
reduces steady-state activity at low pO
2
[24].
Because eNOS, similar to nNOS, is activated by CaM
and phosphorylation, it presents the possibility of signifi-
cant steady-state and pre-steady-state phases of catalysis.
Simulations of NO synthesis by eNOS using the models
presented here indicate that, as pO
2
falls, progressive
inhibition of steady-state catalysis makes the pre-steady-
state more significant in comparison.
Pre-steady-state production of NO by eNOS at low
pO
2
is, however, quite different than the pre-steady-state
production of NO by nNOS. Because heme reduction in
eNOS is more than one order of magnitude slower than
heme reduction in nNOS, eNOS is incapable of generat-
ing sharp pulses unless an additional factor (e.g. phos-
phorylation) greatly increases electron transfer. In
particular, phosphorylation of sites such as S615 and
S633, associated with the autoinhibitory element, and
S1177, associated with the C terminal tail regulatory site,
increases the electron transfer rate and should preferen-
tially promote presteady-state NO synthesis [38]. At low
O
2
(e.g. 20 torr) eNOS simulations suggest that it gener-
ates NO for several seconds and is progressively inhib-
ited; inactivation kinetics and the degree of steady-state
inhibition depend on the model and the O
2
tension, but it
is likely that eNOS is often inhibited by 75–80% in the
steady-state. Because inactivation is slow, the persistence
of pre-steady-state rates of NO synthesis to low O
2
ten-
sions produces extended NO production rather than
sharp 100 ms pulses. Effectively, the pre-steady-state
K
m
for O
2
is lower than the steady-state K
m
.
Because pre-steady-state NO synthesis is extended,
diffusion of the NO signal is much less restricted.
Instead, the negative feedback loop limits the concen-
tration of NO produced by active eNOS. The higher
activity of eNOS in pre-steady-state serves to rapidly
establish a level of NO that is capable of activating
sGC. The pre-steady-state synthesis of NO by eNOS,
and its effect on vascular diffusion patterns, will be
examined in future studies.
Pulsed signal generators
It should be clear that production of signal pulses is
not dependent on the details of catalytic cycle mod-
els, but reflects instead the progressive inhibition of
a signal generator after activation. In the previous
model [24] and in the closely-related three-electron
models introduced here, feedback inhibition is pro-
duced by quasi-geminate NO, a confined reaction
product. The key element is the production of an
additional inhibited state, the ferrous NO complex,
which is not the parent of free NO in the productive
cycle.
The progressive accumulation of a stable enzyme–
product complex is one theme that might recur in
other signal generators. However, this need not involve
product inhibition. A more general view of pulse gen-
eration is presented in Fig. 9. The signal generator is
initially in a resting state E
R
; with activation in
response to a stimulus produces state E
A
. E
A
generates
a signal but decays to state E
I
. As the inhibited state
E
I
accumulates, the rate of signal production falls, lim-
iting the extent of the pulse. The signal generator is
turned off by removal of the stimulus or the introduc-
tion of an antagonist, and E
I
is converted to E
IR
. E
IR
in turn decays to the resting state E
R
.
In NOS, E
A
is produced by CaM binding in
response to calcium, and corresponds to the enzyme in
Space, time and nitric oxide J. C. Salerno and D. K. Ghosh
6684 FEBS Journal 276 (2009) 6677–6688 ª 2009 The Authors Journal compilation ª 2009 FEBS
the productive catalytic cycle. E
I
corresponds to the
inhibited enzyme tied up as ferrous NO complex.
Removal of calcium or phosphorylation stops electron
transfer (state E
IR
) and reaction with oxygen gradually
restores the original resting state during a latency per-
iod. Calcium removal and enzyme inactivation are
rapid events, occurring on a millisecond time scale; as
shown in the present study, the decay of the enzyme to
the resting state occurs on a 1 s time scale.
The pulses of NO in simulations presented in the
previous study [21] are strikingly similar in shape to
action potentials and other transport-like transients,
although they are much slower. The mechanism
responsible for the generation of these potentials pro-
vides an interesting parallel to pulsed signal generation
in NOS. Sodium and potassium channels open in
response to partial membrane depolarization, and ion
currents rapidly depolarize the membrane. This corre-
sponds to activation. The inhibitory event is conforma-
tional, corresponding to binding of an autoinhibitory
element by activated channels. This closes the channels
within milliseconds and allows membrane repolariza-
tion, deactivating the channels. The autoinhibitory
element is released in response to deactivation, regener-
ating the resting inactive configuration [39]. This is a
rapid process (millisecond time scale). The refractory
period limits the frequency of pulses and the rate of
information transfer. Limitations imposed by rate con-
stants of the molecular elements necessitate massive
parallelism in sensory and motor pathways.
NO is a retrograde signal in the central nervous sys-
tem [40]. Because the refractory period of NO pulses is
much longer than the refractory period of neurons,
NO pulses cannot form spike trains on the time scale
of action potential spike trains. An NO ‘spike’ lasts
50–100 times as long as an action potential. It is more
productive to consider it as a response to the initiation
of synaptic activity rather than a translated action
potential.
Keller et al. [41] recently simulated calmodulin
release and activation in synapses, using calcium-sensi-
tive dye recordings on a millisecond time scale. Apply-
ing their results to nNOS activation, it is clear that
calcium spikes and high local CaM concentrations are
more than sufficient to activate an array of nNOS mol-
ecules bound at the synapse through their PDZ
domains. The time frame of the NO pulse is appropri-
ate for a retrograde signal (e.g. one that functions as a
mediator in synaptic plasticity)
Because signaling is inherently time-dependent, pulse
formation on different time scales may be common to
many signal generators. The appropriate time domain
is determined by many factors, including the informa-
tion transfer rate, the time frame of feedback loops
that depend on the signals, and the distance over
which a diffusible molecular signal acts. For slowly-
modulated signals, low frequency pulses can be pro-
duced using feedback from downstream processes.
Short pulses are likely to require internal feedback, as
in the nNOS and potassium channel examples.
Materials and methods
Expression and purification of nNOS
DNA encoding rat nNOS holoenzyme, a gift from Dr S. Sny-
der (Johns Hopkins University, Baltimore, MD, USA), was
cloned in pCWori+ [42,43]. Rat nNOS was expressed in Esc-
herichia coli strain BL21DE, and purified using ammonium
sulfate precipitation and gel filtration and 2¢,5¢-ADP Sepha-
rose chromatography [43,44]. Activity was measured by oxy-
hemoglobin assay, and was 500–700 nmolÆmin
)1
Æmg
)1
protein [43–45]. Purified nNOS contained 0.8–1.0 hemeÆ
mol
)1
(CO difference spectra extinction coefficient of
74 mm
)1
Æcm
)1
) and FMN and FAD contents after extraction
from nNOS were at least 90% of heme. Rat nNOSoxy was
expressed and purified as reported previously [44,45].
Spectroscopy
The binding of l-arginine, H
4
B and citruline were moni-
tored by UV-visible spectral perturbation. Absorbance
spectra of purified NOS oxygenase and holo proteins were
obtained using a Hitachi U2010 Spectrometer (Hitachi,
Tokyo, Japan) and data collection software (UV solutions,
Wellesley Hills, MA, USA). Ferric and ferrous nitrosyl
complexes were produced at 25 °Cin40mm bis-tris
Fig. 9. Scheme for internally regulated pulse signal generation. E
R
denotes a resting state; activation produces the active state E
A
. E
A
generates a signal but decays to the inhibited state E
I
. E
I
accumula-
tion leads to the decay of the pulse. After inactivation (e.g. removal
of stimulus or introduction of an antagonist), E
I
is converted to the
transient state E
IR
. E
IR
decays to the resting state E
R
.
J. C. Salerno and D. K. Ghosh Space, time and nitric oxide
FEBS Journal 276 (2009) 6677–6688 ª 2009 The Authors Journal compilation ª 2009 FEBS 6685
propane (BTP) buffer, pH 7.5, 150 mm NaCl, 10 lm H
4
-bi-
opterin in the presence of either 2 mml-arginine or citru-
line, or both. The final NOS concentration was 3–4 lm,
and NO was generated by the decay of PROLINONOate
(0.2 mm; Alexis Biochemicals, San Diego, CA, USA), an
NO donor. Spectra were recorded at 3600 nmÆmin
)1
; after
collecting oxidized spectra, dithionite was added to obtain
ferrous nitrosyl spectra. Difference spectra were obtained
by digital subtraction. Pulse trains were generated at 22 °C
using a 500 lL Hamilton syringe for rapid mixing; the solu-
tion was quickly withdrawn from the cuvette and reinjected
along with an aliquot of the reagent to be added. The
mixing time was approximately 0.5 s, and the minimum
interval between additions was approximately 2 s.
Kinetics
Kinetics experiments were conducted using an Applied
Photophysics SX stopped flow unit (single wavelength)
(Applied Photophysics, Leatherhead, UK) or an OLIS
RMS-1 rapid scan spectrophotometer (OLIS Instruments,
Bogart, GA, USA) equipped with a stopped flow device.
Reactions were initiated by mixing 3–6 lm solutions of
nNOS, 1 mm arginine and 200 lm NADPH in air-saturated
BTP at pH 7.5 with 120 lm calmodulin and 2 mm CaCl
2
,
or by mixing 3 lm solutions of nNOS, 1 mm arginine,
12 lm calmodulin and 100 lm CaCl
2
in air-saturated BTP
at pH 7.5 with 1 mm NADPH. Data collection and
preliminary analysis of spectral stopped flow data was
performed using olis proprietary software.
Simulations
Simulations of kinetics data were carried out as described
previously [24]. The systems of first-order differential equa-
tions describing the kinetic behavior of the models were
solved by numerical integration using fourth-order Runge–
Kutta methods. Simulations were checked by systematically
setting all rate constants to zero except one, and by com-
parison with Euler’s method programs.
Acknowledgements
This work was supported by NIH GM083317-01 (J.S.)
and Axxora LLC (D.G.). We thank Dr R. J. DeSa for
advice and experimental assistance.
References
1 Wiener N (1948) Cybernetics: or Control and Communi-
cation in the Animal and the Machine, pp. 232. MIT
Press, Cambridge
2 Lenbury Y & Pornsawad P (2005) A delay-differential
equation model of the feedback-controlled hypothala-
mus–pituitary–adrenal axis in humans. Math Med and
Biol 22, 15–33.
3 Michaelis L & Menten M (1913) Die Kinetik der
Invertinwirkung. Biochem Z 49, 333–369.
4 Cleland WW (1963) The kinetics of enzyme-catalyzed
reactions with two or more substrates or products. I.
Nomenclature and rate equations. Biochim Biophys Acta
67, 104–137.
5 King EL & Altman C (1956) A schematic method of
deriving the rate laws for enzyme-catalyzed reactions.
J Phys Chem 60, 1375–1378.
6 Bredt DS (1999) Endogenous nitric oxide synthesis: bio-
logical functions and pathophysiology. Free Radic Res
6, 577–596.
7 Lamb TD & Pugh EN (1992) G-protein cascades: gain
and kinetics. Trends Neurosci 15, 291–298.
8 Shannon CE (1948) A mathematical theory of commu-
nication. Bell System Tech J 27, 379–423.
9 Furchgott RF (1988) Studies on relaxation of rabbit aorta
by sodium nitrite: the basis for the proposal that the acid-
activatable inhibitory factor from retractor penis is inor-
ganic nitrite and the endothelium-derived relaxing factor
is nitric oxide. In Vasoldilation: Vascular Smooth Muscle,
Peptides, Autonomic Nerves and Endothelium (Vanhouette
PM ed), pp. 401–404. Raven Press, New York.
10 Ignarro LJ, Buga GM, Wood KS, Byrns RE &
Chadhuri G (1987) Endothelium derived relaxing factor
produced and released from artery and vein is nitric
oxide. Proc Natl Acad Sci USA 24, 9265–9269.
11 Garthwaite J, Charles SL & Chess-Williams R (1988)
Endothelium-derived relaxing factor release on activa-
tion of NMDA receptors suggests role as intercellular
messenger in the brain. Nature 336, 385–388.
12 Gally JA, Montague PR, Reeke GN Jr & Edelman GM
(1990) Nitric oxide: linking space and time in the brain.
Proc Natl Acad Sci USA 87, 3547–3551.
13 Bredt DS, Hwang PM & Snyder SH (1990) Localization
of nitric oxide synthase indicating a neural role for
nitric oxide. Nature 347, 768–770.
14 Knowles RG, Merrett M, Salter M & Moncada S
(1990) Differential induction of brain, lung and liver
nitric oxide synthase by endotoxin in the rat. Biochem J
270, 833–836.
15 Marletta MA, Yoon PS, Iyengar R, Leaf CD &
Wishnok JS (1988) Macrophage oxidation of L-arginine
to nitrite and nitrate: nitric oxide is an intermediate.
Biochemistry 27, 8706–8711.
16 Stuehr DJ, Gross SS, Sakuma I, Levi R & Nathan CF
(1989) Activated murine macrophages secrete a meta-
bolite of arginine with the bioactivity of endothelium-
derived relaxing factor and the chemical reactivity of
nitric oxide. J Exp Med 169, 1011–1020.
17 Abu-Soud HM & Stuehr DJ (1993) Electron transfer in
the nitric-oxide synthases. Nitric oxide synthases reveal
Space, time and nitric oxide J. C. Salerno and D. K. Ghosh
6686 FEBS Journal 276 (2009) 6677–6688 ª 2009 The Authors Journal compilation ª 2009 FEBS
a role for calmodulin in controlling electron transfer.
Proc Natl Acad Sci USA 90, 10769–10772.
18 Arnold WP, Mittal CK, Katsuki S & Murad F (1977)
Nitric oxide activates guanylate cyclase and increases
guanosine 3¢:5¢-cyclic monophosphate levels in various
tissue preparations. Proc Natl Acad Sci USA 74, 3203–
3207.
19 Hess DT, Matsumoto A, Kim SO, Marshall HE &
Stamler JS (2005) Protein S-nitrosylation: purview and
parameters. Nat Rev Mol Cell Biol 6, 150–166.
20 Lancaster J (1997) A tutorial on the diffusibility and
reactivity of free nitric oxide. Nitric Oxide 1, 18–30.
21 Salerno JC (2008) Neuronal nitric oxide synthase:
prototype for pulsed enzymology. FEBS Lett 582,
1395–1399.
22 Abu-Soud HM, Wang J, Rousseau DL, Fukuto JM,
Ignarro LJ & Stuehr DJ (1995) Neuronal nitric oxide
synthase self-inactivates by forming a ferrous-nitrosyl
complex during aerobic catalysis. J Biol Chem 270,
22997–23006.
23 Stuehr DJ, Santolini J, Wang ZQ, Wei CC & Adak S
(2004) Update on mechanism and catalytic regulation in
the NO synthases. J Biol Chem 279, 36167–36170.
24 Santolini J, Adak S, Curran CM & Stuehr DJ (2001) A
kinetic simulation model that describes catalysis and
regulation in nitric-oxide synthase. J Biol Chem 276,
1233–1243.
25 Santolini J, Meade AL & Stuehr DJ (2001) Differences
in three kinetic parameters underpin the unique cata-
lytic profiles of nitric-oxide synthases I, II, and III.
J Biol Chem 276, 48887–48898.
26 Nishimura JS et al. (1999) The stimulatory effects of
Hofmeister ions on the activities of neuronal nitric-
oxide synthase: apparent substrate inhibition by L-argi-
nine is overcome in the presence of protein-destabilizing
agents. J Biol Chem 274, 5399–5406.
27 McMillan K et al. (1992) Cloned, expressed rat cerebel-
lar nitric oxide synthase contains stoichiometric
amounts of heme, which binds carbon monoxide. Proc
Natl Acad Sci USA 89, 11141–11145.
28 Ledbetter AP et al. (1999) Low-temperature stabiliza-
tion and spectroscopic characterization of the dioxygen
complex of the ferrous neuronal nitric oxide synthase
oxygenase domain. Biochemistry 38, 8014–8021.
29 Abu-Soud HM, Gachhui R, Raushel FM & Stuehr DJ
(1997) The ferrous-dioxy complex of neuronal nitric
oxide synthase. J Biol Chem 272, 17349–17353.
30 Marchal S, Gorren AC, Sørlie M, Andersson KK,
Mayer B & Lange R (2004) Evidence of two distinct
oxygen complexes of reduced endothelial nitric oxide
synthase. J Biol Chem 279, 19824–19831.
31 Wang J, Rousseau DL, Abu-Soud HM & Stuehr DJ
(1994) Heme coordination of NO in NO synthase. Proc
Nat Acad Sci USA 91, 10512–10516.
32 Feng C, Tollin G, Hazzard JT, Nahm NJ, Guillemette
JG, Salerno JC & Ghosh DK (2007) Direct measure-
ment by laser flash photolysis of intraprotein electron
transfer in a rat neuronal nitric oxide synthase. JAm
Chem Soc 129(17), 5621–5629.
33 Gorren AC et al.
(2005) Tetrahydrobiopterin as com-
bined electron ⁄ proton donor in nitric oxide biosynthe-
sis: cryogenic UV-Vis and EPR detection of reaction
intermediates. Methods Enzymol 396, 456–466.
34 Wei CC et al. (2008) Catalytic reduction of a tetrahy-
drobiopterin radical within nitric-oxide synthase. J Biol
Chem 283, 11734–11742.
35 Crane BR et al. (1998) Structure of nitric oxide
synthase oxygenase dimer with pterin and substrate.
Science 279, 2121–2126.
36 Ghosh DK & Salerno JC (2003) Nitric oxide synthases:
domain structure and alignment in enzyme function and
control. Front Biosci 8, 193–209.
37 Rossi S et al. (2000) Oxygen delivery and oxygen ten-
sion in cerebral tissue during global cerebral ischaemia:
a swine model. Acta Neurochir 76, 199–202.
38 Fulton D, Gratton JP & Sessa WC (2001) Post-transla-
tional control of endothelial nitric oxide synthase: why
isn’t calcium ⁄ calmodulin enough? J Pharmacol Exp
Ther 299(3), 818–824.
39 Zagotta WN, Hoshi T & Aldrich RW (1990) Biophysi-
cal and molecular mechanisms of Shaker potassium
channel inactivation. Science 250, 533–53838.
40 Monfort P, Mun
˜
oz MD, Kosenko E, Llansola M,
Sa
´
nchez-Pe
´
rez A, Cauli O & Felipo V (2004) Sequential
activation of soluble guanylate cyclase, protein kinase
G and cGMP-degrading phosphodiesterase is necessary
for proper induction of long-term potentiation in CA1
of hippocampus. Alterations in hyperammonemia.
Neurochem Int 45(6), 895–901.
41 Keller DX, Franks KM, Bartol TM Jr & Sejnowski TJ
(2008) Calmodulin activation by calcium transients in
the postsynaptic density of dendritic spines. PLoS ONE
30,3.
42 Ghosh DK, Holliday MA, Thomas C, Weinberg JB,
Smith SM & Salerno JC (2006) Nitric-oxide synthase
output state. Design and properties of nitric-oxide syn-
thase oxygenase ⁄ FMN domain constructs. J Biol Chem
281, 14173–14183.
43 Roman LJ & Masters BSS (2006) Electron transfer by
neuronal nitric-oxide synthase is regulated by concerted
interaction of calmodulin and two intrinsic regulatory
elements. J Biol Chem 281, 23111–23118.
44 Newman E, Spratt DE, Mosher J, Cheyne B,
Montgomery HJ, Wilson DL, Weinberg JB, Smith SM,
Salerno JC, Ghosh DK et al. (2004) Differential
activation of nitric-oxide synthase isozymes by
calmodulin-troponin C chimeras. J Biol Chem 279,
33547–33557.
J. C. Salerno and D. K. Ghosh Space, time and nitric oxide
FEBS Journal 276 (2009) 6677–6688 ª 2009 The Authors Journal compilation ª 2009 FEBS 6687
45 Fedorov R, Vasan R, Ghosh DK & Schlichting I (2004)
Structures of nitric oxide synthase isoforms complexed
with the inhibitor AR-R17477 suggest a rational basis
for specificity and inhibitor design. Proc Natl Acad Sci
USA 101, 5892–5897.
Supporting information
The following supplementary material is available:
Fig. S1. Differential equations describing the model in
Fig. 1.
Fig. S2. Absorbance spectra of BH4 replete nNOSox.
Fig. S3. Differential equations describing the model in
Fig. 8.
Fig. S4. Selected alternative three-electron model with
late regeneration of tetrahydrobiopterin.
Fig. S5. Selected alternative three-electron models with
random regeneration of tetrahydrobiopterin.
Fig. S6. Diffusion from a pulse of NO synthesis in a
20 lm sphere.
This supplementary material can be found in the
online version of this article.
Please note: As a service to our authors and readers,
this journal provides supporting information supplied
by the authors. Such materials are peer-reviewed and
may be re-organized for online delivery, but are not
copy-edited or typeset. Technical support issues arising
from supporting information (other than missing files)
should be addressed to the authors.
Space, time and nitric oxide J. C. Salerno and D. K. Ghosh
6688 FEBS Journal 276 (2009) 6677–6688 ª 2009 The Authors Journal compilation ª 2009 FEBS