Báo cáo khoa học: Structural mobility of the monomeric C-terminal domain of the HIV-1 capsid protein pptx
Bạn đang xem bản rút gọn của tài liệu. Xem và tải ngay bản đầy đủ của tài liệu tại đây (369.54 KB, 13 trang )
Structural mobility of the monomeric C-terminal domain
of the HIV-1 capsid protein
Luis A. Alcaraz
1,
*, Marta del A
´
lamo
2
, Mauricio G. Mateu
2
and Jose
´
L. Neira
1,3,
*
1 Instituto de Biologı
´
a Molecular y Celular, Universidad Miguel Herna
´
ndez, Elche (Alicante), Spain
2 Centro de Biologı
´
a Molecular ‘Severo Ochoa’ (CSIC-UAM), Universidad Auto
´
noma de Madrid, Spain
3 Biocomputation and Complex Systems Physics Institute, Zaragoza, Spain
Dynamic processes in proteins contribute toward defin-
ing their structure and function, including protein fold-
ing, association and ligand binding [1]. The main
challenge in all structural and dynamic studies is to
find a relationship between the structural and mobility
results, as well as protein function. Recent advances in
isotopic labelling techniques [2] and NMR spectros-
copy [3] have raised interest in protein dynamics
as provided by heteronuclear relaxation measurements
[4–6]. Relaxation of the particular backbone amide
15
N provides details of rotational tumbling, and the
movement of the internal N–H bonds [3] allows con-
clusions to be drawn on the redistribution of confor-
mational entropy upon folding and ⁄ or binding [1].
The structural retroviral polyprotein (Gag) of
HIV-1 forms the immature capsid, and is subse-
quently cleaved by the viral protease into several
mature proteins: the matrix, the capsid protein of
HIV-1 (p24) (CA), the nucleocapsid and p6, as well
as the spacer peptides p2 and p1 [7–9]. After proteo-
lytic cleavage of Gag, CA reassembles to form the
mature capsid [10]. In vitro, CA spontaneously
assembles into cylindrical structures and cones resem-
bling the viral capsid [11–15]. Dimerization through
its C-terminal domain (CAC) is a driving force in
virus assembly [14–17]. Recent studies of the mature
capsid lattice have shown that CAC connects
through homodimerization the CA hexamers, which
Keywords
flexibility; human immunodeficiency virus;
NMR; structure
Correspondence
J. L. Neira, Instituto de Biologı
´
a Molecular y
Celular, Edificio Torregaita
´
n, Universidad
Miguel Herna
´
ndez, Avenida del Ferrocarril
s ⁄ n, 03202 Elche (Alicante), Spain
Fax: +34 966 658 758
Tel: +34 966 658 459
E-mail:
*These authors contributed equally to this
work
(Received 4 February 2008, revised 22 April
2008, accepted 24 April 2008)
doi:10.1111/j.1742-4658.2008.06478.x
The capsid protein of HIV-1 (p24) (CA) forms the mature capsid of the
human immunodeficiency virus. Capsid assembly involves hexamerization
of the N-terminal domain and dimerization of the C-terminal domain of
CA (CAC), and both domains constitute potential targets for anti-HIV
therapy. CAC homodimerization occurs mainly through its second helix,
and it is abolished when its sole tryptophan is mutated to alanine. This
mutant, CACW40A, resembles a transient monomeric intermediate formed
during dimerization. Its tertiary structure is similar to that of the subunits
in the dimeric, non-mutated CAC, but the segment corresponding to the
second helix samples different conformations. The present study comprises
a comprehensive examination of the CACW40A internal dynamics. The
results obtained, with movements sampling a wide time regime (from pico-
to milliseconds), demonstrate the high flexibility of the whole monomeric
protein. The conformational exchange phenomena on the micro-to-milli-
second time scale suggest a role for internal motions in the monomer–
monomer interactions and, thus, flexibility of the polypeptide chain is likely
to contribute to the ability of the protein to adopt different conformational
states, depending on the biological environment.
Abbreviations
CA, capsid protein of HIV-1 (p24); CAC, C-terminal domain of CA, comprising residues 146–231 of the intact protein; CACW40A, mutant of
CAC with Ala instead of Trp at position 184 of CA; CSA, chemical shift anisotropy; Gag, the structural retroviral polyprotein of retroviruses;
NOE, nuclear Overhauser effect.
FEBS Journal 275 (2008) 3299–3311 ª 2008 The Authors Journal compilation ª 2008 FEBS 3299
form the mature capsid, and also interacts with the
CA N-terminal domain [18].
The CA of HIV-1 is formed by two independently
folded domains separated by a flexible linker [19–22].
The N-terminal domain (residues 1–146 of the intact
protein) is composed of five coiled-coil a-helices, with
two additional short a-helices following an extended
proline-rich loop [19–21]. The CAC domain (residues
147–231) is a dimer both in solution and in the crystal
form [22,23]. Each CAC monomer is composed of a
short 3
10
-helix followed by a strand and four a-helices:
a-helix 1 (residues 160–172), a-helix 2 (residues 178–
191), a-helix 3 (residues 195–202) and a-helix 4 (resi-
dues 209–114), which are connected by short loops or
turn-like structures. The dimerization interface is
formed by the mutual docking of a-helix 2 from each
monomer, with the side chains of each tryptophan
(Trp184) deeply buried in the dimer interface [22,23].
Our previous folding equilibrium analyses indicate that
the monomeric CAC mutant Trp184Ala, CACW40A,
resembles a transient monomeric intermediate formed
during dimerization [24,25]. In the present study, for
sake of clarity, the mutant is referred to as CACW40A
to denote the position of the mutation in the C-termi-
nal domain; in addition, the amino acids of
CACW40A are numbered from its first residue (i.e. the
added N-terminal methionine is Met1, and the second
residue is Ser2, which corresponds to Ser146 in the
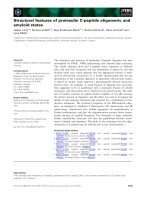
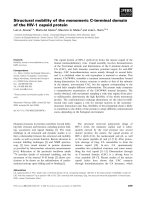
numbering of the intact CA). The CACW40A protein
is monomeric, and its structure is similar to that of the
subunits in the dimeric, non-mutated CAC, but, in
the monomeric form, the segment corresponding to the
second helix samples different conformations [26]
(Fig. 1). At the end of this region, several hydrophobic
residues are buried and, as a consequence, the last two
helices are rotated compared to their position in
dimeric non-mutated CAC. Thus, from a structural
point of view, only the dimerization interface has
substantially changed.
To determine whether the apparent dynamic charac-
ter of this region is shown by other polypeptide
patches, we have studied the dynamics of monomeric
CACW40A. Flexibility is often associated with inter-
faces, and it is well known that complex formation
(either in an oligomer or in a more simple substrate–
enzyme reaction) can lead to conformational and
dynamic changes at some, if not all, of the residues
involved [27]. In our previous description of the struc-
ture of CACW40A, we observed a high flexibility in
the region involved in the dimerization interface (as
concluded from the absence of signals in the HSQC)
[26]. In addition, millisecond-to-second dynamics was
addressed by following the hydrogen-exchange behav-
iour. In the present study, we have advanced a step
further and describe the pico-to-millisecond dynamics.
The present study aims to ascertain whether there are
regions within the CACW40A that exhibit particular
high flexibility (i.e. whether the region comprising the
dimerization interface in the non-mutated CAC is not
the sole highly mobile region). This would indicate a
lower energy barrier to structural rearrangements
throughout the whole structure. The results obtained
indicate not only that the dimerization interface dis-
plays a high flexibility, but also that the rest of the
protein is affected by movements on the pico-to-milli-
second time regime. This mobility, as shown by the
dimeric non-mutated CAC, is important in the virus
cycle, as confirmed by structural studies of CAC in the
presence of various molecules and agents [28–31].
Results
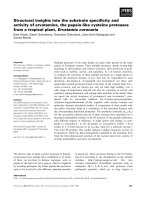
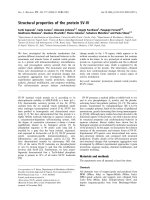
Relaxation measurements of CACW40A
Mean R
1
(= 1 ⁄ T
1
, the longitudinal relaxation rate)
was 2.95 s
)1
(range 1.49–3.69) (Fig. 2A) (see supple-
mentary Table S1). Residues in the first a -helix pre-
sented a mean of 2.90 s
)1
(range 2.56–3.69); the second
a-helix presented a mean of 3.06 s
)1
(range 2.79–3.15);
the third a-helix presented a mean of 2.78 s
)1
(range
2.26–3.05); and, finally, amino acids in the loop region
presented a mean of 3.18 s
)1
(range 2.91–3.47). There
Fig. 1. Structure of CACW40A. UCSF CHIMERA software was used to
render the model from the 2JO0 Protein Data Bank deposited
structure: the first a-helix is in blue; the second one in green; and
the last a-helix is shown in yellow. The single turn of a 3
10
-helix at
the N-terminus of the protein is shown in red.
Dynamics of monomeric CAC L. A. Alcaraz et al.
3300 FEBS Journal 275 (2008) 3299–3311 ª 2008 The Authors Journal compilation ª 2008 FEBS
was no clear correlation between the elements of sec-
ondary structure and the values of R
1
. Similar findings
have been found in proteins of similar size at the same
magnetic field, such as eglin c [32,33], CI2 [34], and the
GAL4 domain [35,36].
Mean R
2
(= 1 ⁄ T
2
, the transversal relaxation rates)
was 11.9 s
)1
(range 6.3–14.7) (Fig. 2B) (see supplemen-
tary Table S1). Residues in the first a-helix presented a
mean of 12.3 s
)1
(range 9.1–14.0); the second a-helix
presented a mean of 13.2 s
)1
(range 11.9–14.2); the
third a-helix presented a mean of 11.3 s
)1
(range 8.19–
13.5); and, finally, amino acids in the loop region
presented a mean of 12.3 s
)1
(range 9.2–14.7). As with
R
1
, there was no clear correlation between the elements
of secondary structure and the values of R
2
. However,
it is interesting to note that the values of R
2
in
CACW40A were clearly higher than those of other pro-
teins of similar size measured at the same magnetic field
(eglin c, CI2 or GAL4 with average values of 5.6, 6 and
8s
)1
, respectively [32–36]; GAL4 is the most disordered
protein, and thus shows the highest values of R
2
).
The mean of the nuclear Overhauser effect (NOE) in
CACW40A was 0.60 (range 0.28–0.87) (Fig. 2C; see
also supplementary Table S1). This mean is lower than
the value of 0.79 expected from theoretical consider-
ations at a field strength of 11.7 T [37]. These results
(together with those of the R
2
described above) suggest
a high flexibility of the whole backbone of CACW40A;
interestingly, a study of dynamics of the C-terminal
region of dimeric CAC also shows low NOE values
[38], and extensive signal broadening has been observed
in the assignment of dimeric non-mutated CAC [31].
The residues with low NOE values (< 0.65) in
CACW40A were Ile9 (at the C-cap of the 3
10
-helix);
Tyr20 (at the beginning of the first helix); Lys26 and
Ala30 (at the C-cap of the first helix); Val37 (in the mid-
dle of the long disordered loop); Thr44, Val47 and
Gln48 (at the long disordered loop); Lys55, Thr56, Ile57
and Leu58 (at the second helix); Ala60, Gly62 (in the
type II b-turn); Leu67 and Met71 (in the second helix);
and Gly78 and Gly81 (at the C terminus of the protein).
For the different regions, the first a-helix presented a
mean of 0.73 (range 0.52–0.94); the second a-helix pre-
sented a mean of 0.68 (range 0.60–0.85); and the third
a-helix presented a mean of 0.70 (range 0.61–0.90).
These data suggest that the second and third helices
were slightly more mobile than the first one, which agree
qualitatively with the last two helices showing a higher
rmsd than the rest of the elements of the secondary
structure [26]. The NOE values of CACW40A were,
however, lower than those found in other helical
regions of well-ordered proteins of similar size, such as
CI2 and eglin c (within the range 0.7–0.8) [32–34], but
they were slightly higher than the values observed in
fully unfolded proteins (within the range 0.0–0.3)
[36,39–41].
Next, we decided to use the model-free formalism
[42,43] to obtain further insight into the apparent
internal mobility of the protein. However, the overall
tumbling time of CACW40A, s
m
, must be estimated
first.
Estimation of the overall tumbling time
We used two different experimental approaches to
estimate the s
m
to avoid any potential error in the
determination of the model-free parameters.
Fig. 2. Relaxation rates of CACW40A. The relaxation rates are
shown for (A) R
1
, (B) R
2
and (C)
15
N-
1
H NOE for CACW40A at
11.7 T. Sample conditions were 293 K, pH 7.0 in 0.1
M phosphate
buffer. The cylinders at the top of each panel indicate the three
a-helices.
L. A. Alcaraz et al. Dynamics of monomeric CAC
FEBS Journal 275 (2008) 3299–3311 ª 2008 The Authors Journal compilation ª 2008 FEBS 3301
We first estimated the s
m
with tensor2, by using the
subset of rigid residues (see Experimental procedures),
yielding a value of 6.4 ± 0.1 ns.
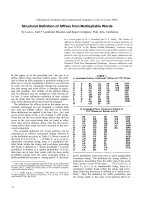
The s
m
was also determined by using the approach
developed by Wagner et al. [35,36]. Briefly, this
method assumes that, if the re-orientation of an inter-
nuclear
15
N-
1
H vector is a composite function of non-
correlated motions, then the corresponding spectral
density functions can be described as a linear combina-
tion of spectral density terms characterizing each
motion (usually two Lorentzian curves). This assump-
tion leads to a third degree equation in s, one of whose
solutions is the s
m
:
2ax
2
N
s
3
þ5bx
2
N
s
2
þ2 a À 1ðÞs þ 5b ¼ 0
where the coefficients of the cubic equation, a and b,
are obtained from the coefficients of the linear regres-
sion of the experimental J(x
N
) (i.e. the spectral density
function at the Larmor frequency of the
15
N) versus
J(0) (i.e. the spectral density function at 0 MHz)
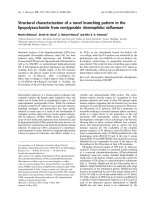
(Fig. 3). In CACW40A, the positive solutions to the
cubic equation lead to 1.28 ± 0.03 ns and
7.6 ± 0.6 ns. The first root is assigned to an internal
motion of the protein, and the second is the overall
tumbling of the molecule, which is close to the value
obtained previously. As can be observed, only a small
number of the experimental points in CACW40A are
close to the crossing point, demarcating the s
m
bound-
ary of the theoretical Lorentzian curve for the spectral
density function. Experimental points close to the
boundary imposed by the theoretical curve correspond
to residues with fast internal dynamic contributions,
whereas those undergoing slower dynamics are located
at J(0) values above the limit of the correlation time,
as occurs in CACW40A (Fig. 3).
We also used different theoretical approaches to
estimate the s
m
[44,45], and the results are similar to
those described above (data not shown). The value
used in the model-free formalism (see below) was
6.4 ± 0.1 ns. It is important to indicate that relaxation
measurements of the dimeric, non-mutated CAC have
been carried out, and the s
m
obtained is much higher
than that reported here [46].
Model-free formalism
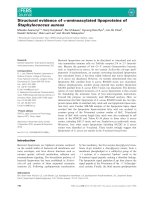
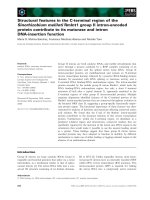
In CACW40A, the residues with high S
2
(the order
parameter) values (S
2
> 0.8) were: Arg18, Asp19,
Val21, Arg23, Phe24, Tyr25 and Ly26 (all of them
belonging to the first helix); Asn51 and Cys54 (at the
N-cap of the second helix); Ala64 and Ala65 (in the
b-turn between the second and third helices); and Thr72
and Ala73 (at the C-cap of the third helix) (Fig. 4A).
The first a-helix is the secondary structure element that
has the highest number of residues with high S
2
values.
Thus, the high S
2
values cluster at the regions of well-
defined secondary structure with a lower rmsd [26].
On the other hand, CACW40A has a large number
of residues with low values of S
2
, suggesting that those
residues are affected by fast movements (relative to
s
m
). The mean ± SD of S
2
in CACW40A is
0.56 ± 0.29 (see supplementary Table S2). This num-
ber is significantly lower than the average value of 0.86
found in other proteins [47], probably due to the long
loop in CACW40A, which is not very well hydrogen-
bonded to the rest of the structure [48].
None of the residues in CACW40A, except Ala65,
could be fitted to the simplest model of tensor2 (see
supplementary Table S2). Residues Glu15, Lys26,
Gly62, Ala73 and Gly81 could be fitted to the second
model. Amino acids Phe17, Asp19, Arg23 and Gly79
could be analysed with the third one, where an
exchange contribution, R
ex,
is included. Residues
Gln11, Thr42 and Thr72 were fitted to the fifth model;
and the remaining residues could be analysed accord-
ing to the fourth model, where R
ex
contributions and
fast movements are included. A large number of resi-
dues (i.e. those fitted to models three and four) did
experience conformational exchange on a micro-to-
millisecond time scale (Fig. 4B).
In conclusion, most of the residues in CACW40A,
and not only those in the loop region, have a fast
internal mobility. Furthermore, the fast internal corre-
Fig. 3. Relationship between J(x
N
) and J(0). The theoretical varia-
tion between both parameters assuming a simple Lorentzian curve
for the spectral density function is also shown. Experimental data
(filled squares) were fit to a linear function (y = a + bx) with:
a = 0.43 ± 0.04 nsÆrad
)1
and b = 0.05 ± 0.01 nsÆrad
)1
, which are
used in the third degree equation in s (for details, see text). Both
functions intersect at points corresponding to the overall correlation
time (s
m
) and an internal-motion time (s
e
).
Dynamics of monomeric CAC L. A. Alcaraz et al.
3302 FEBS Journal 275 (2008) 3299–3311 ª 2008 The Authors Journal compilation ª 2008 FEBS
lation time, s
e
, for the majority of amino acids was
similar to the s
m
(see supplementary Table S2). It
could be assumed that those fast s
e
values are due to a
wrong election of the diffusion tensor (e.g. the diffu-
sion tensor of CACW40A is fully anisotropic) because
it is well-known that simplified isotropic models in
which anisotropy is neglected can wrongly lead to
exchange terms [49]. However, similar values of S
2
, s
e
and R
ex
to those reported in the supplementary
(Table S2) were observed when a fully anisotropic
model was used (data not shown). All these findings
suggest that the assumptions of the model-free
approach are no longer valid in CACW40A (i.e. it is
not possible to separate the overall tumbling of the
molecule and the local fast movements of each
15
N-
1
H
bond). Thus, although the model-free approach is very
intuitive, we decided to use the reduced spectral inten-
sity formalism to test whether our results (i.e. large
mobility through all the elements of structure) were
not an artifact of the model-free approach.
Reduced spectral density approach
This approach provides insights into the motion of the
N–H bond vector at three selected frequencies, x
0
(= 0), x
N
and 0.87x
H
(Fig. 5).
As in other proteins [32,33,35,36], the J(0) (i.e. the
spectral density function at the frequency 0) had the
largest samplings of the three explored frequencies.
The J(0) showed a mean of 3.25 nsÆrad
)1
(range 1.7–
4.2 nsÆrad
)1
) (Fig. 5A; see also supplementary
Table S3). The J(0) is a sensitive probe of the nano-
to-milliseconds motion (i.e. very sensitive to the distri-
bution of correlation times): low J(0) values indicate
enhanced internal mobility on times scales faster than
the s
m
. The regions with the lowest values of J(0) in
CACW40A were clustered to: (a) the termini of the
helices and (b) the polypeptide patches in between
(Fig. 5A). However, it should be noted that J(0) con-
tains not only information on the nanosecond motions
faster than the overall tumbling of the molecules, but
also on the exchange contributions [because it relies on
R
2
; see Eqn (2) in Experimental procedures], which
increase J(0). In general, values of J(0) above the mean
value (3.25 nsÆrad
)1
) are good candidates for showing
enhanced mobility in the millisecond time scale. A
comparison of Tables S2 and S3 in the supplementary
material shows that all residues with J(0) values higher
than 3.2 ns did show a R
ex
contribution in the model-
free approach. These residues were Gly12, Lys14,
Phe17, Asp19, Tyr20, Val21, Arg23, Tyr24, Thr27,
Glu31, Val37, Met41, Thr44, Gln48, Asn49, Ala50,
Asp53 to Leu58, Leu67, Met70, Met71 and Gln75.
Because J(x
N
) (i.e. the spectral density function at
the Larmor frequency of the
15
N) and J(0.87x
H
) (i.e.
the spectral density function at the 0.87 times the Lar-
mor frequency of the
1
H) are independent of R
2
[see
Eqns (3,4) in Experimental procedures] and less sensi-
tive than J(0) to the distribution of correlation times,
they can provide insights into protein dynamics. The
mean value of J(x
N
) was 0.58 nsÆrad
)1
(range
0.28–0.76 nsÆrad
)1
) (see supplementary Table S3). The
lowest values of J(x
N
) belong to residues involved in
the polypeptide patches between the helices, and the
highest ones correspond to the rigid regions. The
values of J(0.87x
H
) were very low and only accounted
Fig. 4. The model-free approach parame-
ters. (A) The order parameter, S
2
, is shown
on the structure of the protein: 0.8 < S
2
<1
(red); 0.6 < S
2
< 0.8 (orange);
0.4 < S
2
< 0.6 (green) and 0 < S
2
< 0.4
(blue). (B) Residues that show an R
ex
term
are shown on the structure of the protein:
10 < R
ex
<16s
)1
(red); 5 < R
ex
<10s
)1
(orange) and 0 < R
ex
<5s
)1
(blue).
L. A. Alcaraz et al. Dynamics of monomeric CAC
FEBS Journal 275 (2008) 3299–3311 ª 2008 The Authors Journal compilation ª 2008 FEBS 3303
for a 1% of J(0) (Fig. 5B). The mean value was
0.0138 nsÆrad
)1
(range 0.00138–0.0245) (see supplemen-
tary Table S3). The tendency in J(0.87x
H
) was the
opposite to that observed in J(0): the highest values in
J(0.87x
H
) correspond to the termini of the helices and
the regions in between, indicating efficient picosecond
averaging.
In conclusion, using the reduced spectral density
approach, analysis of the relaxation parameters shows
that the regions between helices are highly mobile, but
also the rest of the structure has a high flexibility (in
qualitative agreement with the model-free formalism);
the three helices appeared rigid but they showed
mobility in the pico-to-nanosecond time scale. Further-
more, from the high J(0) values, there was evidence of
enhanced mobility in the millisecond time regime in
residues involved in the protein core and forming the
last two helices, which showed R
ex
and ⁄ or long s
e
values (i.e. within the same order of magnitude than
s
m
) in the model-free formalism (see supplementary
Tables S2 and S3). Thus, both approaches qualitatively
agree in demonstrating a high internal flexibility of the
molecule.
Discussion
We first discuss the results obtained within the frame-
work provided by the structural elements of mono-
meric CACW40A. Subsequently, we examine the
biological and thermodynamical implications of such a
high flexibility.
Backbone dynamics and the relationship
to structure in CACW40A
One of the possible uses of
15
N backbone dynamics is
to predict regions of a protein with sufficient potential
flexibility to allow functional events to occur (binding,
conformational changes or catalysis). However, experi-
ments with several dozens of proteins [27] demonstrate
that there is no easy and general correspondence
between the order parameter (S
2
), the spectral density
function [J(x)] and the secondary structural elements
of a protein. Furthermore, there are no simple rules
for the interpretation of the exchange rates (R
ex
)or
the different correlation times (s
m
, s
s
or s
f
).
In CACW40A, although the helical elements have
the highest order parameters, there is no relationship
between S
2
and the location of structural elements
(Fig. 4). Furthermore, the R
ex
terms are distributed
throughout the 3D structure of the protein, and most
of them are large (Fig. 4); the exception is Tyr25, with
an R
ex
value of 0.5, which indicates that the dynamics
of its
15
N backbone nuclei is not robustly identified by
the used calculation protocol [50]. Thus, it appears
that the whole protein is experiencing the same type of
movements, ranging from pico- to milliseconds.
Furthermore, there is no correlation between the
motions measured by R
ex
and the motions probed by
hydrogen-exchange [26], where only the residues
involved in the helices are protected. For example, the
first helix, which has the highest S
2
values and is rela-
tively well-ordered in the pico-to-nanosecond time
scale, exhibits extensive ‘opening ⁄ closing’ equilibria on
Fig. 5. The reduced spectral density approach. Values of spectral
density functions: (A) J(0), (B) J(x
N
) and (C) J(0.87x
H
) versus the
protein sequence. The cylinders at the top of each panel indicate
the a-helices.
Dynamics of monomeric CAC L. A. Alcaraz et al.
3304 FEBS Journal 275 (2008) 3299–3311 ª 2008 The Authors Journal compilation ª 2008 FEBS
a much slower time regime than the other helices.
These equilibria also occur in the other two helices, as
shown by the exchange pattern [26], although they are
less well-ordered, as judged by the lower S
2
.
The types of movements and the residues involved
are described below.
The pico-to-nanosecond dynamics
Residue Ala65 (at the N-terminus of the third helix) is
the sole residue that has restricted internal dynamics
(model-free formalism). Fast internal dynamics (i.e.
residues with at least another tumbling time) occurs at
the N (Gln11 and Glu15) and at the C-termini of the
first a-helix (Lys26); in the long disordered loop
(Thr42); and at the N- (Gly62, Ala64), and C-termini
of the third helix (Thr72, Ala73). However, it is not
possible to establish any correlation between any
structural parameter of those residues and the fast
dynamics observed.
The micro-to-millisecond dynamics
Most of the residues in CACW40A required an R
ex
term (model-free formalism) or had long J(0) values
(reduced-spectral approach); furthermore, most of the
residues in the loop (which forms the second helix in
the dimeric non-mutated CAC protein [22,23]) were
broad beyond detection in the HSQC experiments [26].
Although the arguments could be considered as specu-
lative, the highest R
ex
values observed in some amino
acids of CACW40A (see supplementary Table S2)
might be ascribed to the proximity of the particular
residue to either aromatic or Cys residues, as described
in other proteins [37,50,51]. Residues Val37, Met41
and Thr44 belong to the long disordered loop [26],
buried within the structure, but only the amide proton
of Thr44 is hydrogen-bonded. We do not know how
to ascribe the exchange contribution of Val37 and
Met41 to any particular dynamic process. In other
proteins, similar micro-to-milliseconds exchange contri-
butions have been observed in well-buried protons,
and they have been explained as due to buried water
molecules [37]. Finally, it is important to note that not
only were residues belonging to the second helix absent
in the NMR spectra of CACW40A, but also they did
not appear in the spectrum of the dimeric wild-type
protein [29,31], nor did they appear under physiologi-
cal conditions in the NMR spectrum of another
recently reported monomeric mutant [52]. These find-
ings suggest that the reported flexibility in the domain
is not a particular characteristic of the mutant, but is
an intrinsic feature of the whole dimeric CAC domain.
Model-free analysis versus spectral density
mapping
Our results indicate that the relaxation data of
CACW40A could not be satisfactorily explained by the
model-free method. In this formalism, the correlation
function (the function describing the movement) of each
bond vector is decomposed as the product of the corre-
lation function for overall (global) and internal (local)
motions (i.e. the internal motions of the bond vectors
are independent of the overall rotational movement of
the molecule). Furthermore, the internal motions of
each bond vector are independent of each other, but the
rotational diffusion of the molecule affects each of those
bond vectors identically [42,43]. On the other hand,
spectral density mapping makes no assumptions about
the nature of the rotational diffusion (i.e. the informa-
tion on which oscillations for a particular bond vector
are associated with global molecular rotation or segmen-
tal molecular motions is lost). Thus, based on the spec-
tral density formalism results, we are unable to discern
whether the movement of each NH bond is due to local
internal or overall tumbling, but we can conclude that
the CACW40A has an intrinsically high structural mobi-
lity (Figs 4 and 5). To support this conclusion, the s
e
s
obtained from the model-free approach for most of the
residues are similar (i.e. they are not faster) than the
overall molecular tumbling of the protein; this means
that we cannot strictly separate the overall tumbling of
the molecule from the internal motions of each bond
vector and, thus, the model-free formalism cannot be rig-
orously applied. This is not the sole example where the
use of the model-free formalism has been unsuccessful:
this approach cannot be applied on natively unfolded
proteins, proteins at high temperatures [27,39,53–55], or,
even recently, in otherwise well-behaving proteins [56].
Biological and thermodynamic implications
Our study on the dynamics of CACW40A indicates that
the protein is structurally very flexible, while preserving
most of the native scaffold [26]. It could be assumed that
this flexibility is due exclusively to the mutation; how-
ever, although the mutation increases the flexibility
(because the quaternary structure is lost), the high flexi-
bility is present in the structure of CAC, as suggested by
several studies. First, similar dynamic results have been
observed for the C-terminal region of dimeric, non-
mutated CAC [38], and in residues belonging to its
dimerization interface [29,31]. Second, it has been
observed that: (a) CAC is able to form swapped
domains involving the major homology region and the
second a-helix [28,57]; (b) CAC is able to bind a peptide
L. A. Alcaraz et al. Dynamics of monomeric CAC
FEBS Journal 275 (2008) 3299–3311 ª 2008 The Authors Journal compilation ª 2008 FEBS 3305
forming a five-helical bundle [29]; (c) the second and
third helix in CAC appear to be distorted upon binding
to lipids [30]; and (d) the fourth helix in CAC is involved
in binding to lysyl-tRNA synthetase [31]. Thus, these
studies show that the CAC domain is able to alter its
structure and promote other interactions in the presence
of an external agent (lipids, peptides, other regions of
the Gag protein, or even other proteins). In the first
three examples, the second helix (as in CACW40A) was
the main element of secondary structure affected; in the
last example, the fourth helix was the element altered.
The detection of slow dynamics not only at the dimer-
ization interface (residues Glu31 to Ala40), but also in
the rest of the protein implies the presence of a small
population of pre-existing conformers within the native-
state ensemble. This population interacts with other
CACW40A monomers forming the dimeric CAC, prob-
ably through the side chains of the hydrophobic residues
of the long disordered loop, buried to avoid nonspecific
hydrophobic interactions [26]. There are several exam-
ples of proteins in which binding residues are involved
in slow-exchange processes [27,58], most likely to facili-
tate rapid partner-binding, and the recognition of
several ligands. Internal motions allow amino acids to
explore large regions of the conformational space at a
very low energetic cost, increasing the chances of
successful binding. However, are those slow-exchange
processes responsible, from a thermodynamic point of
view, for the binding of the monomeric species of CAC?
We have previously discussed the variation in the free
energy of binding as a function of the changes in buried
surface area upon dimer formation [59]. On the other
hand, there are no clear correlations between the
enthalpy of binding and the changes in buried surface
area [60]; thus, the only thermodynamic magnitude that
has not been estimated in CAC is the binding entropy
change, DS
b
. The binding entropy, DS
b
, can be divided
into terms defining the solvent (hydrophobic) (DS
sol
),
the conformational flexibility (DS
con
) and the rotation-
translation portion (DS
rt
) entropies: DS
b
= DS
sol
+
DS
con
+ DS
rt
. The DS
rt
accounts for )50 calÆmol
)1
ÆK
)1
[61,62]. The solvent portion of the entropy can be calcu-
lated as a function of changes in polar and apolar
surface areas of the binding interface, according to:
DS
sol
= DC
p
ln(T ⁄ 385), where DC
p
is the heat capacity
change of the binding reaction. We have previously
determined the DC
p
()211 ± 10 calÆmol
)1
ÆK
)1
per
monomer) and DS
b
()230 ± 10 calÆmol
)1
ÆK
)1
per
monomer) [59], and then, the contribution from the
conformational flexibility to the entire entropy of
binding will be: DS
con
= )234 calÆmol
)1
ÆK
)1
per mono-
mer. Because, on average, the entropy cost per amino
acid for a folding transition is approximately
5.6 calÆmol
)1
ÆK
)1
[63], the estimated DS
con
in CAC upon
binding of the two monomers is due to the cost of fixing
42 residues. This value is much higher than the number
of residues present in the long loop, which is disordered
in CACW40A (14 residues), and the difference must be
associated with: (a) the movements of the last two
helices, as observed in the monomeric structure of CAC,
and (b) the inherent flexibility for the majority of the
residues. Thus, the conformational entropy appears to
be distributed through the whole structure of the mono-
meric species, sampling a wider range of dynamic move-
ments, and not only located at the residues in the
interface. In summary, we suggest that the inherent flexi-
bility of the CAC domain is consistent with the presence
of a low thermodynamic barrier to diverse, template-
assisted conformational changes, that allow interaction
with several macromolecules.
Experimental procedures
Materials
Deuterium oxide was obtained from Apollo Scientific
(Bredbury Stockport, UK), and the sodium trimethylsilyl
[2,2,3,3-
2
H
4
] propionate was obtained from Sigma (Madrid,
Spain). Dialysis tubing was obtained from Spectrapore
(Breda, the Netherlands), with a molecular mass cut-off
of 3500 Da. Standard suppliers were used for all other
chemicals. Water was deionized and purified on a Millipore
(Barcelona, Spain) system.
Protein expression and purification
The
15
N-labelled CACW40A protein was expressed in
Escherichia coli BL21(DE3) in LB and purified as previ-
ously described [26]; the DNA segment used for the mutant
protein encoded for residues 146–231 of CA from HIV-1
(strain BH10) and was cloned as described [24]. The protein
concentration was calculated from A
240
by using the extinc-
tion coefficients of amino acids [64]. Samples were concen-
trated at the desired final NMR concentration by using
Centriprep Amicon devices (Millipore), with a molecular
mass cut-off of 3500 Da.
Protein structure calculations
The determination of the solvent-accessible surface area
was obtained using the VADAR web server [65].
NMR samples
All NMR experiments were acquired on an Avance Bruker
DRX-500 spectrometer (Bruker, Karlsruhe, Germany)
Dynamics of monomeric CAC L. A. Alcaraz et al.
3306 FEBS Journal 275 (2008) 3299–3311 ª 2008 The Authors Journal compilation ª 2008 FEBS
equipped with a triple resonance probe and pulse field
gradients. Sample temperature was calibrated using a
100% methanol standard [66].
NMR relaxation measurements
NMR relaxation data were collected at 293 K.
15
N-T
1
,
15
N-T
2
and
1
H-
15
N NOE experiments were acquired using
enhanced sensitivity, gradient pulse sequences developed by
Farrow et al. [67]. All spectra were recorded as 128 · 2K
complex matrices with 64 scans per F
1
experiment. Spectral
widths of 1650 and 8000 Hz were used in F
1
and F
2
respec-
tively.
A total of 10 data sets were acquired to obtain
15
N-T
1
rates
using relaxation delays of 50, 100 (· 2), 200, 300, 400, 500,
600, 700 (· 2), 850 and 1000 ms, where the experiments at
100 and 700 ms were repeated twice. The
15
N-T
2
measure-
ments were made using delays of 15, 25 (· 2), 50, 100, 150,
175, 225 (· 2), 300 and 425 ms. For the T
1
and T
2
pulse
sequences, the delay between transients was 5 s. The
1
H-
15
N
NOEs were measured by recording interleaved spectra in the
presence and in the absence of proton saturation. The spec-
trum recorded in the presence of proton saturation was
acquired with a saturation time of 5 s. The spectrum
recorded without proton saturation incorporated a relaxa-
tion delay of 5 s. Each experiment was repeated twice.
Experiments were carried out at two protein concentra-
tions (1 mm and 400 lm) to rule out any possible concen-
tration-dependent effect on the measured relaxation rates,
as has been observed in dimeric non-mutated CAC [46].
The measured rates were identical at both concentrations
within the experimental error (see supplementary Table S1).
Data processing and analysis of the NMR
relaxation measurements
The spectra were zero-filled in the F
1
dimension four times
and processed by using a shifted sine window function. The
same window function was used through all the T
1
and T
2
experiments. Cross-peaks intensities were measured as
volumes, with the xwinnmr software package (Bruker).
The T
1
and T
2
values were determined by fitting the
measured peak-heights to a two-parameter function:
IðtÞ¼I
0
expðÀt=T
1;2
Þ; ð1Þ
where I(t) is the peak intensity after a delay t and I
0
is the
intensity at zero time; errors in the relaxation rates were
calculated from fitting to Eqn (1). The data were fitted to
Eqn (1) with kaleidagraph software (Abelbeck Software,
Reading, PA, USA).
The steady-state NOE values were determined from the
ratios of the peak intensities with and without proton satu-
ration (i.e. NOE = I
sat
⁄ I
nonsat
). The standard deviation of
the NOE value was determined on the basis of the measured
background noise levels by using the repeated experiments.
The T
1
and T
2
relaxation times (or, R
1
=1⁄ T
1
and
R
2
=1⁄ T
2
) and the NOE enhancement of an amide
15
N
nucleus are dominated by the dipolar interaction of the
15
N
nucleus with its attached proton and by the chemical shift
anisotropy (CSA). The energy of the CSA and the dipolar
interaction has a constant value over all the ensemble of spins
[68]. The spectral density function, J(x), expresses how this
energy is distributed over all the spectrum of possible fre-
quencies, x, explored by the spins. The measured rates for
each NH are related to the J(x) at the nuclear spin frequen-
cies [68], and they can be approximated as (the so-called
‘reduced spectral density mapping approach’) [32,33,69]:
Jð0Þ¼ð6R
2
À3R
1
À2:72r
NH
Þ=ð3d
2
þ4c
2
Þ; ð2Þ
Jðx
N
Þ¼ð4R
1
À5r
NH
Þ=ð3d
2
þ4c
2
Þ; ð3Þ
Jð0:87x
N
Þ¼ð4r
NH
Þ=ð5d
2
Þ; ð4Þ
and
r
NH
¼ R
1
ðNOE À 1Þðc
N
=c
H
Þ; ð5Þ
where c =(x
N
⁄Ö3)(r
||
– r
^
) and d = l
0
hc
N
c
H
⁄ (8p
2
<
r > 3), l
0
is the permeability constant of the free space, c
N
and c
H
are the gyromagnetic ratios of
15
N
()2.71 · 10
7
radÆs
)1
ÆT
)1
) and
1
H (2.68 · 10
8
radÆs
)1
ÆT
)1
), h
is the Planck constant, x
N
is the Larmor frequency of the
15
N, x
H
is the Larmor frequency of the
1
H, <r> is the
length of the amide bond vector (1.02 A
˚
), and r
||
and r
^
are the parallel and perpendicular components of the CSA
tensor (r
||
)r
^
= )160 p.p.m for a backbone amide [70]).
The uncertainties in a particular J(x) are the quadrature-
weighted sum derived from Eqns (2–5), assuming that
errors in the relaxation rate constants are independent.
Rotational diffusion tensor
An initial estimation of s
m
and the rotational diffusion ten-
sors were obtained with tensor2 [71], from the subset of
residues which accomplished the following criteria [72]: (a)
all residues should have a NOE ‡ 0.65 and (b) the residues
should satisfy:
R
2;i
À
R
2
hi
R
2
hi
À
R
1;i
À
R
1
hi
R
1
hi
<1:5r
where <R
j
> and <R
j,i
> (where j = 1,2 and i is the residue
number) are, respectively, the average rates and the indi-
vidual R
1
and R
2
rates of the subset of remaining residues
satisfying criteria (a), and r is the standard deviation of:
R
2;i
À
R
2
hi
R
2
hi
À
R
1;i
À
R
1
hi
R
1
hi
The residues which did not accomplish criterion (a) were
Ile9, Lys26, Ala30, Val37, Thr44, Val47, Gln48, Lys55,
Thr56, Ile57, Leu58, Ala60, Gly62, Leu67, Met71, Gly78
L. A. Alcaraz et al. Dynamics of monomeric CAC
FEBS Journal 275 (2008) 3299–3311 ª 2008 The Authors Journal compilation ª 2008 FEBS 3307
and Gly81; and those which did not satisfy criterion (b)
were Gln11, Glu15, Asp19 and Thr42 (see supplementary
Table S1). Furthermore, the cross-peaks of Asp22, Leu28,
Gln32, Lys38, Glu43, Leu45, Leu46, Leu61, Thr66, Cys74
and Val77 overlapped and they were not used in the
dynamic analysis. Thus, a total number of 39 residues were
used to estimate the s
m
and the rotational diffusion tensors.
The determination of the tumbling of CACW40A was
carried out with tensor2. The rotational diffusion in the
isotropic, axially symmetric or anisotropic schemes was
explored by using 1000 Monte Carlo steps. Briefly, F-test
analysis was performed to choose between isotropic, axially
symmetric and fully anisotropic diffusion models. A proba-
bility factor of 0.2, which indicates whether the probability
of improvement in different fits when complexity increases
is coincidental, was calculated for: (a) an isotropic and axi-
ally symmetric pair of models and (b) an axially symmetric
and a fully anisotropic pair of models. In both cases, the
experimentally determined F-value was lower than that at
0.2 of probability, indicating that either the axially symmet-
ric and the fully anisotropic model did not improve statisti-
cally the fitting. Thus, CACW40A showed isotropic
tumbling.
The model-free approach
In the Lipari–Szabo model-free formalism [42,43], J(x)is
defined in terms of: (a) the overall tumbling time, s
m
(in the
order of nanoseconds), and the diffusion anisotropy; (b) the
time scale of internal motions faster than s
m
, the so-called
effective internal correlation time, s
e
(in the pico-to-nano-
second time scale); and (c) the degree of restriction of these
fast internal motions (which is measured by the square of
the order parameter, S
2
). Thus, in residues where the relax-
ation mechanism is dominated by the internal motion (i.e.
residues highly mobile relative to the overall rotational
tumbling), S
2
would approach to zero; on the other hand,
in residues where relaxation is described only by the global
motion of the molecule, S
2
would approach to the unity.
Extensions of this formalism have been developed to incor-
porate two time scales of internal motions or to account
for the effects of slow (micro-to-millisecond time scale) con-
formational exchange; in these cases, the global order
parameter is defined as S
2
= S
2
f
S
2
s
, where S
2
f
and S
2
s
are
the order parameters for faster and slower motions,
respectively.
The calculations of the S
2
and s
e
parameters were carried
out using tensor2, with a Monte Carlo simulation of 1000
steps. The program models the internal dynamics of each
15
N–H bond for which R
1
, R
2
and NOE parameters are
available, with five different models [71,72]: (a) in the first
model, the s
e
of each amide proton is very fast and not
relaxation-active; (b) in the second model, the s
e
is relaxa-
tion-active; (c) the third model is identical to the first,
except the conformational (or chemical) exchange on a
microsecond-to-millisecond time scale is taken into account
(by using the R
ex
parameter); (d) the fourth model is identi-
cal to (b), but also includes the R
ex
term; and (e) the fifth
model includes the extension of the formalism, with
two kinds of internal motions: one very fast and other
very slow.
Acknowledgements
We thank the two anonymous reviewers for their help-
ful suggestions and discussions. This work was sup-
ported by grants from Ministerio de Sanidad y
Consumo (MSC) (FIS 01 ⁄ 0004-02), Ministerio de Edu-
cacio
´
n y Ciencia (MEC) (CTQ2005-00360⁄ BQU) and
the private organization FIPSE (Exp: 36557⁄06) to
J. L. N.; grants from MSC (FIS 01 ⁄ 0004-01) and
MEC (BIO2006-00793) and the private organization
FIPSE (Exp: 36557 ⁄ 06) to M. G. M., and by institu-
tional grants from Fundacio
´
n Ramo
´
n Areces to the
Centro de Biologı
´
a Molecular ‘Severo Ochoa’. We sin-
cerely thank May Garcı
´
a, Marı
´
a del Carmen Fuster,
Javier Casanova and Olga Ruiz de los Pan
˜
os for their
excellent technical assistance.
References
1 Stone MJ (2001) NMR relaxation studies of the role of
conformational entropy in protein stability and ligand
binding. Acc Chem Res 34, 379–388.
2 LeMaster DM (1994) Isotope labelling in solution pro-
tein assignment and structural analysis. Prog NMR
Spectrosc 26, 371–419.
3 Kay LE (1998) Protein dynamics from NMR. Nat
Struct Biol 5, 513–517.
4 Ishima R & Torchia DA (2000) Protein dynamics from
NMR. Nat Struct Biol 7, 740–743.
5 Fischer MWF, Majumdar A & Zuiderweg ERP (1998)
Protein NMR relaxation: theory, applications and out-
look. Prog NMR Spectrosc 33, 207–272.
6 Palmer AG, Willimas J & McDermott A (1996) Nuclear
magnetic resonance of biopolymer dynamics. J Phys
Chem 100, 13293–13310.
7 Freed EO (1998) HIV-1 gag proteins: diverse functions
in the virus life cycle. Virology 251, 1–15.
8 Freed EO & Martin M (2001) HIVs and their replica-
tion. In Fields Virology (Knipe DM & Howley PM,
eds), pp. 1971–2041. Lippincott, Philadelphia, PA.
9 Vogt VM (1996) Proteolytic processing and
particle maturation. Curr Top Microbiol Immunol 214,
95–132.
10 Fuller TW, Wilk T, Gowen BE, Kra
¨
usslich H-G &
Vogt VM (1997) Cryo-electron microscopy reveals
ordered domains in the immature HIV-1 particle. Curr
Biol 7, 729–738.
Dynamics of monomeric CAC L. A. Alcaraz et al.
3308 FEBS Journal 275 (2008) 3299–3311 ª 2008 The Authors Journal compilation ª 2008 FEBS
11 Ehrlich LS, Agresta BE & Carter CA (1992) Assembly
of recombinant human immunodeficiency virus type 1
capsid protein in vitro. J Virol 66, 4874–4883.
12 Grob I, Hohenberg H & Kra
¨
usslich H-G (1997) In vitro
assembly properties of purified bacterially expressed
capsid proteins of human immunodeficiency virus. Eur
J Biochem 249, 592–600.
13 Grob I, Hohenberg H, Huckangel C & Kra
¨
usslich H-G
(1998) N-terminal extension of human immunodefi-
ciency virus capsid protein converts the in vitro assem-
bly phenotype from tubular to spherical particles.
J Virol 72, 4798–4810.
14 Ganser BK, Li S, Kliskho VY, Finch JT & Sundquist
WI (1999) Assembly and analysis of conical models for
the HIV-1 core. Science 283, 80–83.
15 Li S, Hill CP, Sundquist WI & Finch JT (2000) Image
reconstructions of helical assemblies of the HIV-1 CA
protein. Nature 407, 409–413.
16 Borsetti A, O
¨
hagen A
˚
&Go
¨
ttlinger HG (1998) The
C-terminal half of the human immunodeficiency virus
type 1 Gag precursor is sufficient for efficient particle
assembly. J Virol 72, 9313–9317.
17 Wang CT & Barklis E (1993) Assembly, processing and
infectivity of human immunodeficiency virus type 1 Gag
mutants. J Virol 67, 4264–4273.
18 Ganser-Pornillos BK, Cheng A & Yeager M (2007)
Structure of a full-length HIV-1 CA: a model for the
mature capsid lattice. Cell 131, 70–79.
19 Momany C, Kovari LC, Prongay AJ, Keller W, Gitti
RK, Lee BM, Gorbalenya AE, Tong L, McClure J,
Ehrlich LS et al. (1996) Crystal structure of dimeric
HIV-1 capsid protein. Nat Struct Biol 3, 763–770.
20 Gitti RK, Lee BM, Walker J, Summers MF, Yoo S &
Sundquist WI (1996) Structure of the amino-terminal
core domain of the HIV-1 capsid protein. Science 273,
231–235.
21 Gamble TR, Vajdos FF, Yoo S, Worthylake DK, Hou-
seweart M, Sundquist WI & Hill CP (1996) Crystal
structure of human cyclophilin A bound to the amino-
terminal domain of HIV-1 capsid. Cell 87, 1285–1294.
22 Gamble TR, Yoo S, Vajdos FF, von Schwedler UK,
Worthylake DK, Wang H, McCutcheon JP, Sundquist
WI & Hill CP (1997) Structure of the carboxyl-terminal
dimerization domain of the HIV-1 capsid protein.
Science 278, 849–853.
23 Worthylake DK, Wang H, Yoo S, Sundquist WI & Hill
CP (1999) Structures of the HIV-1 capsid protein
dimerization domain at 2.6 A
˚
resolution. Acta Crystal-
logr D 55, 85–92.
24 Mateu MG (2002) Conformational stability of dimeric
and monomeric forms of the C-terminal domain of
human immunodeficiency virus-1 capsid protein. J Mol
Biol 318, 519–531.
25 del Alamo M, Neira JL & Mateu MG (2003) Thermo-
dynamic dissection of a low-affinity protein-protein
interface involved in human immunodeficiency virus
assembly. J Biol Chem 278, 27923–27929.
26 Alcaraz LA, del A
´
lamo M, del Barrera FN, Mateu MG
& Neira JL (2007) Flexibility in HIV-1 assembly subun-
its: solution structure of the monomeric C-terminal
domain of the capsid protein. Biophys J 93, 1264–1276.
27 Jarymowicz VA & Stone MJ (2006) Fast time scale
dynamics of protein backbones: NMR relaxation meth-
ods, applications and functional consequences. Chem
Rev 106, 1624–1671.
28 Ivanov D, Tsodikov OV, Kasanov J, Elenberger T,
Wagner G & Collins T (2007) Domain-swapped dimer-
ization of the HIV-1 capsid C terminal domain. Proc
Natl Acad Sci USA 104, 4353–4358.
29 Ternois F, Stitch J, Duquerroy S, Kra
¨
usslich H-G &
Rey FA (2005) The HIV-1 capsid protein C-terminal
domain in complex with a virus assembly inhibitor. Nat
Struct Mol Biol 12, 678–682.
30 Barrera FN, Hurtado-Go
´
mez E, Lido
´
n-Moya MC &
Neira JL (2006) Binding of the C-terminal domain of
the HIV-1 capsid protein to lipid membranes: a bio-
physical characterization. Biochem J 394, 345–353.
31 Kovaleski BJ, Kenedy R, Khorchid A, Kleiman L, Ma-
tsuo H & Musier-Forsyth K (2007) Critical role of helix
4 of HIV-1 capsid C-terminal domain in interactions
with human lysyl-tRNA synthetase. J Biol Chem 282,
32274–32279.
32 Peng JW & Wagner G (1992) Mapping of the spectral
densities of N-H bond motions in eglin c using heter-
onuclar relaxation experiments. Biochemistry 31, 8571–
8586.
33 Peng JW & Wagner G (1995) Frequency spectrum of
NH bonds in eglin c from spectral density mapping at
multiple fields. Biochemistry 34, 16733–16752.
34 Shaw GL, Davis B, Keeler J & Fersht AR (1995) Back-
bone dynamics of chymotrypisn inhibitor 2: effect of
breaking the active site bond and its implications for
the mechanism of inhibition of serine proteases. Bio-
chemistry 34, 2225–2233.
35 Lefe
`
vre JF, Dayie KT, Peng JW & Wagner G (1996)
Internal mobility in the partially folded DNA binding
and dimerization domains of GAL4: NMR analysis of
the N-H spectral density functions. Biochemistry 35,
2674–2686.
36 Dayi KT, Wagner G & Lefe
`
vre JF (1996) Theory and
practice of nuclear spin relaxation in proteins. Annu
Rev Phys Chem 47, 243–282.
37 Perez-Can
˜
adillas JM, Guenneugues M, Campos-Olivas
R, Santoro J, Martı
´
nez del Pozo A, Gavilanes JG, Rico
M & Bruix M (2002) Backbone dynamics of the cyto-
toxic ribonuclease a-sarcin by
15
N NMR relaxation
methods. J Biomol NMR 24, 301–316.
38 Newman JL, Butcher EW, Patel DT, Mikhaylenko Y &
Summers MF (2004) Flexibility in the P2 domain of the
HIV-1 Gag polyprotein. Protein Sci 13, 2101–2107.
L. A. Alcaraz et al. Dynamics of monomeric CAC
FEBS Journal 275 (2008) 3299–3311 ª 2008 The Authors Journal compilation ª 2008 FEBS 3309
39 Farrow NA, Zhang O, Forman- Kay JD & Kay LE
(1997) Characterization of the backbone dynamics of
folded and denatured states of an SH3 domain.
Biochemistry 36, 2390–2402.
40 Shojania S & Neil JDO (2006) HIV-1 Tat is a natively
unfolded protein. The solution conformation and
dynamics of reduced HIV-1 Tat(1-72) by NMR
spectroscopy. J Biol Chem 281, 8347–8356.
41 Chugha P & Oas TG (2007) Backbone dynamics of the
monomeric denatured ensemble under nondenaturing
conditions. Biochemistry 46, 1141–1151.
42 Lipari G & Szabo A (1982) Model free approach to the
interpretation of nuclear magnetic resonance relaxation
in macromolecules. 1. Theory and range of validity.
J Am Chem Soc 104, 4546–4559.
43 Lipari G & Szabo A (1982) Model free approach to the
interpretation of nuclear magnetic resonance relaxation
in macromolecules. 2. Analysis of experimental results.
J Am Chem Soc 104, 4559–4570.
44 Daragna VA & Mayo KH (1997) Motional analyses of
protein and peptide dynamics using
13
C and
15
N NMR
relaxation. Prog NMR Spectrosc 31, 63–105.
45 Krishnan VV & Cosman M (1998) An empirical rela-
tionship between rotational correlation time and solvent
accessible surface area. J Biomol NMR 12, 177–182.
46 Stitch J, Humbert M, Fidlow S, Bodem J, Mu
¨
ller B,
Dietrich U, Werner J & Kra
¨
usslich H-G (2005) A pep-
tide inhibitor of HIV-1 assembly in vitro. Nat Struct
Mol Biol 12, 671–677.
47 Goodman JL, Pagel MD & Stone MJ (2000) Relation-
ships between dynamics from a database of NMR-
derived backbone order parameters. J Mol Biol 295,
963–978.
48 Akerud T, Thulin E, van Etten RL & Akke M (2002)
Intramolecular dynamics of low molecular weight pro-
tein tyrosine phosphatase in monomer-dimer equilib-
rium studied by NMR: a model for changes in
dynamics upon target binding. J Mol Biol 322, 137–152.
49 Tjandra N, Feller SE, Pastor RW & Bax A (1995)
Rotational diffusion anisotropy of human ubiquitin
from
15
N NMR relaxation. J Am Chem Soc 117,
12562–12566.
50 Guignard L, Padilla A, Mispelter J, Yang YS, Stern
MH, Lhoste JM & Roumestand C (2000) Backbone
dynamics and solution structure refinement of the
15
N-labeled human oncogenic protein p13MTCP1: com-
parison with X-ray data. J Biomol NMR 17, 215–230.
51 Auguin D, Barthe P, Auge
´
-Se
´
ne
´
gas MT, Stern MH,
Noguchi M & Roumestand C (2004) Solution structure
and backbone dynamics of the pleckstrin homology
domain of the human protein kinease B (PKB ⁄ Akt).
Interactions with inositol phosphates. J Biomol NMR
28, 137–155.
52 Wong HC, Shin R & Krishan NR (2008) Solution
structure of a double mutant of the carboxy-terminal
dimerization domain of the HIV-1 capsid protein.
Biochemistry 47, 2289–2297.
53 Viles JH, Donne D, Kroon G, Prusiner SB, Cohen FE,
Dyson HJ & Wright PE (2001) Local structural plastic-
ity of the prion protein. Analysis of NMR relaxation
dynamics. Biochemistry 40, 2743–2753.
54 Mandel AM, Akke M & Palmer AG (1997) Dynam-
ics of ribonuclease H: temperature dependence of
motions on multiple time scales. Biochemistry 35,
16009–16023.
55 Bracken C, Carr PA, Cavanagh J & Palmer AG (1999)
Temperature dependence of intramolecular dynamics of
the basic leucine zipper of GCN4: implications for the
entropy of association with DNA. J Mol Biol 285,
2133–2146.
56 Gu
¨
mral D, Nadalim L, Corazza A, Fogolari F, Daman-
te G, Viglino P & Esposito G (2008) Helix mobility and
recognition function of the rat thyroid transcription fac-
tor 1 homeodomain-hints from
15
N-NMR relaxation
studies. FEBS J 275, 435–448.
57 Ivanov D, Stone JR, Maki JL, Collins T & Wagner G
(2005) Mammalian SCAN domain dimer is a domain
swapped homolog of the HIV capsid C-terminal
domain. Mol Cell 17, 137–143.
58 Botuyan MV, Mer G, Yi G-S, Koth CM, Case D,
Edwards AM, Chazin WJ & Arrowsmith CH (2001)
Solution structure and dynamics of yeast elongin C in
complex with a von-Hippel-Lindau peptide. J Mol Biol
312, 177–186.
59 Lido
´
n-Moya MC, Barrera FN, Bueno M, Pe
´
rez-Jime
´
nez
R, Sancho J, Mateu MG & Neira JL (2005) An exten-
sive thermodynamic characterization of the dimerization
domain of the HIV-1 capsid protein. Protein Sci 14,
2387–2404.
60 Sundberg EJ, Urrutia M, Braden BC, Isern J, Tsuchiya
D, Fields BA, Malchiodi EL, Tyormo J, Schwarz FP &
Mariuzza RA (2000) Estimation of the hydrophobic
effect in an antigen-antibody protein-protein interface.
Biochemistry 39, 15375–15387.
61 Freire E. (2001) The thermodynamic linkage between
protein structure, stability and function. In Methods in
Molecular Biology (vol. 168): Protein Structure, Stabil-
ity and Folding (Murphy KP, ed.), pp. 37–68. Humana
Press Inc., Totowa, NJ.
62 Prabhu NV & Sharp KA (2005) Heat capacity in
proteins. Annu Rev Phys Chem 56, 521–548.
63 Spolar RS & Record MT (1994) Coupling of local fold-
ing to site-specific binding of proteins to DNA. Science
263, 777–784.
64 Pace CN & Scholtz JM (1997) Measuring the confor-
mational stability of a protein. In Protein structure, 2nd
edn (Creighton TE, ed.), pp. 253–259. Oxford Univer-
sity Press, Oxford.
65 Willard L, Ranjan A, Zhang H, Monzavi H, Boyko
RF, Sykes BD & Wishart DS (2003) VADAR. A web
Dynamics of monomeric CAC L. A. Alcaraz et al.
3310 FEBS Journal 275 (2008) 3299–3311 ª 2008 The Authors Journal compilation ª 2008 FEBS
server for quantitative evaluation of protein structure
quality. Nucleic Acids Res 31, 3316–3319.
66 Cavanagh JF, Wayne J, Palmer AG & Skelton NJ
(1996) Protein NMR Spectroscopy: Principles and Prac-
tice, pp. 167–168. Academic Press, San Diego, CA.
67 Farrow NA, Muhandiram R, Singer AU, Pascal SM,
Kay CM, Gish G, Shoelson SE, Pawson T, Forman-
Kay JD & Kay LE (1994) Backbone dynamics of a free
and phosphopeptide-complexed src homology 2 domain
studied by
15
N NMR relaxation. Biochemistry 33, 5984–
6003.
68 Abragam A (1961) The Principles of Nuclear Magne-
tism. Clarendon Press, Oxford.
69 Farrow NA, Zhang O, Szabo A, Torchia DA & Kay
LE (1995) Spectral density function using
15
N relaxa-
tion exclusively. J Biomol NMR 6, 153–162.
70 Hiyama Y, Niu C, Silverton JV, Bavaso A & Torchia
DA (1988) Determination of the
15
N chemical shift ten-
sor via
15
N-
2
H dipolar coupling in Boc-glycylglycyl
[
15
N] glycine benzyl ester. J Am Chem Soc 110, 2378–
2383.
71 Dosset P, Hus JC, Blackledge M & Marion D (2000)
Efficient analysis of macromolecular rotational diffusion
from heteronuclear relaxation data. J Biomol NMR 16,
23–28.
72 Tsan P, Hus J-C, Caffrey M, Marion D & Blackledge
M (2000) Rotational diffusion anisotropy and local
backbone dynamics of carbon monoxide bound Rho-
dobacter capsulates cytochrome c. J Am Chem Soc 121,
2311–2312.
Supplementary material
The following supplementary material is available
online:
Table S1. Relaxation rates in CACW40A at different
protein concentrations.
Table S2. Model free parameters of CACW40A.
Table S3. Reduced spectral density values in
CACW40A.
This material is available as part of the online article
from
Please note: Blackwell Publishing are not responsible
for the content or functionality of any supplementary
materials supplied by the authors. Any queries (other
than missing material) should be directed to the corre-
sponding author for the article.
L. A. Alcaraz et al. Dynamics of monomeric CAC
FEBS Journal 275 (2008) 3299–3311 ª 2008 The Authors Journal compilation ª 2008 FEBS 3311