An Analysis of Database Workload Performance on Simultaneous Multithreaded Processors potx
Bạn đang xem bản rút gọn của tài liệu. Xem và tải ngay bản đầy đủ của tài liệu tại đây (5.76 MB, 12 trang )
To appear in Proceedings of the 25th Annual International Symposium on Computer Architecture, June 1998.
An Analysis of Database Workload Performance on
Simultaneous Multithreaded Processors
Henry M. Levy, and Sujay S. Parekh
Dept. of Computer Science and Engineering
Box 352350
University of Washington
Seattle, WA 98195
*Digital Equipment Corporation
Western Research Laboratory
250 University Ave.
Palo Alto, CA 94301
Abstract
Simultaneous multithreading (SMT) is an architec-
tural technique in which the processor issues multiple
instructions from multiple threads each cycle. While SMT
has been shown to be effective on scientific workloads, its
performance on database systems is still an open question.
In particular, database systems have poor cache perfor-
mance, and the addition of multithreading has the poten-
tial to exacerbate cache conflicts.
This paper examines database performance on SMT
processors using traces of the Oracle database manage-
ment system. Our research makes three contributions.
First, it characterizes the memory-system behavior of
database systems running on-line transaction processing
and decision support system workloads. Our data show
that while DBMS workloads have large memory foot-
prints, there is substantial data reuse in a small, cache-
able “critical” working set. Second, we show that the
additional data cache conflicts caused by simultaneous-
multithreaded instruction scheduling can be nearly elimi-
nated by the proper choice of software-directed policies
for virtual-to-physical page mapping and per-process
address offsetting. Our results demonstrate that with the
best policy choices, D-cache miss rates on an 8-context
SMT are roughly equivalent to those on a single-threaded
superscalar. Multithreading also leads to better inter-
thread instruction cache sharing, reducing I-cache miss
rates by up to 35%. Third, we show that SMT’s latency tol-
erance is highly effective for database applications. For
example, using a memory-intensive OLTP workload, an 8-
context SMT processor achieves a 3-fold increase in
instruction throughput over a single-threaded superscalar
with similar resources.
1 Introduction
With the growing importance of internet commerce,
data mining, and various types of information gathering
and processing, database systems will assume an even
more crucial role in computer systems of the future —
from the desktop to highly-scalable multiprocessors or
clusters. Despite their increasing prominence, however,
database management systems (DBMS) have been the
subject of only limited architectural study [3,6,12,16,22].
Not surprisingly, these studies have shown that database
systems can exhibit strikingly high cache miss rates. In
the past, these miss rates were less significant, because
I/O latency was the limiting factor for database perfor-
mance. However, with the latest generation of commer-
cial database engines employing numerous processes,
disk arrays, increased I/O concurrency, and huge memo-
ries, many of the I/O limitations have been addressed [7].
Memory system performance is now the crucial problem:
the high miss rates of database workloads, coupled with
long memory latencies, make the design of future CPUs
for database execution a significant challenge.
This paper examines the memory system behavior of
database management systems on simultaneous multi-
threaded processors. Simultaneous multithreading (SMT)
[4] is an architectural technique in which the processor
issues instructions from multiple threads in a single
cycle. For scientific workloads, SMT has been shown to
substantially increase processor utilization through fine-
grained sharing of all processor resources (the fetch and
issue logic, the caches, the TLBs, and the functional
units) among the executing threads [23]. However, SMT
performance on commercial databases is still an open
research question, and is of interest for three related rea-
sons. First, a database workload is intrinsically
multithreaded, providing a natural source of threads for
an SMT processor. Second, many database workloads are
memory-intensive and lead to extremely low processor
utilization. For example, our studies show that a transac-
tion processing workload achieves only 0.79 IPC on an 8-
wide, out-of-order superscalar with 128KB L1 caches —
less than 1/4 the throughput of the SPEC suite. As a
result, there is great potential for increased utilization
through simultaneous multithreaded instruction issue.
Third, but somewhat troubling, SMT’s fine-grained shar-
ing of the caches among multiple threads may seriously
diminish memory system performance, because database
workloads can stress the cache to begin with even on a
single-threaded superscalar. Therefore, while SMT seems
a promising candidate to address the low instruction
throughput on database systems, the memory system
behavior of databases presents a potentially serious chal-
lenge to the multithreaded design approach. That
challenge is the focus of this paper.
To investigate database memory system behavior on
SMT processors, we have instrumented and measured the
Oracle version 7.3.2 database system executing under
Digital UNIX on DEC Alpha processors. We use traces
of on-line transaction processing (OLTP) and decision
support system (DSS) workloads to drive a highly-
detailed trace-driven simulator for an 8-context, 8-wide
simultaneous multithreaded processor. Our analysis of
the workload goes beyond previous database memory sys-
tem measurements to show the different memory access
patterns of a DBMS’s internal memory regions (instruc-
tion segment, private data, database buffer cache, and
shared metadata) and the implications those patterns have
for SMT memory system design.
Our results show that while cache interference among
competing threads can be significant, the causes of this
interference can often be mitigated with simple software
policies. For example, we demonstrate a substantial
improvement in IPC for the OLTP workload through the
selection of an appropriate virtual-to-physical page map-
ping algorithm in the operating system. We also show
that some of the inter-thread memory-system competition
is constructive, i.e., the sharing of data among threads
leads to cache-line reuse, which aids SMT performance.
Overall, we demonstrate that simultaneous multithread-
ing can tolerate memory latencies, exploit inter-thread
instruction sharing, and limit inter-thread interference on
memory-intensive database workloads. On the highly
memory-intensive OLTP workload, for example, our sim-
ulated SMT processor achieves a 3-fold improvement in
instruction throughput over a base superscalar design
with similar resources.
The organization of the paper follows the approach
described above. Section 2 describes the methodology
used in our simulation-based study. Section 3 character-
izes the memory behavior of on-line transaction
processing and decision support system workloads, moti-
vating the use of SMT as a latency-tolerance technique.
Section 4 quantifies the effect of constructive and destruc-
tive cache interference in both the instruction and data
caches and evaluates alternatives for reducing inter-
thread conflict misses. Section 5 compares the perfor-
mance of the OLTP and DSS workloads on SMT and a
wide-issue superscalar, explaining the architecture basis
for SMT’s higher instruction throughput. Finally, we dis-
cuss related work and conclude.
2 Methodology
This section describes the methodology used for our
experiments. We begin by presenting details of the
hardware model implemented by our trace-driven
processor simulator. We then describe the workload used
to generate traces and our model for the general
execution environment of database workloads.
2.1 SMT processor model
Simultaneous multithreading exploits both instruction-
level and thread-level parallelism by executing
instructions from multiple threads each cycle. This
combination of wide-issue superscalar technology and
fine-grain hardware multithreading improves utilization
of processor resources, and therefore increases
instruction throughput and program speedups. Previous
research has shown that an SMT processor can be
implemented with rather straightforward modifications to
a standard dynamically-scheduled superscalar [23].
Our simulated SMT processor is an extension of a
modern out-of-order, superscalar architecture, such as the
MIPS R10000. During each cycle, the SMT processor
fetches eight instructions from up to two of the eight hard-
ware contexts. After instructions are decoded, register
renaming removes false register dependencies both
within a thread (as in a conventional superscalar) and
between threads, by mapping context-specific architec-
tural registers onto a pool of physical registers.
Instructions are then dispatched to the integer or floating-
point instruction queues. The processor issues instruc-
tions whose register operands have been computed; ready
instructions from any thread may issue any cycle.
Finally, the processor retires completed instructions in
program order.
To support simultaneous multithreading, the processor
replicates several resources: state for hardware contexts
(registers and program counters) and per-context mecha-
nisms for pipeline flushing, instruction retirement,
trapping, precise interrupts, and subroutine return predic-
tion. In addition, the branch target buffer and translation
lookaside buffer contain per-context identifiers.
Table 1 provides more details describing our proces-
sor model, and Table 2 lists the memory system
parameters. Branch prediction uses a McFarling-style,
hybrid branch predictor [13] with an 8K-entry global pre-
Functional units 6 integer (including 4 ld/st units), 4 FP
Instruction queue 32 integer entries, 32 FP entries
Active list 128 entries/context
Architectural registers 32*8 integer / 32*8 FP
Renaming registers 100 integer / 100 FP
Instruction retirement up to 12 instructions per cycle
Table 1: CPU parameters used in our simulator . The
instruction window size is limited by both the active list and
the number of renaming registers.
diction table, a 2K-entry local history table which
indexes into a 4K-entry local prediction table, and an 8K-
entry selection table to choose between the local and glo-
bal predictors.
2.2 Simulating database workloads
Compared to typical benchmarks, such as SPEC and
SPLASH, commercial workloads have substantially more
complex execution behavior. Accurate simulation of
these applications must capture this complexity, espe-
cially I/O latencies and the interaction of the database
with the operating system. We therefore examined the
behavior of the Oracle DBMS and the underlying Digital
UNIX operating system to validate and strengthen our
simulation methodology. Though DBMS source code
was not available, we used both the Digital Continuous
Profiling Infrastructure (DCPI) [1] and separate experi-
ments running natively on Digital AlphaServers to
understand DBMS behavior and extract appropriate
parameters for our simulations. The remainder of this sec-
tion describes the experimental methodology, including
the workloads, trace generation, operating system activity
(including modelling of I/O), and synchronization.
The database workload
On-line transaction processing (OLTP) and decision
support systems (DSS) dominate the workloads handled
by database servers; our studies use two workloads, one
representative of each of these domains. Our OLTP work-
load is based on the TPC-B benchmark [20]. Although
TPC-C has supplanted TPC-B as TPC’s current OLTP
benchmark, we found that the two workloads have simi-
lar processor and memory system characteristics [2]. We
chose TPC-B because it is easier to set up and run.
The OLTP workload models transaction processing
for a bank, where each transaction corresponds to a bank
account deposit. Each transaction is small, but updates
several database tables (e.g., teller and branch). OLTP
workloads are intrinsically parallel, and therefore data-
base systems typically employ multiple server processes
L1 I-cache L1 D-cache L2 cache
Size 128KB 128KB 16MB
Line size 64B 64B 64B
Miss latency to next
level (cycles)
10 10 68
Associativity 2-way 2-way direct-mapped
Fill latency (cycles) 2 2 4
Banks 4 4 1
Ports/bank 1 2 1
Max. in-flight misses 16 16 16
Table 2: Memory system parameters used in our simulator.
The instruction and data TLBs are both 128-entry and fully-
associative, with 20 cycle miss penalties.
to process client transactions and hide I/O latencies.
In decision support systems, queries execute against a
large database to answer critical business questions. The
database consists of several inter-related tables, such as
parts, nations, customers, orders, and lineitems. Our DSS
workload is based on query 6 of the TPC-D benchmark
[21], which models the database activity for a business
that manages, sells, or distributes products worldwide.
The query scans the largest table ( lineitem) to quantify
the amount of revenue increase that would have resulted
from eliminating certain discounts in a given percentage
range in a given year. This query is representative of DSS
workloads; other TPC-D queries tend to have similar
memory system behavior [2].
Trace generation
Commercial database applications require consider-
able tuning to achieve optimal performance. Because the
execution time of different workload components (user,
kernel, I/O, etc.) may vary depending on this level of opti-
mization and customization, we extensively tuned Oracle
v.7.3.2 and Digital UNIX to maximize database perfor-
mance when running natively on a 4-processor Digital
AlphaServer 4100. Using the best-performing configura-
tion, we instrumented the database application with
ATOM [17] and generated a separate instruction trace
file for each server process. We then fed these traces to
our cycle-level SMT simulator, whose parameters were
described above. In each experiment, our workload con-
sists of 16 processes (threads), unless otherwise noted.
For the OLTP workload, each process contains 315 trans-
actions (a total of 5040) on a 900MB database. For a
single OLTP experiment, we simulate roughly 900M
instructions. For our DSS workload, scaling is more com-
plex, because the run time (and therefore, simulation
time) grows linearly with the size of the database. Fortu-
nately, the DSS query exhibits very consistent behavior
throughout its execution, so we could generate representa-
tive traces using sampling techniques [2]. With the
sampled traces, each of our DSS experiments simulate
roughly 500M instructions from queries on a 500MB
database.
Operating system activity
Although ATOM generates only user-level traces, we
took several measures to ensure that we carefully mod-
elled operating system effects. While some previous
studies have found that operating system kernel activity
can dominate execution time for OLTP workloads [6, 12,
16], we found that a well-tuned workload spends most of
its time in user-level code. Using DCPI, we determined
that for OLTP, roughly 70% of execution time was spent
in user-level code, with the rest in the kernel and the idle
loop. For DSS, kernel and idle time were negligible.
These measurements therefore verified that our traces
account for the dominant database activity.
In addition, we monitored the behavior of Digital
UNIX to ensure that our simulation framework models
the behavior of the operating system scheduler and
underlying I/O subsystem to account for I/O latencies.
We use a simple thread scheduler when there are more
processes (threads) than hardware contexts. Although the
scheduler can preempt threads at the end of a 500K-cycle
scheduling quantum, most of the scheduling decisions are
guided by hints from the server processes via four UNIX
system calls: fread, fwrite, pid_block, and pid_unblock.
We therefore annotate the traces to indicate where the
server processes call these routines.
The OLTP workload uses fread and fwrite calls for
pipe communication between the client (the application)
and the server process. Writes are non-blocking, while
reads have an average latency of 14,500 cycles on the
AlphaServer. Our simulator models this fread latency
and treats both fread and fwrite as hints to the scheduler
to yield the processor. The other important system call,
pid_block, is primarily used during the commit phase of
each transaction. During transaction commit, the
logwriter process must write to the log file. The
pid_block call is another scheduler hint that yields the
CPU to allow the logwriter to run more promptly.
For our DSS workload, system calls are infrequent,
but the server processes periodically invoke freads to
bring in new 128KB database blocks for processing.
Our simulation experiments also include the impact of
the I/O subsystem. For the OLTP workload, we use a 1M
cycle latency (e.g., 1ms for a 1 GHz processor) for the
logwriter’s small (about 8KB) file writes. This latency
models a fast I/O subsystem with non-volatile RAM to
improve the performance of short writes. For DSS, we
model database reads (about 128KB) with 5M cycle
latencies. Most of our experiments use 16 processes, but
in systems with longer I/O latencies, more processes will
be required to hide I/O.
Synchronization
Oracle’s primary synchronization primitive uses the
Alpha’s load-locked/store-conditional instructions, and
higher-level locks are built upon this mechanism.
However, on an SMT processor, this conventional
spinning synchronization can have adverse effects on
threads running in other contexts, because the spinning
instructions consume processor resources that could be
used more effectively by the other threads. We therefore
use hardware blocking locks, which are a more efficient
synchronization mechanism for SMT processors. To
incorporate blocking synchronization in the simulations,
we replaced the DBMS’s synchronization scheme with
blocking locks in the traces.
3 Database workload characterization
This section characterizes the memory-system
behavior of our commercial OLTP and DSS workloads,
providing a basis for the detailed SMT architectural
simulations presented in Section 4. While previous work
has shown that high miss rates can be generated by
commercial workloads, we go beyond that observation to
uncover the memory-access patterns that lead to the high
miss rates.
A database’s poor memory system performance
causes a substantial instruction throughput bottleneck.
For example, our processor simulations (described in the
next section) show that the OLTP workload achieves
only 0.79 instructions per cycle on an 8-wide, single-
threaded, superscalar with 128KB L1 caches (compared
to 3.3 IPC for a subset of SPEC benchmarks on the same
processor). The OLTP workload achieves only 0.26 IPC
with 32KB L1 caches! Because of its latency-hiding
capability, simultaneous multithreading has the potential
to substantially improve the single-threaded superscalar’s
low IPC. On the other hand, SMT could exacerbate
conflicts in the already-overloaded caches beyond its
ability to hide the latencies. An evaluation of this issue
requires an analysis of the thread working sets, their
access patterns, and the amount of inter-thread sharing.
We provide that analysis in this section.
Our studies of memory-system behavior focus on the
performance of the database server processes that
dominate execution time for commercial workloads. In
Oracle’s dedicated mode, a separate server process is
associated with each client process. Each server process
accesses memory in one of 3 segments:
• The instruction text segment contains the database
code and is shared among all database processes.
• The Program Global Area (PGA) contains per-
process data, such as private stacks, local variables,
and private session variables.
• The Shared Global Area (SGA) contains the
database buffer cache, the data dictionary (indices
and other metadata), the shared SQL area (which
allows multiple users to share a single copy of an
SQL statement), redo logs (for tracking data updates
and guiding crash recovery), and other shared
resources. The SGA is the largest region and is
shared by all server processes. For the purposes of
this study, we consider the database buffer cache to
be a fourth region (which we’ll call the SGA buffer
cache), separate from the rest of the SGA (called
SGA-other), because its memory access pattern is
quite distinct.
To better understand memory behavior, we compare and
analyze the memory access patterns of these regions on
both OLTP and DSS workloads.
3.1 OLTP characterization
As described in the previous section, we traced our
OLTP workload, which models transaction processing
for a bank. We then used these traces to analyze cache
Program
Segments
OLTP DSS
L1 cache miss rate
Memory
footprint
Avg. # of
refs per
64-byte
block
Avg. # accesses to a
block until a cache
conflict L1 cache miss rate
Memory
footprint
(sample)
Avg. # of
refs per
64-byte
block
Avg. # accesses to a
block until a cache
conflict
32KB 128KB 32KB 128KB 32KB 128KB 32KB 128KB
Instruction 23.3% 13.7% 556KB 52K 3 4 0.5% 0.0% 43.3KB 216K 11 43
PGA 8.4% 7.4% 1.3MB 14K 8 11 0.8% 0.7% 2.2MB 3.8K 38 102
SGA buffer
cache
7.5% 6.8% 9.3MB 66 9 12 9.3% 8.0% 2.7MB 383 7 10
SGA-other 17.5% 12.9% 26.5MB 169 3 5 0.4% 0.2% 878KB 3.4K 43 117
All data seg-
ments
10.1% 8.4% 37.1MB 630 7 9 1.5% 1.2% 5.8MB 2.8K 29 59
Table 3: Memory behavior characterization for OLTP (16 processes, 315 transactions each) and DSS (16 processes) on a
single-threaded uniprocessor. The characterization for only 8 processes (a typical number for hiding I/O on existing
processors) is qualitatively the same (results not shown). Footprints are smaller, but the miss rates are comparable. On the
uniprocessor, 16 processes only degraded L1 cache miss rates by 1.3 percentage points for the OL TP workload, when
compared to 8 processes. Results are shown for both 32KB and 128KB caches. All caches are 2-way associative.
behavior for a traditional, single-threaded uniprocessor.
The left-hand side of Table 3 shows our results for the
OLTP workload (we discuss the DSS results later).
Overall, this data confirms the aggregate cache behavior
of transaction processing workloads found by others;
namely, that they suffer from higher miss rates than
scientific codes (at least as exhibited by SPEC and
SPLASH benchmarks), with instruction misses a
particular problem [3,6,12,16]. For example, columns 2
and 3 of Table 3 show that on-chip caches are relatively
ineffective both at current cache sizes (32KB) and at
larger sizes (128KB) expected in next-generation
processors. In addition, instruction cache behavior is
worse than data cache behavior, having miss rates of
23.3% and 13.7% for 32K and 128K caches,
respectively. (Note, however, that the instruction cache
miss rate is computed by dividing the number of misses
by the number of I-cache fetches, not by the number of
instructions. In our experiments, a single I-cache access
can fetch up to 8 instructions.)
In more detail, Table 3 shows a breakdown of cache-
access information by memory region. Here we see that
the high miss rates are partly attributable to OLTP’s large
memory footprints, which range from 556KB in the
instruction segment up to 26.5MB in SGA-other. The
footprints for all four regions easily exceed on-chip cache
sizes; for the two SGA areas, even large off-chip caches
are insufficient.
Surprisingly, the high miss rates are not a conse-
quence of a lack of instruction and data reuse. Column 5
shows that, on average, blocks are referenced very fre-
quently, particularly in the PGA and instruction regions.
Cache reuse correlates strongly with the increase in the
memory footprint size as transactions are processed. For
example, our data (not shown) indicates that as more of
the database is accessed, the memory footprint of the
SGA buffer cache continues to grow and exceeds that of
the SGA-other, whose size levels off over time; reuse in
the buffer cache is therefore relatively low. In contrast,
the PGA and instruction segment footprints remain fairly
stable over time, and reuse is considerably larger in those
regions.
High reuse only reduces miss rates, however, if multi-
ple accesses to cache blocks occur over a short enough
period of time that the blocks are still cache-resident.
Results in columns 6 and 7 show that the frequency of
block replacement strongly and inversely correlates with
miss rates, for all segments. Replacement is particularly
frequent in the instruction segment, where cache blocks
are accessed on average only 3 or 4 times before they are
potentially replaced
1
, either by a block from this thread
or another thread. So, despite a relatively small memory
footprint and high reuse, the instruction segment’s miss
rate is high.
In summary, all three of these factors, large memory
footprints, frequency of memory reuse, and the interval
length between cache conflicts, make on-chip caching for
OLTP relatively ineffective.
The “critical” working set
Within a segment, cache reuse is not uniformly distrib-
uted across blocks, and for some segments is highly
skewed, a fact hidden by the averaged data in Table 3. To
visualize this, Figure 1 characterizes reuse in the four
memory regions. To obtain data points for these graphs,
we divided the memory space into 64-byte (cache-line
sized) blocks and calculated how many times each was
1.
Columns 6 and 7 measure inherent cache mapping conflicts using a
direct-mapped, instead of two-way associative, cache. Even though this
may overestimate the number of replacements (compared to two-way),
the relative behavior for the different data segments is still accurate.
Figure 1. OLTP locality profiles. In each graph, the upper curve plots the cumulative percentage of 64-byte blocks accessed
n times or less; the lower graph plots the cumulative percentage of references made to blocks accessed n times or less.
Figure 2. DSS locality profiles.
accessed. The black line (the higher of the two lines)
plots a cumulative histogram of the percentage of blocks
that are accessed n times or less; for example, the top cir-
cle in Figure 1b says that for the PGA, 80% of the blocks
are accessed 20,000 times or less. The gray line (bottom)
is a cumulative histogram that plots the percentage of
total references that occurred to blocks accessed n times
or less; the lower circle in Figure 1b shows that those
blocks accessed 20,000 times or less account for only
25% of total references. Alternatively, these two points
indicate that 20% of the blocks are accessed more than
20,000 times and account for 75% of all the references.
In other words, for the PGA, a minority of the memory
blocks are responsible for most of the memory refer-
ences. (The curves in Figure 1 are all cumulative
distributions and thus reach 100%; we have omitted part
of the right side of the graphs for most cases because the
curves have long tails.)
All four regions exhibit skewed reference distribu-
tions, but to different extents. Comparing them at the
highest reuse data point plotted in Figure 1, i.e., more
than 40K accesses per block, 31% of the blocks in the
instruction segment account for 87% of the instruction
references (Figure 1a), 8.5% of the blocks in the PGA
account for 53% of the references (Figure 1b), and a
remarkable 0.1% of the blocks in SGA-other account for
41% of the references (Figure 1d). The SGA buffer
cache’s reference distribution is also skewed (9% of the
blocks comprise 77% of the references); however, this
point occurs at only 100 accesses. Consequently, most
blocks in the SGA buffer cache (91%) have very little
reuse and the more frequently used blocks comprise a
small percentage of total references.
Reference behavior that is skewed to this extent
strongly implies that the “critical” working set of each
segment, i.e., the portion of the segment that absorbs the
majority of the memory references, is much smaller than
the segment’s memory footprint. As an example, the
SGA-other blocks mentioned above are three orders of
magnitude smaller (26KB) than this segment’s memory
footprint (26.5MB). The implication for simultaneous
multithreading is that, for the segments that exhibit
skewed reference behavior and make most of their refer-
ences to a small number of blocks (instruction, PGA, and
SGA-other segments), there will be some performance-
critical portion of their working sets that fit comfortably
into SMT’s context-shared caches.
3.2 DSS workload characterization
As with OLTP, we used traces of the DSS workload to
drive a simulator for a single-threaded uniprocessor. Our
results, shown on the right half of Table 3, indicate that
the DSS workload should cause fewer conflicts in the
context-shared SMT caches than OLTP, because its miss
ratios are lower, reuse is more clustered, and the seg-
ments’ critical working sets are smaller. The instruction
and (overall) data cache miss rates, as well as those of 2
of the 3 data segments (columns 8 and 9 of Table 3), are
negligible, and cache reuse per block (columns 12 and
13) is sometimes even an order of magnitude higher.
Because of more extreme reference skewing and/or
smaller memory footprints, the cache-critical working
sets for all segments except the SGA buffer cache are eas-
ily cacheable on an SMT. In the instruction region, 98%
of the references are made to only 6KB of instruction text
(Figure 2); and 253 blocks (16KB) account for 75% of
PGA references. SGA-other is even more skewed, with
more than 97% of the references touching only 51 blocks
or 3KB.
The SGA buffer cache has a much higher miss rate
than the other segments (8%), because the query scans
through the large lineitem table and little reuse occurs.
The buffer cache is so uniformly accessed that its critical
working set and memory footprint are almost synony-
mous; 99% of the blocks are touched fewer than 800
times, as shown by the locality histogram in Figure 2c.
The scalability of DSS’s locality profile is an impor-
tant issue as databases for decision support systems
continue to grow in size. The reuse profiles demonstrate
that the locality and good cache behavior in this work-
load scales to much larger databases. With larger
databases (and therefore, longer-running queries), the
instruction and PGA references dominate, but their work-
ing sets should remain small and easily cacheable.
Although the footprints of both SGA segments grow with
larger databases, DSS has good spatial locality indepen-
dent of the size of the cache, and therefore references to
these regions have minimal effects on locality.
3.3 Summary of the workload characterization
This section analyzed the memory-system behavior of
the OLTP and DSS workloads in detail. Overall, we find
that while the footprints (particularly for OLTP) are large
for the various memory regions, there is good temporal
locality in the most frequently accessed blocks, i.e., a
small percentage of blocks account for most of the refer-
ences. Thus, it is possible that even with multithreading,
the “critical” working sets will fit in the caches, reducing
the degradation on cache performance due to inter-thread
conflicts.
Recall, however, that simultaneous multithreading
interleaves per-thread cache accesses more finely than a
single-threaded uniprocessor. Thus, inter-thread competi-
tion for cache lines will rise on an SMT, causing
consecutive, per-thread block reuse to decline. If cross-
thread accesses are made to distinct addresses, increasing
inter-thread conflicts, SMT will have to exploit temporal
locality more effectively than the uniprocessor. But if the
accesses occur to thread-shared blocks, inter-thread con-
flicts and misses will decline. The latter should be
particularly beneficial for the instruction segment, where
the various threads tend to execute similar code.
In the next section, we explore these implications,
using a detailed simulation of an SMT processor execut-
ing the OLTP and DSS workloads.
4 Multi-thread cache interference
This section quantifies and analyzes the cache effects
of OLTP and DSS workloads on simultaneous multi-
threaded processors. On conventional (single-threaded)
processors, a DBMS employs multiple server processes
to hide I/O latencies in the workload. Context switching
between these processes may cause cache interference
(i.e., conflicts), as blocks from a newly-scheduled pro-
cess evict useful cache blocks from descheduled
processes; however, once a thread begins to execute, it
has exclusive control of the cache for the duration of its
execution quantum. With simultaneous multithreading,
thread execution is interleaved at a much finer granular-
ity (within a cycle, rather than at the coarser context-
switch level). This fine-grained, simultaneous sharing of
the cache potentially changes the nature of inter-thread
cache interference. Understanding this interference is
therefore key to understanding the performance of data-
base workloads on SMT.
In the following subsections we identify two types of
cache interference: destructive interference occurs when
one thread’s data replaces another thread’s data in the
cache, resulting in an increase in inter-thread conflict
misses; constructive interference occurs when data
loaded by one thread is accessed by another simulta-
neously-scheduled thread, resulting in fewer misses. We
examine the effects of both destructive and constructive
cache interference when running OLTP and DSS work-
loads on an SMT processor, and evaluate operating
system and application techniques for minimizing inter-
thread cache misses caused by destructive interference.
4.1 Misses in a database workload
We begin our investigation by analyzing per-segment
misses for both OLTP and DSS workloads on an SMT
processor. The results shown here were simulated on our
8-context SMT processor simulator described in Section
2. For some experiments we simulate fewer than 8 con-
texts as well, to show the impact of varying the number
of simultaneously-executing threads.
In the previous section we saw the individual miss
rates for the four database memory regions, executing on
a single-threaded uniprocessor. Table 4 shows the
proportion of total misses due to each region, when
executing on our 8-context SMT processor. From Table
4, we see that, the PGA region is responsible for the
majority of L1 and L2 misses. For example, the PGA
accounts for 60% of the L1 misses and 98% of the L2
misses for OLTP (and 7% and 58% of total references to
L1 and L2, respectively), making it the most important
region for analysis.
2
The PGA contains the per-process data (e.g., private
stacks and local variables) that are used by each server
process. PGA data is laid out in an identical fashion, i.e.,
at the same virtual addresses, in each process’ address
space. Furthermore, there are several hot spots in the
PGA that are accessed throughout the life of each pro-
2.
Note that the distribution of misses is skewed by the lar ge number of
conflict misses. When mapping conflicts are eliminated using the tech-
niques described in the next section, the miss distribution changes sub-
stantially.
cess. Consequently, SMT’s fine-grained multithreading
causes substantial destructive interference between the
same virtual addresses in different processes. These con-
flicts also occur on single-threaded CPUs, but to a lesser
extent, because context switching is much coarser
grained than simultaneous-multithreaded instruction
issue (PGA accounts for 71% of the misses on the single-
threaded CPU, compared to 84% on the 8-context SMT).
The SMT cache organization we simulate is a virtu-
ally-indexed/physically-tagged L1 cache with a
physically-indexed/physically-tagged L2 cache. This
structure is common for modern processors; it provides
fast lookup for the L1 cache and ease of management for
the L2 cache. Given this organization, techniques that
alter the per-process virtual-address-space layout or the
virtual-to-physical mapping could affect the miss rates
for the L1 and L2 caches, respectively, particularly in the
PGA. We therefore evaluate combinations of two soft-
ware mechanisms that might reduce the high miss rates:
virtual-to-physical page-mapping schemes and applica-
tion-based, per-process virtual-address-space offsetting.
4.2 Page-mapping policies
Because the operating system chooses the mapping of
virtual to physical pages when allocating physical mem-
ory, it plays a role in determining L2 cache conflicts.
Operating systems generally divide physical memory
page frames into colors (or bins); two physical pages
have the same color if they index into the same location
in the cache. By mapping two virtual pages to different
colors, the page-mapping policy can eliminate cache con-
flicts between data on the two pages and improve cache
performance [9].
The two most commonly-used page-mapping policies
are page coloring and bin hopping. Page coloring exploits
spatial locality by mapping consecutive virtual pages to
consecutive physical page colors. IRIX, Solaris/SunOS
and Windows NT augment this basic page coloring algo-
rithm by either hashing the process ID with the virtual
address or using a random seed for a process’s initial
page color. In contrast, Digital UNIX uses bin hopping,
also known as first-touch. Bin hopping exploits temporal
locality by cycling through page colors sequentially as it
maps new virtual pages. Because page mappings are
established based on reference order (rather than address-
Cache
instruction
text PGA
SGA
buffer
cache SGA-other
OLTP L1 28.6 60.0 0.9 10.5
L2 0.2 98.1 0.3 1.4
DSS L1 0.0 96.0 3.6 0.3
L2 0.0 99.9 0.1 0.0
Table 4: Proportion of total misses (percent) due to each
segment on an 8-context SMT. For the level 1 cache, we
combined data and instruction misses.
space order), pages that are mapped together in time will
not conflict in the cache.
Our experiments indicate that, because multithreading
magnifies the number of conflict misses, the page-map-
ping policy can have a large impact on cache
performance on an SMT processor. Table 5 shows the L2
cache miss rates for OLTP and DSS workloads for vari-
ous mapping schemes. The local miss rate is the number
of L2 misses as a percentage of L2 references; the global
miss rate is the ratio of L2 misses to total memory refer-
ences. Bin hopping avoids mapping conflicts in the L2
cache most effectively, because it is likely to assign iden-
tical structures in different threads to non-conflicting
physical pages. Consequently, miss rates are minuscule,
and are stable across all numbers of hardware contexts,
indicating that the OLTP and DSS “critical” working sets
fit in a 16MB L2 cache. In contrast, page coloring fol-
lows the data memory layout; since this order is common
to all threads (in the PGA), page coloring incurs more
conflict misses, and increasingly so with more hardware
contexts. In fact, at 4 contexts on DSS, almost all L2
cache references are misses. Hashing the process ID with
the virtual address improves page coloring performance,
but it still lags behind bin hopping.
Note that some of these conflict misses could also be
addressed with higher degrees of associativity or with vic-
tim caching, but these solutions may either slow cache
access times (associativity) or may have insufficient
capacity to hold the large number of conflict misses in
OLTP and DSS workloads (victim caches).
4.3 Application-level offsetting
Although effective page mapping reduces L2 cache
conflicts, it does not impact on-chip L1 data caches that
are virtually-indexed. In the PGA, in particular, identical
virtual pages in the different processes will still conflict
in the L1, independent of the physical page-mapping pol-
icy. One approach to improving the L1 miss rate is to
“offset” the conflicting structures in the virtual address
spaces of the different processes. For example, the start-
ing virtual address of each newly-created process or
segment could be shifted by (page size * process ID)
bytes. This could be done manually in the application or
by the loader.
Table 6 shows the L1 miss rates for the three page-
mapping policies, both with and without address-space
offsetting. The data indicate that using an offset reduced
the L1 miss rate of all numbers of hardware contexts
roughly to that of a wide-issue superscalar. Without off-
setting, L1 miss rates doubled for OLTP and increased up
to 12-fold for DSS, as the number of hardware contexts
was increased to 8. Offsetting also reduced L2 miss rates
for page coloring (data not shown). By shifting the vir-
tual addresses, pages that would have been in the same
bin under page coloring end up in different bins.
Page-mapping
technique
Type of
L2 miss
rate
OLTP DSS
Number of contexts Number of contexts
1 2 4 8 1 2 4 8
Bin hopping global
local
0.3
2.7
0.3
2.7
0.3
2.6
0.3
2.4
0.0
5.3
0.0
4.4
0.0
0.4
0.0
0.3
Page coloring global
local
3.4
34.4
3.5
38.0
5.1
50.3
6.7
58.9
0.3
39.9
0.3
41.6
6.6
94.8
9.1
96.1
Page coloring with pro-
cess id hash
global
local
1.8
17.3
1.6
16.1
1.4
12.0
1.2
8.7
0.2
32.5
0.2
28.1
0.2
2.7
0.2
2.1
Table 5: Global and local L2 cache miss rates (in percentages) for 16 threads running on an SMT with 1-8 contexts. Note
that the local miss rates can be skewed by the large number of L1 conflict misses (as shown in the next table). For example,
the 0.3% local miss rate (bin hopping, 8 contexts) is much lower than that found for typical DSS workloads.
Page-mapping
technique
Application
offsetting
OLTP DSS
Number of contexts Number of contexts
1 2 4 8 1 2 4 8
Bin hopping no offset
offset
8.2
8.4
8.9
8.5
12.3
8.6
16.0
8.7
1.2
1.2
1.4
1.3
15.0
1.6
18.8
2.0
Page coloring no offset
offset
7.9
8.3
8.6
8.5
12.5
8.7
17.0
8.8
1.2
1.2
1.3
1.3
17.7
1.6
25.7
2.2
Page coloring with
process id hash
no offset
offset
8.1
8.4
8.9
8.7
12.9
8.9
18.5
9.1
1.2
1.2
1.4
1.3
15.0
1.5
19.3
2.2
Table 6: Local L1 cache miss rates (in percentages) for 16 threads running on an SMT , with and without offsetting of per-
process PGA data. For these experiments, an offset of 8KB * thread ID as used.
4.4 Constructive interference
Simultaneous multithreading can exploit instruction
sharing to improve instruction cache behavior, whether
the instruction working set is large (OLTP) or small
(DSS). In these workloads, each instruction block is
touched by virtually all server threads, on average. The
heavy instruction sharing generates constructive cache
interference, as threads frequently prefetch instruction
blocks for each other.
Each server thread for OLTP executes nearly identical
code, because transactions are similar. A single-threaded
superscalar cannot take advantage of this code sharing,
because its threads are resident only on a coarse schedul-
ing granularity. For example, a particular routine may be
executed only near the beginning of a transaction. By the
time the routine is re-executed by the same server pro-
cess, the code has been kicked out of the cache. This
occurs frequently, as the instruction cache is the largest
performance bottleneck on these machines. On an 8-con-
text SMT, however, the finer-grain multithreading
increases the likelihood that a second process will re-exe-
cute a routine before it is replaced in the cache. This
constructive cache interference reduces the instruction
cache miss rate from 14% to 9%, increasing processor
throughput to the point where I/O latencies become the
largest bottleneck, as discussed below.
Constructive interference does not require “lock-step”
execution of the server threads. To the contrary, schedul-
ing decisions and lock contention skew thread execution;
for example, over the lifetime our 16 thread simulations,
the “fastest” thread advances up to 15 transactions ahead
of the “slowest” thread.
With DSS, the instruction cache hit rate is already
almost 100% for one context, so constructive interference
has no impact.
4.5 Summary of multi-thread cache interference
This section examined the effects of cache interfer-
ence caused by fine-grained multithreaded instruction
scheduling on an SMT processor. Our results, which are
somewhat surprising, demonstrate that with appropriate
page mapping and offsetting algorithms, an 8-context
SMT processor can maintain L1 and L2 cache miss rates
roughly commensurate with the rates for a single-
threaded superscalar. Even for a less aggressive memory
configuration than the one we normally simulate (e.g.,
64KB instruction cache, 32KB data caches and 4MB L2
caches), destructive interference remains low. Only when
the L2 cache size is as low as 2MB — conservative even
for today’s database servers — does inter-thread interfer-
ence have an impact. We have also shown that
constructive interference in the I-cache benefits perfor-
mance on the SMT relative to a traditional superscalar.
Overall, with proper software-mapping policies, the
cache behavior for database workloads on SMT proces-
sors is roughly comparable to conventional processors. In
both cases, however, the absolute miss rates are high and
will still cause substantial stall time for executing pro-
cesses. Therefore, the remaining question is whether
SMT’s latency-tolerant architecture can absorb that stall
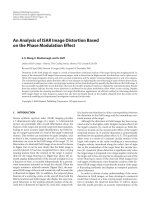
Figure 3. Comparison of throughput for various page-mapping schemes on a superscalar and 8-context SMT. The
bars compare bin hopping (BH), page coloring (PC), and page coloring with an initial random seed (PCs), with (8k) and
without virtual address offsets.
BH8k
BH
PC8k
PC
PCs8k
PCs
0
1
2
3
4
Instructions/cycle
OLTP
superscalar
SMT
BH8k
BH
PC8k
PC
PCs8k
PCs
0
1
2
3
4
Instructions/cycle
DSS
time, providing an increase in overall performance. This
is the subject of the following section.
5 SMT performance on database workloads
This section presents the performance of OLTP and
DSS workloads on an SMT processor, compared to a sin-
gle-threaded superscalar. We compare the various
software algorithms for page coloring and offsetting with
respect to their impact on instruction throughput, mea-
sured in instructions per cycle. The results tell us that
SMT is very effective for executing database workloads.
Figure 3 compares instruction throughput of SMT and
a single-threaded superscalar for the alternative page-
mapping schemes, both with and without address offsets.
From this data we draw several conclusions. First,
although the combination of bin hopping and application
offsetting provides the best instruction throughput (2.3
IPC for OLTP, 3.9 for DSS) on an 8-wide SMT, several
other alternatives are close behind. The marginal perfor-
mance differences give designers flexibility in
configuring SMT systems: if the DBMS provides offset-
ting in the PGA, the operating system has more leeway in
its choice of page-mapping algorithms; alternatively, if
an application does not support offsetting, bin hopping
can be used alone to obtain almost comparable
performance.
Second, with either bin hopping or any of the page-
mapping schemes with offsetting, the OLTP and DSS
“critical” working sets fit in the SMT cache hierarchy,
thereby reducing destructive interference. Using these
techniques, SMT achieves miss rates nearly as low as
those of a single-threaded superscalar for all numbers of
hardware contexts.
Third, it is clear from Figure 3 that SMT is highly
effective in tolerating the high miss rates of this work-
load, providing a substantial throughput improvement
over the superscalar. For DSS, for example, the best
SMT policy (BH8k) achieves a 57% performance
improvement over the best superscalar scheme (BH).
Even more impressive, for the memory-bound OLTP, the
SMT processor shows a 200% improvement in utilization
over the superscalar (BH8k for both cases).
Table 7 provides additional architectural insight into
the large increases in IPC, focusing on SMT’s ability to
hide instruction and data cache misses, as well as branch
mispredictions. The comparison of the average number
of outstanding D-cache misses illustrates SMT’s effec-
tiveness at hiding data cache miss latencies. For OLTP,
SMT shows a 3-fold increase (over the superscalar) in the
amount of memory system parallelism, while DSS shows
a 1.5-fold improvement. Since memory latency is more
important than memory bandwidth in these workloads,
increased memory parallelism translates to greater proces-
sor throughput.
Simultaneous multithreading also addresses fetching
bottlenecks resulting from branch mispredictions and
instruction cache misses. The superscalar fetches 50%
and 100% more wrong-path (i.e., wasted) instructions
than SMT for OLTP and DSS, respectively. By interleav-
ing instructions from multiple threads, and by choosing
to fetch from threads that are making the most effective
utilization of the execution resources [23], SMT reduces
the need for (and more importantly, the cost of) specula-
tive execution [10]. SMT also greatly reduces the number
of cycles in which no instructions can be fetched due to
misfetches or I-cache misses. On the DSS workload SMT
nearly eliminates all zero-fetch cycles. On OLTP, fetch
stalls are reduced by 78%; zero-fetch cycles are still
15.5%, because OLTP instruction cache miss rates are
higher.
Finally, the last two metrics illustrate instruction issue
effectiveness. The first is the number of cycles in which
no instructions could be issued: SMT reduces the number
of zero-issue cycles by 68% and 93% for OLTP and
Metric
OLTP DSS
SS SMT SS SMT
Avg. # of outstanding D-
cache misses
0.66 2.08 0.48 0.75
Wrong-path instructions
fetched (%)
60.0 40.0 20.7 9.9
Zero-fetch cycles (%) 55.4 15.5 29.6 1.8
Zero-issue cycles (%) 57.5 18.5 34.9 2.3
6-issue cycles (%) 8.6 32.8 22.4 58.6
Table 7: Architectural metrics for superscalar (SS) and 8-
context SMT on OLTP and DSS workloads.
DSS, respectively. The second is the percentage of cycles
in which the two architectures successfully issued 6
instructions (the maximum possible for this all-integer
workload). Not surprisingly, SMT has a huge advantage
over the superscalar in finding 6 instructions to issue,
showing a 3.8-fold increase for OLTP and a 2.6-fold gain
for DSS.
Overall, these results demonstrate that simultaneous
multithreading can tolerate memory latencies, exploit
inter-thread instruction sharing, and limit inter-thread
interference on memory-intensive database workloads.
The 3-fold throughput improvement for the memory-
bound OLTP workload, in particular, shows that SMT’s
latency tolerance makes SMT an extremely strong
candidate architecture for future database servers.
6 Related work
We are aware of only one other study that has
examined the performance of commercial workloads on
multithreaded architectures. Eickemeyer, et al., [5] used
trace-driven simulation to evaluate the benefits of coarse-
grain multithreading for TPC-C on the OS/400 database.
By using two or three threads, throughput increased by
70%; but with more than 3 threads, no further gains were
achieved. Because their coarse-grain architecture only
switched threads on second-level cache misses,
multithreading could not hide L1 instruction and data
cache misses, which are very common in commercial
workloads. In contrast, simultaneous multithreading
interleaves multiple threads on a cycle-by-cycle basis.
Therefore it hides latencies more effectively, and can
utilize more hardware contexts to achieve greater
throughput gains.
While several other studies characterized memory-
system behavior of database workloads, only one study
analyzed memory access patterns in detail. Trancoso, et
al., [22] used a public-domain DBMS (Postgres95) to
examine the memory access patterns of several DSS
queries on cache-coherent shared-memory multi-
processors, and contrasted the cache effects on various
data structures in the Postgres95 DBMS. Our study does
not examine individual data structures, but contrasts the
effects of OLTP and DSS workloads on the behavior of
database memory regions in a widely-used commercial
database application.
Our paper also extends the cache behavior analysis
presented in other prior work. Franklin, et al., [6] identi-
fied the scarcity of loops and context switches as
contributors to high instruction cache miss rates in com-
mercial applications. Maynard, et al., [12] highlighted the
large instruction footprints and high instruction cache
miss rates of OLTP workloads. In another study, Cvet-
anovic and Bhandarkar [3] used performance counters on
the DEC Alpha chip family (21064 and 21164) to iden-
tify the performance characteristics of a range of
applications, including two commercial workloads.
In addition to characterizing database memory
behavior, prior research has also identified other
bottlenecks, such as pin bandwidth and I/O, in OLTP
workloads. Perl and Sites [14] demonstrated that both
high bandwidth and low latency are required to
effectively run OLTP and other commercial applications.
Their experiments assumed single-cycle instruction
latencies and on-chip cache sizes of the Alpha 21064
(8KB I, 8KB D) and 21164 (8KB I, 8KB D, and 96KB
unified on-chip L2). In our experiments, we model a
more aggressive future processor, with larger on-chip
caches and a higher bandwidth L1-L2 bus (256-bit bus
with 1 bus transfer per processor clock). Pin bandwidth
was therefore a smaller bottleneck; the larger caches and
constructive instruction cache interference (due to SMT)
also reduced the bandwidth demands.
Rosenblum, et al., [16] found that both CPU idle time
and kernel activity were significant when running an
OLTP workload on Sybase. CPU idle time was greater
than 30% because of disk I/O; kernel activity accounted
for 38% of non-idle execution time. However, their
configuration had only one server process to handle 20
clients. Our experiments showed that idle time and kernel
activity can both be reduced with a well-tuned
commercial DBMS. For example, I/O latencies can be
hidden more effectively by using more server processes
(as is typically done in audit runs of TPC benchmarks).
Finally, a few studies have used OLTP and DSS
workloads to evaluate multiprocessor systems or
investigate other performance issues. Thakkar and
Sweiger [18] identified disk I/O and the system bus as
bottlenecks for the TP1 benchmark on a Sequent
Symmetry. Lovett and Clapp [11] focused on the L2
cache behavior and scalability of the Sequent STiNG CC-
NUMA multiprocessor. Verghese, et al., [24] evaluated
page migration and replication for CC-NUMA
architectures. Torrellas, et al., [19] used Oracle running
TP1 to characterize OS cache activity. Kawaf, et al., [8]
and Piantedosi, et al., [15] described optimizations for
improving TPC-C performance on Digital AlphaServers.
7 Conclusions
This paper explored the behavior of database
workloads on simultaneous multithreaded processors,
concentrating in particular on the challenges presented to
the memory system. For our study, we collected traces of
the Oracle DBMS executing under Digital Unix on DEC
Alpha processors, and processed those traces with
simulators of wide-issue superscalar and simultaneous
multithreaded processors.
The conclusions from our simulation study are three-
fold. First, while database workloads have large foot-
prints, there is substantial reuse that results in a small,
cacheable “critical” working set, if cache conflicts can be
minimized. Second, while cache conflicts are high, partic-
ularly in the per-process private data region of the
database, they often result from poorly-suited mapping
policies in the operating system. By selecting the appro-
priate mapping policy, and using application-based
address offsetting, conflict misses on an 8-context SMT
can be reduced to the point where they are roughly com-
mensurate with miss rates for a superscalar. Third, once
cache conflicts are reduced to the superscalar level, an
SMT processor can achieve substantial performance
gains over a superscalar with similar resources. We show
a 3-fold improvement in utilization (IPC) for the OLTP
workload and a 1.5-fold increase for DSS. These perfor-
mance gains occur because of SMT’s ability to tolerate
latencies through fine-grained sharing of all processor
resources among the executing threads; this is demon-
strated by our detailed measurements indicating that
SMT achieves a striking improvement in memory-system
utilization and fetch and issue efficiency, when compared
with the single-threaded superscalar.
We believe that these results indicate that SMT’s
latency tolerance makes it an excellent architecture for
database servers.
Acknowledgments
We would like to thank Marco Annaratone from DEC
WRL for supporting this work, Jef Kennedy from Oracle
for reviewing the manuscript, and Drew Kramer and
Parthasarathy Ranganathan for their technical assistance
in the research. We would also like to thank the referees,
whose comments strengthened this paper. Eggers’ and
Levy’s research are supported by the DEC External
Research Program, NSF grants MIP-9632977 and CCR-
9632769, DARPA contract F30602-97-2-0226, ONR
grant N00014-96-1-0402, and the Washington
Technology Center. Lo was supported by an Intel
Graduate Fellowship, Lo and Parekh by DEC WRL
summer internships.
References
[1] J. Anderson, et al. Continuous profiling: Where have all the
cycles gone? In 16th ACM Symp. on Operating System Prin-
ciples, p. 1–14, Oct. 1997.
[2] L.A. Barroso, et al. Memory system characterization of
commercial workloads. In 25th Ann. Int’l Symp. on Comput-
er Arch., June 1998.
[3] Z. Cvetanovic and D. Bhandarkar. Characterization of Alpha
AXP performance using TP and SPEC workloads. In 21st
Ann. Int’l Symp. on Computer Arch., p. 60–70, April 1994.
[4] S. Eggers, et al. Simultaneous multithreading: A platform for
next-generation processors. In IEEE Micro, p. 12–19, Oct.
1997.
[5] R. Eickemeyer, et al. Evaluation of multithreaded uniproces-
sors for commercial application environments. In 23rd Ann.
Int’l Symp. on Computer Arch., p. 203–212, May 1996.
[6] M. Franklin, et al. Commercial workload performance in the
IBM POWER2 RISC System/6000 processor. IBM J. of Re-
search and Development, 38(5):555–561, April 1994.
[7] V. Gokhale. Design of the 64-bit option for the Oracle7 rela-
tional database management system. Digital Technical Jour-
nal, 8(4):76–82, 1996.
[8] T. Kawaf, et al. Performance analysis using very large mem-
ory on the 64-bit AlphaServer system. Digital Technical
Journal, 8(3):58–65, 1996.
[9] R. Kessler and M. Hill. Page placement algorithms for large
real-indexed caches. ACM Trans. on Computer and Systems,
10(4):338–359, November 1992.
[10] J. Lo, et al. Tuning compiler optimizations for simultaneous
multithreading. In 30th Int’l Symp. on Microarchitecture, p.
114–124, December 1997.
[11] T. Lovett and R. Clapp. STiNG: A CC-NUMA computer
system for the commercial marketplace. In 23rd Ann. Int’l
Symp. on Computer Arch., p. 308–317, May 1996.
[12] A. M. Maynard, et al. Contrasting characteristics and cache
performance of technical and multi-user commercial work-
loads. In Sixth Int’l Conference on Arch. Support for Prog.
Lang. and Operating Systems, p. 145–156, Oct. 1994.
[13] S. McFarling. Combining branch predictors. Technical Re-
port TN-36, DEC-WRL, June 1993.
[14] S. Perl and R. Sites. Studies of Windows NT performance us-
ing dynamic execution traces. In Second USENIX Symp. on
Operating System Design and Implementation, p. 169–183,
Oct. 1996.
[15] J. Piantedosi, et al. Performance of TruCluster systems under
the TPC-C benchmark. Digital Technical Journal, 8(3):46–
57, 1996.
[16] M. Rosenblum, et al. The impact of architectural trends on
operating system performance. In 15th ACM Symp. on Oper-
ating System Principles, p. 285–298, December 1995.
[17] A. Srivastava and A. Eustace. ATOM: A system for building
customized program analysis tools. In ACM SIGPLAN ’94
Conference on Programming Language Design and Imple-
mentation, p. 196–205, June 1994.
[18] S. Thakkar and M. Sweiger. Performance of an OLTP appli-
cation on Symmetry multiprocessor system. In 17th Ann.
Int’l Symp. on Computer Arch., p. 228–238, May 1990.
[19] J. Torrellas, et al. Characterizing the caching and synchroni-
zation performance of a multiprocessor operating system. In
Fifth Int’l Conference on Arch. Support for Prog. Lang. and
Operating Systems, p. 162–174, Oct. 1992.
[20] Transaction Processing Performance Council.TPC Bench-
mark B Standard Specification Revision 2.0. June 1994.
[21] Transaction Processing Performance Council.TPC Bench-
mark D (Decision Support) Standard Specification Revision
1.2. November 1996.
[22] P. Trancoso, et al. The memory performance of DSS com-
mercial workloads in shared-memory multiprocessors. In 3rd
Ann. Int’l Symp. on High-Performance Computer Architec-
ture, p. 250–260, February 1997.
[23] D. Tullsen, et al. Exploiting choice: Instruction fetch and is-
sue on an implementable simultaneous multithreading pro-
cessor. In 23rd Ann. Int’l Symp. on Computer Arch., p. 191–
202, May 1996.
[24] B. Verghese, et al. Operating system support for improving
data locality on CC-NUMA compute servers. InSeventh Int’l
Conference on Arch. Support for Prog. Lang. and Operating
Systems, p. 279–289, Oct. 1996.