Báo cáo khóa học: Insight into the activation mechanism of Bordetella pertussis adenylate cyclase by calmodulin using fluorescence spectroscopy pptx
Bạn đang xem bản rút gọn của tài liệu. Xem và tải ngay bản đầy đủ của tài liệu tại đây (409.31 KB, 13 trang )
Insight into the activation mechanism of
Bordetella pertussis
adenylate cyclase by calmodulin using fluorescence spectroscopy
Jacques Gallay
1
, Michel Vincent
1
, Ine
`
s M. Li de la Sierra
2,
*, He
´
le
`
ne Munier-Lehmann
2
,
Madalena Renouard
1
, Hiroshi Sakamoto
2,
†, Octavian Ba
ˆ
rzu
2
and Anne-Marie Gilles
2
1
Laboratoire pour l’Utilisation du Rayonnement Electromagne
´
tique, UMR 130 du CNRS, Universite
´
Paris-Sud, Orsay, France;
2
Laboratoire de Chimie Structurale des Macromole
´
cules, URA 2185 du CNRS, Institut Pasteur, Paris cedex, France
The interaction of the adenylate cyclase catalytic domain
(AC) of the Bordetella pertussis major exotoxin with its
activator calmodulin (CaM) was studied by time-resolved
fluorescence spectroscopy using three fluorescent groups
located in different regions of AC: tryptophan residues (W69
and W242), a nucleotide analogue (3¢-anthraniloyl-2¢-
deoxyadenosine 5¢-triphosphate, Ant-dATP) and a cysteine-
specific probe (acrylodan). CaM binding elicited large
changes in the dynamics of W242, which dominates the
fluorescence emission of both AC and AC–CaM, similar to
that observed for isolated CaM-binding sequences of dif-
ferent lengths [Bouhss, A., Vincent, M., Munier, H., Gilles,
A.M., Takahashi, M., Baˆ rzu, O., Danchin, A. & Gallay, J.
(1996) Eur. J. Biochem. 237, 619–628]. In contrast, Ant-
dATP remains completely immobile and inaccessible to the
solvent in both the AC and AC–CaM nucleotide-binding
sites. As AC contains no cysteine residue, a single-Cys
mutant at position 75 was constructed which allowed labeling
of the catalytic domain with acrylodan. Its environment is
strongly apolar and rigid, and only slightly affected by CaM.
The protein’s hydrodynamic properties were also studied by
fluorescence anisotropy decay measurements. The average
Brownian rotational correlation times of AC differed signi-
ficantly according to the probe used (19 ns for W242, 25 ns
for Ant-dATP, and 35 ns for acrylodan), suggesting an
elongated protein shape (axial ratio of % 1.9). These values
increased greatly with the addition of CaM (39 ns for W242,
60–70 ns for Ant-dATP and 56 ns for acrylodan). This
suggests that (a) the orientation of the probes is altered with
respect to the protein axes and (b) the protein becomes more
elongated with an axial ratio of % 2.4. For comparison, the
hydrodynamic properties of the anthrax AC exotoxin were
computed by a mathematical approach (
HYDROPRO
), which
usesthe3Dstructure[Drum,C.L.,Yan,S Z.,Bard,J.,
Shen, Y Q., Lu, D., Soelalman, S., Grabarek, Z., Bohm, A.
& Tang, W J. (2002) Nature (London) 415, 396–402]. A
change in axial ratio is also observed on CaM binding, but in
the reverse direction from that for AC: from 1.7 to 1.3. The
mechanisms of activation of the two proteins by CaM
may therefore be different.
Keywords: adenylate cyclase; Bordetella pertussis; calmodu-
lin activation; fluorescent probe; hydrodynamic properties.
cAMP is a key factor for the hormone-dependent control
of important physiological functions such as sugar and
lipid metabolism, cell differentiation, ion homoeostasis, and
apoptosis. Some pathogenic agents have developed toxins,
which interfere with this regulatory pathway by either
altering the endogenous adenylate cyclase activity or
injecting a protein capable of synthesizing cAMP in the
target cell in such large quantities that it completely
deregulates cell metabolism. This is the case for three
pathogens: Bordetella pertussis, Bacillus anthracis and
Pseudomonas aeruginosa. The major exotoxin of Bordetella
pertussis, the causative agent of whooping cough [1,2], is
a large bifunctional 1706-amino-acid protein called CyaA
toxin. It harbors both adenylate cyclase (AC) and hemolytic
activities. The toxin is responsible for the unregulated
synthesis of cAMP [3] on activation by calmodulin (CaM)
[4] present only in the target cells. The C-terminal part is
responsible for the hemolytic phenotype of B. pertussis,and
for the translocation of the catalytic domain into the target
cells [5–7]. The N-terminal domain of about 400 amino
acids contains the CaM-dependent AC [2]. This domain can
be proteolytically split from the rest of the toxin without
losing ATP-cyclizing activity [8–10].
Many molecular characteristics of the N-terminal cata-
lytic domain have been investigated in great detail [11]. The
AC domain of CyaA can be further cleaved by trypsin into
two fragments or subdomains [12,13]. The N-terminal
224-amino-acid fragment possesses the catalytic site; the
C-terminal fragment corresponds mainly to the CaM-
binding subdomain. The catalytic activity of AC depends on
Correspondence to J. Gallay, LURE baˆ timent 209D, PO Box 34,
Universite
´
Paris-Sud, 91898 Orsay cedex, France.
Fax/Tel.:+33164468082,
E-mail:
Abbreviations: AC, adenylate cyclase catalytic domain; CaM, cal-
modulin; AC-Y75C, AC mutant in which Tyr75 is replaced by Cys;
Ant-dATP, 3¢-anthraniloyl-2¢-deoxyadenosine 5¢-triphosphate;
MEM, maximum entropy method.
*Present address: CNRS FRC550, Institut de Biologie Physico-
Chimique, 13 rue Pierre et Marie Curie, 75005 Paris, France.
Present address: Laboratoire de Biologie et Ge
´
ne
´
tique du Paludisme,
Institut Pasteur, 75724 Paris cedex 15, France.
(Received 7 October 2003, revised 30 December 2003,
accepted 9 January 2004)
Eur. J. Biochem. 271, 821–833 (2004) Ó FEBS 2004 doi:10.1111/j.1432-1033.2004.03987.x
three distinct segments common to that of the B. anthracis
AC toxin [11] (Fig. 1). These segments include the P-loop,
consisting of 24 amino acids (residues 54–77 in B. pertussis
AC) and a stretch of 13 amino acids containing D188 and
D190, essential for both catalysis and nucleotide binding
[11,14]. These residues are situated in the catalytic sub-
domain of the protein. The third segment, which is
important for enzymatic activity, is located in the regulatory
subdomain of the molecule and corresponds to the sequence
comprising residues 294–314.
The CaM-binding site of AC partially overlaps the
N-terminal and C-terminal subdomains [13,15,16] (Fig. 1).
A 72-amino-acid sequence located between amino acids 196
and 267 contributes 90% of the binding energy of CaM [11].
Further chemical or proteolytic cleavage of this fragment,
solid-phase synthesis of peptides of various sizes, and site-
directed mutagenesis experiments combined with spectro-
scopic studies led to the conclusion that the amino-acid
sequence around W242, which forms an amphiphilic helical
structure, is the ÔcoreÕ of the CaM-binding site of the enzyme
[9,16–21]. The mechanism of AC activation by CaM, and in
particular the role of the conformational change resulting
from CaM binding, remains obscure. The AC–CaM
complex has a much higher affinity for the fluorescent
ATP analog, 3¢-anthraniloyl-2¢-deoxyadenosine 5¢-triphos-
phate (Ant-dATP), than the free enzyme [22], and therefore
a CaM-induced conformational change in the nucleotide-
binding site was postulated. The recent resolution of the 3D
structure of the anthrax AC exotoxin suggests, however,
that the activation by CaM is the result of a large
conformational change involving a major portion of the
protein [23].
In the absence of 3D data describing the interaction of
CaM with AC, because both AC and AC–CaM have
proved difficult to crystallize, we explored the effect of
CaM on the conformation, internal dynamics, and
hydrodynamic properties of AC from B. pertussis in more
detail by fluorescence spectroscopy. For this purpose, we
used highly purified recombinant proteins. We used three
types of probes. Two Trp residues are present in the
protein: W69 in the catalytic domain and W242 in the
CaM-binding sequence. The fluorescence signal of W69 is
low relative to that of W242 [20]. Therefore, the Trp
fluorescence emission mainly provides information on the
CaM-binding domain (CaM does not contain a Trp
residue). The fluorescent nucleotide derivative Ant-dATP
wasusedasreporterofthelocalstructureanddynamics
of the nucleotide-binding site. The anthraniloyl probe,
introduced initially to label the nucleotide-binding site of
cyclic nucleotide phosphodiesterase [24], is a small fluoro-
phore relative to the nucleotide moiety, which provides a
strongly enhanced signal when bound to proteins rather
than buffer [25–27]. Taking advantage of the absence of
cysteine residues in the wild-type protein, we constructed a
mutant with a single Cys residue at position 75 in the
catalytic subdomain (Fig. 1). This mutation has little effect
on the enzymatic activity, i.e. less than 10% decrease in
specific activity. The K
d
for CaM of the modified protein
(0.3 n
M
) was also not significantly different from that of
thewild-typeenzyme(0.2n
M
). We then used acrylodan,
a probe sensitive to polarity [28,29], to label Cys75, to
provide additional information on the conformation and
dynamics of the catalytic subdomain of the protein.
Equilibrium ultracentrifugation was also used to measure
the molecular mass of both proteins. The results are
discussed with respect to the structure of anthrax exotoxin
and its changes on CaM binding [23].
Materials and methods
Chemicals
Ant-dATP was synthesized as described previously [22]. All
the other chemicals were of the highest grade commercially
available.
Bacterial strains, plasmids and growth conditions
A DNA fragment encoding the first 385 amino acids of
B. pertussis AC was PCR-amplified, using oligonucleotides
5¢-GGGGCATATGCAGCAATCGCATCAGGCTGG
TTA and RC3¢-CCCCAAGCTTCACGCCGGCACCGT
TTCCAGTACATC. Genomic DNA from strain 18323
was used as the template. This PCR fragment was cloned
into the expression vector pET24a (Novagen), between
restriction sites NdeIandHindIII, resulting in plasmid
pHSP247. To generate the mutant AC-Y75C, the template
used was pDIA5311 (obtained by site-directed mutagenesis
as described by Glaser et al. [14]; a gift from E. Krin,
Pasteur Institute, Paris). The PCR fragment was cloned into
pET24a as for the wild-type, resulting in plasmid pHL12-2.
For the production of recombinant proteins, strain
BL21(DE3)/pDIA17/pHSP247 or BL21(DE3)/pDIA17/
pHL12-2 was grown in a fermentor at 37 °Cin2YT
medium containing kanamycin (100 lgÆmL
)1
)andchlo-
ramphenicol (30 lgÆmL
)1
), until D
600
reached a value of
% 8. Addition of isopropyl b-
D
-thiogalactoside (1 m
M
final
concentration) induced overproduction. Bacteria were har-
vested by centrifugation after a further incubation of 3 h.
Purification of the recombinant proteins
AC purification. Bacteria were suspended in 50 m
M
Tris/
HCl, pH 8.0, and disrupted by sonication. After centri-
fugation at 10 000 g for 30 min, the supernatant was
discarded. The pellet was then washed three times in the
same buffer and suspended in 8
M
urea/50 m
M
Tris/HCl,
pH 8.0. After centrifugation, the recovered supernatant was
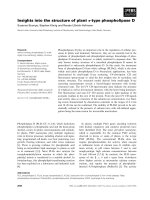
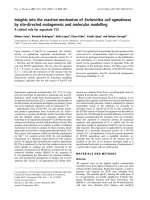
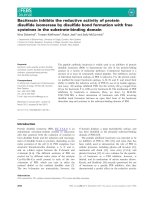
Fig. 1. AC domain of B. pertussis CyaA toxin. R224 is the site of
trypsin cleavage of the protein in the two subdomains. I, II and IV
correspond to those segments possessing high sequence identity with
B. anthracis AC. These segments harbor amino-acid residues (K58,
K65 or H63 in I, D188 and D190 in II and H298 and E301 in IV)
critical for ATP cyclization. III corresponds to the segment responsible
for tight binding of CaM to AC. In italics (Y75, W69 and W242) are
indicated those residues used as fluorescent probes. Y75 was muta-
genized to Y75C and labeled with acrylodan.
822 J. Gallay et al.(Eur. J. Biochem. 271) Ó FEBS 2004
diluted 10-fold with 50 m
M
Tris/HCl, pH 8.0, and loaded
on to a DEAE-Sephacel column equilibrated at 4 °Cwith
50 m
M
Tris/HCl, pH 8.0. AC was eluted with 0.1
M
NaCl
in the same buffer. The purification by hydrophobic
chromatography increased the specific activity of AC eluted
with 0.1
M
NaCl by a factor of 1.3 (from 138 UÆmg
)1
to
185 UÆmg
)1
) and the percentage of CaM activation by a
factor of 1.6. It produces a pure protein, as revealed by
SDS/PAGE and gel filtration on a Shodex KW802.5, which
shows a single elution peak. Fractions containing the
enzyme were pooled and concentrated before being loaded
on to a Sephacryl S-300 HR column equilibrated with
50 m
M
Tris/HCl, pH 8.0.
CaM purification. Mouse brain CaM was cloned and
expressed in Escherichia coli as described [30]. The protein
was recovered in the supernatant after bacterial disruption
by sonication. It was then kept in 50 m
M
Tris/HCl, pH 7.4,
for further purification. The protein was purified by
hydrophobic chromatography as follows: 146 mg unpuri-
fied CaM in 50 m
M
Tris/HCl (pH 7.4)/5 m
M
CaCl
2
was
loaded on to a Phenyl-Sepharose column equilibrated at
room temperature with 50 m
M
Tris/HCl, pH 7.4, contain-
ing 0.5 m
M
CaCl
2
and 1 m
M
dithiothreitol. The column
was washed first with the equilibration buffer, secondly
with 0.5
M
NaCl in the equilibration buffer, and thirdly with
50 m
M
Tris/HCl, pH 7.4, containing 0.1 m
M
CaCl
2
and
1m
M
dithiothreitol. Finally, the CaM protein was eluted in
50 m
M
Tris/HCl, pH 7.4, containing 1 m
M
dithiothreitol
and 1 m
M
EGTA. The CaM solution was dialysed against
50 m
M
Tris/HCl, pH 7.4.
AC–CaM complex purification. For the formation of the
AC–CaM complex, the urea extract containing AC was
diluted eightfold (1
M
urea final concentration) then
incubated in % 1:1molarratiowithCaMfor2hin
50 m
M
Tris/HCl, pH 8.0. The AC–CaM mixture was
loaded on to a DEAE-Sephacel column equilibrated with
50 m
M
Tris/HCl, pH 8.0 at 4 °C. The column was washed
extensively (10 volumes) with 50 m
M
Tris/HCl, pH 8.0, and
then with 0.1
M
NaClinthesamebuffer.TheAC–CaM
complex was eluted with 0.2
M
NaCl in 50 m
M
Tris/HCl,
pH 8.0. The AC–CaM complex obtained in this first step
was concentrated and loaded in a second step on to a
Sephacryl S-300 HR column equilibrated at 4 °Cwith
50 m
M
Tris/HCl, pH 8.0.
Assay of AC
Enzyme activity was monitored by ATP formation (reverse
reaction), at 334 nm and 30 °C in 0.5 mL final volume in
an Eppendorff photometer equipped with a temperature-
controlled system. The reaction mixture contained 50 m
M
Tris/HCl, pH 7.4, 20 m
M
KCl, 1 m
M
glucose, 0.4 m
M
NADP, 5 m
M
cAMP, 6 m
M
MgCl
2
,4m
M
sodium pyro-
phosphate, 1 l
M
calmodulin, and 3 U each of hexokinase
and glucose-6-phosphate dehydrogenase. The reaction was
started with the AC sample. One unit of enzyme activity
corresponds to 1 lmol product formed per min. The
enzyme of highest purity exhibited % 500 UÆ(mg protein)
)1
.
This value is sixfold lower than that obtained in the forward
reaction.
Synthesis of the acrylodan conjugate of the AC-Y75C
mutant
A1mgÆmL
)1
acrylodan stock solution (4.4 m
M
)indimeth-
ylformamide was used for labeling. The AC-Y75C mutant
(0.8 mgÆmL
)1
) was dialyzed twice against 500 mL 50 m
M
Hepes buffer, pH 7 for 2 h. It was then labeled by adding
4 lL of the acrylodan stock solution (35 l
M
final concen-
tration) to 500 lL of the protein solution at a concentration
of 25 l
M
. Incubation was performed in ice for 2 h. Free
label was removed by gel filtration on a Shodex KW802.5
column equilibrated in 50 m
M
Hepes buffer, pH 7. A bound
probe/protein molar ratio of % 1 was estimated using
molar absorption coefficients for acrylodan of 16400 and
6200
M
)1
Æcm
)1
at 385 and 290 nm, respectively [28].
Steady-state and time-resolved fluorescence
measurements
Steady-state fluorescence emission spectra and anisotropy
were recorded on an SLM 8000 spectrofluorimeter. Fluor-
escence intensity and anisotropy decays were obtained by
the time-correlated single-photon counting technique from
the polarized components I
vv
(t) and I
vh
(t) on the experi-
mental set-up installed on the SB
1
window of the synchro-
tron radiation machine Super-ACO (Anneau de Collision
d’Orsay) [31]. The excitation wavelength was selected by
a double monochromator (Jobin Yvon UV-DH10, band-
width 4 nm). A MCP-PMT Hamamatsu (model R3809U-
02) was used. Time resolution was % 20 ps, and the data
were stored in 2048 channels. Automatic sampling cycles
including 30 s accumulation time for the instrument
response function and 90 s acquisition time for each
polarized component were carried out so that a total of
(2–4) · 10
6
counts was reached in the fluorescence intensity
decay. Analyses of fluorescence intensity decay, I(t) recon-
structed from the parallel I
vv
(t) and perpendicular I
vh
(t)
polarized components, as sums of exponentials were
performed by the maximum entropy method (MEM) as
described in detail in previous publications [32–34]. The 1D
model of anisotropy, in which each lifetime s
i
is coupled to
any rotational correlation time h
i
, performed analyses of
the polarized fluorescence decays. A 2D analysis, essential
for describing the coupling between lifetimes and rotational
correlation times, was also used. For fluorescence intensity
and anisotropy decay analysis (with the 1D model),
computations were performed on a DEC Vax station
4000/90. The 2D analyses were carried out on a DEC
alpha computer Vax7620 with a set of 1600 independent
variables (40 s and 40 h equally spaced in log scale). The
programs including the MEMSYS 5 subroutines (MEDC
Ltd, Cambridge, UK) were written in double precision
FORTRAN
77.
Other analytical procedures
Protein concentration was determined as described by
Bradford [35]. SDS/PAGE was performed as described by
Laemmli [36], and native electrophoresis by the method of
Bollag & Edelstein [37]. Gels were stained with Coomassie
blue. Equilibrium sedimentation experiments were per-
formed at 20 °C on a Beckmann XLA ultracentrifuge using
Ó FEBS 2004 CaM-induced conformational transition in AC (Eur. J. Biochem. 271) 823
a double sector cell rotor AN60 equipped with a 12-mm
opticalpathcell.Proteinsamplesin50m
M
Tris/HCl, pH 8,
were centrifuged at 17 000 r.p.m. Radial scans of A
290
were
taken at 2-h intervals. Equilibrium was achieved after 20 h
centrifugation.
Results
Biochemical characterization of the AC, CaM and
AC–CaM proteins
Recombinant AC was isolated from inclusion bodies. Our
aim was to obtain pure and homogeneous enzyme prepa-
rations from the standpoint of activity. The purification
procedure we described is based on the rapid re-activation
of AC after denaturation by urea, and on the fact that AC
and CaM differ largely in their isoelectric points, allowing
them to be separated either in free form or in a complex, by
ion-exchange chromatography. Thus, AC was purified as
a free enzyme by elution in buffers close to neutrality and
0.1
M
NaCl. CaM, which is more acidic, required 0.3
M
NaCl to be eluted. The AC–CaM complex was isolated
from the free proteins at 0.2
M
NaCl. As the K
d
of the
AC–CaM complex is 0.2 n
M
, dissociation of the complex
under our experimental concentration conditions is insigni-
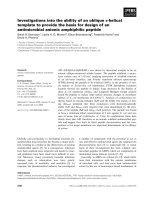
ficant. This is shown in Fig. 2 in which AC, CaM and the
AC–CaM complex were analyzed by gel electrophoresis
under native or denaturing conditions. In each case, single
bands of proteins were obtained, indicating purity and
homogeneity of each molecular species. On the other hand,
analytical ultracentrifugation studies indicated a homogen-
eous AC–CaM complex with 1 : 1 stoichiometry (molecular
mass of 53.7 kDa) and homogeneous uncomplexed AC
(41.6 kDa).
Dynamics of the AC nucleotide-binding site as probed
by Ant-dATP
To explore the dynamics of the catalytic domain of the
protein, we used the fluorescent nucleotide Ant-dATP, a
strong competitive inhibitor of AC activity [22]. Binding of
Ant-dATP to the AC–CaM complex led to a large increase
in the steady-state fluorescence intensity and a blue shift of
the emission spectrum [22]. Time-resolved fluorescence of
this kind of probe has proven useful for separating the free
and bound nucleotides as they have very different lifetimes.
This allows their dynamics and accessibility to the solvent in
the nucleotide-binding site to be studied [27].
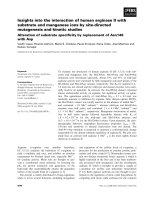
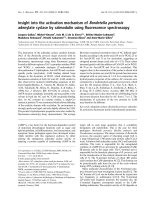
The time-resolved fluorescence intensity decay of Ant-
dATP in solution was strongly modified in the presence of
either AC or AC–CaM complex (Fig. 3). In the presence of
AC (Fig. 4B) or AC–CaM complex (Fig. 4C), a population
with a long lifetime (% 10 ns) appeared in the fluorescence
decay curve, which was absent in the decay of the free probe
(Fig. 4A), similar to that observed for Ant-dADP binding
to CMP kinase from E. coli [27]. This long lifetime remained
unchanged on CaM binding: only its amplitude increased
as a result of the increased affinity of the complex for the
ligand [22]. From this relative amplitude, the binding degree
of Ant-dATP can be calculated. The K
d
values obtained
in this way for AC and AC–CaM were 52 and 11 l
M
,
respectively (Fig. 5). The last value is close to that measured
by equilibrium dialysis (K
d
¼ 6.8 l
M
) or from kinetic
measurements (K
i
¼ 9 l
M
) [22]. The K
d
value obtained
for AC is, however, smaller than previously reported [22].
This is probably due to greater accuracy of the present
measurements (Fig. 5) than in the previous studies [22].
Quenching by water-soluble molecules permits assess-
ment of the accessibility of the bound nucleotide to the
aqueous solvent. Time-resolved acrylamide quenching
measurements gave linear Stern–Volmer plots (Fig. 6),
allowing determination of the bimolecular quenching con-
stants (k
q
) related to the accessibility of the fluorophore to
the water-soluble quencher acrylamide (Table 1). The 10-ns
lifetime assigned to Ant-dATP bound to either AC or
AC–CaM is associated in both cases with a % 20 times
lower k
q
value than that associated with the 2-ns lifetime
(Table 1). The k
q
value for the latter is in turn similar to that
for Ant-dATP in buffer, which is the value used as a
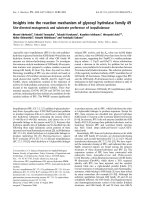
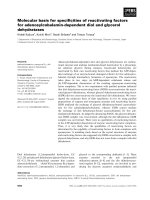
Fig. 2. Gel electrophoresis under denaturing (A) (12.5% acrylamide) or
native (B) (10% acrylamide) conditions of AC, CaM and AC–CaM
complex separated by ion-exchange chromatography. Lane 1, AC (3 lg)
eluted with 0.1
M
NaCl;lane2,purifiedAC–CaMcomplex(3lg)
eluted with 0.2
M
NaCl; lane 3, CaM (3 lg) eluted with 0.3
M
NaCl.
Standard proteins: (a) phosphorylase a (94 000 Da); (b) BSA
(66 200 Da); (c) ovalbumin (43 000 Da); (d) carbonic anhydrase
(30 000 Da); (e) soybean trypsin inhibitor (21 000 Da); (f) lysozyme
(14 000 Da).
Fig. 3. Fluorescence intensity decay of Ant-dATP. (A) Instrumental
response function; (B) Ant-dATP in water; (C) Ant-dATP with AC;
(D) Ant-dATP with AC–CaM.
824 J. Gallay et al.(Eur. J. Biochem. 271) Ó FEBS 2004
reference for the fully solvent-accessible nucleotide
(Table 1). This 2-ns lifetime present in the fluorescence
decays of both AC and AC–CaM (in much smaller
proportion in the latter case) is therefore probably due to
free Ant-dATP in equilibrium with the bound nucleotide.
The resulting k
q
ratio corresponds to a relative accessibility
of the fluorescent moiety to the water-soluble quencher of
less than 5% when the nucleotide is bound to either AC or
AC–CaM [38].
We further explored the dynamics of the nucleotide
bound to AC and AC–CaM by fluorescence anisotropy
decay measurements. The fluorescence anisotropy decay of
Ant-dATP in buffer declined smoothly and rapidly
(Fig. 7A, curve 1). MEM analysis of the polarized decays
using the 1D model of the anisotropy showed only one
rotational correlation time of 0.27 ns (Fig. 7B), close to the
value previously observed for Ant-dADP [27] correspond-
ing to the Brownian rotation of the fluorescent nucleotide
in solution. The initial anisotropy value, A
t ¼ 0
, is however,
0.2, lower than the intrinsic anisotropy A
0
of 0.34 measured
for the immobilized Ant-dATP (or Ant-dADP) in vitrified
medium [27]. This suggests that faster motions are likely. In
contrast, the fluorescence anisotropy decay of Ant-dATP
in the presence of either AC or AC–CaM did not follow
a smooth pattern. It began with a fast decrease (starting
from an initial anisotropy A
t ¼ 0
of 0.25–0.3) followed by
a transient increase and a further slow decrease (Fig. 7A,
curve 2). This type of switchback behavior, due to the
additive rule of the anisotropy, is characteristic of systems
presenting fluorescence heterogeneity with specific coupling
Fig. 5. Binding of Ant-dATP to AC (d) and AC–CaM (m). The degree
of binding of the ligand was calculated from the value of the ampli-
tude of the long lifetime, which characterizes the bound fluorescent
nucleotide.
Fig. 6. Stern–Volmer plots of time-resolved acrylamide quenching of
Ant-dATP. (d) 2 ns lifetime of Ant-dATP (2 l
M
)inwater;(s)2ns
lifetime of Ant-dATP (2 l
M
) in the presence of AC (50 l
M
)and
AC–CaM (20 l
M
); (j)10nslifetimeofAnt-dATP,(h) 10 ns lifetime
of Ant-dATP (2 l
M
) in the presence AC–CaM (20 l
M
).
Fig. 4. MEM-reconstructed excited-state lifetime distributions of Ant-
dATP. The analyses were performed on the total fluorescence intensity
S(t), reconstructed from the parallel and perpendicular polarized
decay components I
vv
(t) and I
vh
(t) such as SðtÞ¼I
vv
ðtÞþ
2b
corr
I
vh
ðtÞ¼
R
1
0
aðsÞexpðÀt=sÞdt; where s is the excited-state life-
time, a(s) its amplitude and b
corr
is a correction factor accounting for
the difference in transmission of the I
vv
(t) and I
vh
(t) components by the
monochromator [60]. Sets of 150 independent variables, equally spaced
in log scale, were used for the analyses. The s
i
and a
i
values given in
the legend are the center and relative area of each lifetime peak,
respectively. (A) 4 l
M
Ant-dATP in 50 m
M
Tris/HCl buffer, pH 8,
s
1
¼ 0.14 ns, s
2
¼ 2.1 ns, a
1
¼ 0.21, a
2
¼ 0.79. Excitation wave-
length, 330 nm; emission wavelength, 430 nm. (B) 4 l
M
Ant-dATP in
the presence of 26.3 l
M
AC, s
1
¼ 0.39 ns, s
2
¼ 2.3 ns, s
3
¼ 10.5 ns,
a
1
¼ 0.12, a
2
¼ 0.67; a
3
¼ 0.21. Excitation wavelength, 340 nm;
emission wavelength, 420 nm. (C) 5 l
M
Ant-dATP in the presence of
20 l
M
AC–CaM, s
1
¼ 0.38 ns, s
2
¼ 2.0 ns, s
3
¼ 11 ns, a
1
¼ 0.05,
a
2
¼ 0.58; a
3
¼ 0.38. Excitation wavelength, 340 nm; emission
wavelength, 420 nm.
Ó FEBS 2004 CaM-induced conformational transition in AC (Eur. J. Biochem. 271) 825
between short lifetimes and short correlation times and
conversely between long lifetimes and long correlation
times [39]. The anisotropy at short times will thus decline
rapidly, as the rotational motion of the short-lived emitter
is fast. In contrast, the anisotropy at long times will decline
more slowly, as the rotational motion of the long-lived
emitter is slow. The anisotropy decay pattern at inter-
mediate time will result from a combination of fast and slow
decays of the free and bound probe, respectively. This type
of behavior was originally observed in membranes [40],
proteins [41,42] and nucleic acids [33]. The MEM analysis
of the polarized fluorescence decays using the classical 1D
model of anisotropy, which associates all lifetimes with all
the correlation times, was unable to account for the fast
initial decay as shown in Fig. 7C for AC–CaM. Only one
long rotational correlation time (h > 100 ns) was obtained
in this case. Visual inspection of the deviation function
clearly showed that analysis at short times is not correct
(Fig. 7C, insert).
The two main lifetimes of Ant-dATP (2 and 10 ns) are
therefore likely to be associated with different rotational
dynamics. MEM allows analysis without apriorihypothesis
on the association degree between lifetimes (s) and corre-
lation times (h) [33]. In the present case, MEM analysis
shows, as a result of the fit, a single association between the
2 ns excited-state population and a fast rotating component
(% 200 ps). This is shown on the 2D (s, h) plots (Fig. 8A,B);
the value is similar to that of the unbound nucleotide
(Fig. 7B).
Conversely, we show a single association of the long-lived
excited-state population with a long rotational correlation
time, which probably describes the Brownian rotational
motion of the protein. The Brownian rotational correlation
times increased greatly from % 25 ns for AC (Fig. 8A) to
60–70 ns for AC–CaM (Fig. 8B).
No other cross-correlation peaks in the 200 ps time range
or shorter were observed for this lifetime population for
either AC or AC–CaM. This indicates that the bound Ant-
dATP is immobile in the 100–200 ps time scale. Supporting
this hypothesis, the initial anisotropy at t ¼ 0 when the
probe is in the presence of AC or AC–CaM is 0.25–0.3
(Fig. 7A curve 2). This value is higher than that observed
for free Ant-dATP and closer to 0.34, the intrinsic A
0
value
measured for the immobile probe in vitrified medium [27].
Taking into account the additive rule of the anisotropies, we
calculated the initial anisotropy value for the bound probe,
knowing its partial intensity, as A
t ¼ 0
% 0.31–0.34. There-
fore, bound Ant-dATP may be subjected to motions of
small amplitude occurring in a faster time scale than 200 ps,
but they are not detectable in the 2D analyses even though
we imposed an A
0
value of 0.34.
These results confirm that the 2 ns lifetime corresponds to
free Ant-dATP, which is fully accessible to and moving
rapidly in the solvent, whereas the 10 ns lifetime character-
izes the bound nucleotide, which is weakly accessible to the
solvent and immobilized in its binding site in both the
uncomplexed AC and the AC–CaM complex.
Dynamics of the AC catalytic domain as probed
by acrylodan
Taking advantage of the absence of Cys residues in the
native AC protein, the insertion of a Cys in a defined
position allowed specific and unique labeling so that
information on the conformational changes induced by
CaM in different domains of the protein could be obtained.
Table 1. Time-resolved dynamic acrylamide quenching constants for
Ant-dATP in solution and in the presence of AC or AC–CaM. The
bimolecular quenching constant k
q
was calculated as k
q
¼ K
sv
/s.
Standard deviations for 3 (Ant-dATP), 10 (Ant-dATP/AC–CaM) and
17 (Ant-dATP/AC) measurements are given.
Sample s (ns)
K
sv
(
M
)1
)
k
q
· 10
9
(
M
)1
Æs
)1
)
Ant-dATP in buffer 2.07 ± 0.02 3.74 1.81 ± 0.02
Ant-dATP/AC 10.37 ± 0.39 1.09 0.11 ± 0.01
2.22 ± 0.04 4.14 1.86 ± 0.04
Ant-dATP/AC–CaM 10.75 ± 0.19 1.04 0.10 ± 0.01
2.02 ± 0.05 3.78 1.87 ± 0.05
Fig. 7. Fluorescence anisotropy decay of Ant-dATP in buffer and
bound to AC. (A) Experimental fluorescence anisotropy decay
AðtÞ¼
I
vv
ðtÞÀb
corr
I
vh
ðtÞ
I
vv
ðtÞþ2b
corr
I
vh
ðtÞ
of Ant-dATP in buffer (curve 1) and in the
presence of AC–CaM (curve 2). (B) Rotational correlation time dis-
tribution of Ant-dATP in buffer (insert, deviation function). (C)
Rotational correlation time distribution of 1 l
M
Ant-dATP in the
presence of 20 l
M
AC–CaM; v
2
¼ 1.349 (insert, deviation function).
826 J. Gallay et al.(Eur. J. Biochem. 271) Ó FEBS 2004
Cys was inserted at position 75 (replacing the native Tyr
residue) to label the catalytic domain, as W69 is almost
silent. The mutation did not result in any alteration in
enzymatic activity. Acrylodan was chosen because it is
specific for SH groups and is extremely sensitive to polarity
changes [28,29].
The maximum of the steady-state fluorescence emission
spectrum of acrylodan conjugated to AC-Y75C was at
448 nm (Fig. 9A), revealing a local environment of very low
polarity. In comparison, the maximum of the emission
spectrum of the probe is at 462 nm in the aprotic solvent
dimethylformamide, 485 nm in isobutanol, 490 nm in
ethanol, 504 nm in glycerol, and 540 nm in water [28].
Binding of CaM led to a red shift of the emission spectrum
to 466 nm (Fig. 9A), indicating that the local polarity and
accessibility to the solvent is slightly increased in the AC-
Y75C–CaM complex. It remains, however, of the order of
that found in aprotic solvents. The fluorescence intensity
Fig. 8. MEM-reconstructed G(s, h) distributions of Ant-dATP.
(A) 4 l
M
Ant-dATP in the presence of 56 l
M
AC; v
2
¼ 1.018; (B)
1 l
M
Ant-dATP in the presence of 20 l
M
AC–CaM; v
2
¼ 1.006.
The fit was performed on the polarized fluorescence intensity
decays I
vv
(t) and I
vh
(t) using their classical expressions: I
vv
ðtÞ¼
1
3
R
1
0
R
1
0
Cðs; hÞe
Àt=s
ð1 þ 2A
0
e
Àt=h
Þdsdh and I
vh
ðtÞ¼
1
3
R
1
0
R
1
0
Cðs; hÞ
 e
Àt=s
ð1 À A
0
e
Àt=h
Þdsdh. G(s, h) is the relative proportion of emitter
with lifetime s and correlation time h, A
0
is the intrinsic anisotropy.
This analysis starts with an initial model of the G(s, h) distribution as a
ÔflatÕ mapwhereallthe(s, h) are equiprobable. A value of the intrinsic
anisotropy of 0.34 was used [27].
Fig. 9. Fluorescence characteristics of acrylodan bound to AC-Y75C
mutant. (A) Fluorescence emission spectra of acrylodan bound to AC-
Y75C (––) and AC-Y75C–CaM (- - -). (B) MEM-reconstructed exci-
ted-state lifetime distributions of acrylodan bound to AC-Y75C (––)
and to AC-Y75C–CaM (- - -) measured at the maximum of the
fluorescence emission spectrum. (C) MEM-reconstructed rotational
correlation time distribution of acrylodan bound to AC-Y75C (––),
and to AC-Y75C–CaM (- - -). –– (AC): b
1
¼ 0.050, b
2
¼ 0.318,
h
1
¼ 9ns, h
2
¼ 36 ns, A
t ¼ 0
¼ 0.368. - - - (AC–CaM): b
1
¼ 0.030,
b
2
¼ 0.329, h
1
¼ 8ns,h
2
¼ 56 ns, A
t ¼ 0
¼ 0.359. Excitation wave-
length, 400 nm; emission wavelength, 460 nm.
Ó FEBS 2004 CaM-induced conformational transition in AC (Eur. J. Biochem. 271) 827
decayofacrylodanmeasuredinbothAC-Y75CandAC-
Y75C–CaM did not show a large change: a major lifetime
population, centered at 4.1 ns for the former and at 3.9 ns
for the latter, characterized the decay, which accounted for
92% of the fluorescence intensity in both cases (Fig. 9B).
The local mobility was weak and remained unaffected by
CaM binding as shown by fluorescence anisotropy decay
measurements. In both cases the decays show two rotational
correlation times in the nanosecond range (Fig. 9C). The
shortest is probably due to the existence of a slow local
flexibility of weak amplitude. The initial anisotropy values
A
t ¼ 0
were close to that measured in vitrified medium
(A
0
¼ 0.370), therefore no subnanosecond motion of signi-
ficant amplitude was present. The longest correlation time
describing the average Brownian rotation of the protein
displayed a large increase, however, from 36 ns for AC-
Y75C to 56 ns for AC-Y75C–CaM.
Dynamics of the CaM-binding domain probed by W242
W242 dominates the intrinsic fluorescence emission of the
protein [20]. It is situated in the middle of the 72-amino-acid
segment responsible for 90% of the AC–CaM binding
energy (P196–267) and therefore provides information
mainly on the dynamics of this region of the protein. This
residue is probably widely accessible to the solvent in AC as
shown by the maximum wavelength of the fluorescence
emission spectrum of 350 nm as previously reported [18].
The fluorescence intensity decay was multiexponential as
usually found in proteins, with four lifetime populations
describing the decay (Table 2). Such large fluorescence
heterogeneity is probably due to fast local dynamics and
flexibility detected by fluorescence anisotropy measurements
(Table 3). Two rotational correlation times were observed
in the nanosecond range, the shorter probably describing a
local flexibility, the longer related to the Brownian rotation
of the protein. The initial anisotropy value (A
t ¼ 0
)was,
however, significantly lower than the A
0
value measured in
vitrified medium [43]. Therefore faster motions are probably
present, leading to a substantial wobbling-in-cone angle
x
max
(Table 3). We noticed that the dynamics of W242 in
the protein is almost as large as that of W242 in the isolated
peptide sequence P196–267 [16]. This strongly suggests that
this part of the protein is highly dynamic, showing
nanosecond flexibility.
CaM binding reduces the dynamics of this region greatly.
Two rotational correlation times in the nanosecond range
were observed in the AC–CaM complex (Table 3). Some
subnanosecond motions still remain possible, but they are
very weak in amplitude as the initial anisotropy (A
t ¼ 0
)
value was almost equal to that expected for an immobile
Trp [43]. The wobbling-in-cone angle x
max
is therefore
greatly reduced (Table 3). This observation is similar to that
of the isolated peptide complexed with CaM [16]. In
addition to the fast motions, a long rotational correlation
time, which probably describes an average Brownian
Table 2. Fluorescence intensity decay parameters of the Trp emission of AC and AC–CaM complex recovered by MEM. Excitation wavelength,
295 nm; emission wavelengths, 350 nm for AC and 335 nm for AC–CaM. Standard deviations for three measurements are given. MEM analysis
was performed on the fluorescence intensity S(t) as described in the legend of Fig. 3.
Sample
s
1 (ns)
a
a
b
1
I
1
c
s
2 (ns)
a
2
I
2
s
3 (ns)
a
3
I
3
s
4 (ns)
a
4
I
4
<s>
(ns)
d
AC 0.34 ± 0.07 0.88 ± 0.01 3.24 ± 0.34 6.50 ± 0.59 1.73 ± 0.12
0.21 ± 0.03 0.56 ± 0.02 0.10 ± 0.03 0.13 ± 0.03
0.04 0.28 0.19 0.49
AC–CaM 0.49 ± 0.03 1.12 ± 0.10 4.18 ± 0.17 – 1.65 ± 0.02
0.27 ± 0.03 0.50 ± 0.01 0.23 ± 0.02 –
0.08 0.34 0.58 –
a
s
i
and
b
a
i
are, respectively, the values of the center and the normalized amplitude of each lifetime peak.
c
I
i
are the values of the partial
intensity of the i
th
component I
i
¼ a
i
s
i
/<s>.
d
The mean lifetime <s> is calculated as: hsi¼
P
i
a
i
s
i
.
Table 3. Fluorescence anisotropy decay parameters of the Trp emission of AC and AC–CaM complex obtained by MEM analysis of the fluorescence
polarized decays, using a 1D model of the anisotropy where all lifetimes s are coupled to all correlation times h. The fluorescence anisotropy decay is
described in this model by a sum of exponential terms: AðtÞ¼
I
vv
ðtÞÀb
corr
I
vh
ðtÞ
I
vv
ðtÞþ2b
corr
I
vh
ðtÞ
¼
R
1
0
bðhÞexpðÀt=hÞd h,withA
0
¼
R
1
0
b(h)d(h). b(h) is the anisotropy
associated with the rotational correlation time h, b
corr
is the correction factor defined in the legend of Fig. 3. The fit was simultaneously performed
on the vertically I
vv
ðtÞ¼1=3
R
1
0
aðsÞe
Àt=s
ds½1 þ 2A
0
R
1
0
b(h)d(h)] and on the horizontally I
vh
ðtÞ¼1=3
R
1
0
aðsÞe
Àt=s
ds½1 À A
0
R
1
0
b(h)d(h)]
emitted fluorescence decays, s is the excited state lifetime and a(s) its amplitude. The a(s) profile is obtained from a first analysis of I(t) by MEM and
is held constant in a subsequent and global analysis of I
vv
(t) and I
vh
(t) which provides the distribution b(h) of correlation times [34]. Sets of 100
independent variables, equally spaced in log scale, were used for the analyses. The semiangle of the wobbling-in-cone motion was calculated as:
b
2
A
0
¼½1=2cosx
max
ð1 þ cosx
max
Þ
2
[59] with an intrinsic anisotropy value A
0
of 0.197 [43]. Experimental conditions as in Table 2.
Sample h
1
(ns) h
2
(ns) b
1
b
2
A
0
x
max
(°)
AC 2.3 ± 0.5 19 ± 5 0.094 ± 0.010 0.077 ± 0.013 0.171 ± 0.010 44
AC–CaM 2.5 ± 0.9 39 ± 2 0.035 ± 0.013 0.157 ± 0.027 0.192 ± 0.017 22
828 J. Gallay et al.(Eur. J. Biochem. 271) Ó FEBS 2004
rotation, is present in the decays of both AC and AC–CaM
(Table 3). Its value was greatly increased in the AC–CaM
complex relative to AC.
Hydrodynamic properties of the AC and of the AC–CaM
complex
Hydrodynamic properties of proteins can be studied using
fluorescence anisotropy decays [44]. The fluorescence
anisotropy decay data for all the three probes used in this
work showed the existence of a single long correlation time
(‡ 20 ns), either for AC or AC–CaM, which probably
describes average Brownian rotation. This long rotational
correlation time differs, however, according to the fluoro-
phore used. For AC, the values ranged from 19 ns for W242
(Table 3) to 25 ns for Ant-dATP (Fig. 8A) and up to 35 ns
for acrylodan (Fig. 9C). This observation strongly suggests
that AC is not spherical. For the AC–CaM complex, the
values ranged from 39 ns for W242, 56 ns for acrylodan,
and 60–70 ns for Ant-dATP (Table 3, Figs 9C and 8B),
suggesting that the shape of the AC–CaM complex also
diverges significantly from that of a sphere. These average
Brownian rotational correlation times for AC–CaM were
significantly larger than that for AC, suggesting that the
former is more elongated than the latter. This will be
discussed in greater detail in the discussion.
Discussion
Several mechanisms of CaM-mediated activation of differ-
ent biological systems have been proposed. The molecular
characteristics of the AC protein, however, are difficult to
reconcile with any of them. Neither the pseudo-substrate
mechanism, which involves an auto-inhibitory sequence [45],
nor the flip-flop mechanism, which involves the existence of a
CaM-like binding site in addition to the true CaM-binding
site [46], can be applied to AC. The mosaic distribution of its
different functional modules (Fig. 1), i.e. the ATP-binding
site, the CaM-binding sequence, the residues of the catalytic
site, favors a new activation mechanism. Recently, the
resolution of the 3D structure of the AC exotoxin of
B. anthracis andofitscomplexwithCaMledtotheproposal
of a different CaM-dependent regulatory mechanism, in
which two large protein segments, situated between the
catalytic and the regulatory domains, undergo a large-scale
conformational transition [23]. This system is closely related
to that of B. pertussis, although the sequence alignment does
not show much similarity, especially in the CaM-binding
domain. Most of the crucial amino-acid residues responsible
for catalysis and ATP binding are, however, conserved in
both proteins [23]. With respect to the 3D structure of the
B. anthracis exotoxin, all of the residues of the catalytic
mechanism are present in the neighborhood of the catalytic
site, but they are not ordered correctly in the exotoxin alone.
CaM binding folds parts of the regulatory domain in such a
way that these crucial amino acids are put together to build
the binding/active site of the active protein.
The purpose of this study was to attempt to observe such
large conformational changes in AC, which might explain
its activation by CaM. In the absence of any 3D structure of
either AC or AC–CaM, we have used fluorescence spectro-
scopy with several specific labels distributed in different
regions of the protein, to explore the structural and dynamic
perturbations induced by CaM binding to AC.
Biochemical studies of AC led to the proposal of a model
in which it exists as an ÔopenÕ inactive structure in the
absence of CaM and as a ÔclosedÕ active structure in its
presence. In the inactive structure, the active site would not
be completely shaped. An observation supporting this
model was the large increase in the affinity of the AC–CaM
complex for Ant-dATP compared with AC alone (this work
and [22]), a property shared by the B. anthracis exotoxin
[22,47,48]. Another observation in support of this model is
the fact that the catalytic and regulatory domains could be
split by trypsin cleavage at Arg224 in the absence of CaM,
and re-associated by CaM [13], leading to a fully active
protein, a property not shared by the B. anthracis exotoxin.
This suggests that the two AC domains (catalytic and
CaM-binding domains) are linked by a flexible amino-
acid sequence. Activation would occur by folding of this
sequence, which in turn would bring together in the correct
3D arrangement the important amino acids for catalysis,
which are located along the AC sequence in the catalytic
subdomain, in the central region and in the C-terminal
segment, thereby forming the active site.
Several structural and dynamic consequences can be
suggested in the frame of this model of activation that can
be tested by time-resolved fluorescence studies. If the ATP-
binding site were not shaped in the uncomplexed AC, the
mobility of Ant-dATP and its accessibility to the solvent
would probably be higher in AC than in AC–CaM complex.
Time-resolved measurements have proven very useful in this
respect. Beside the fact that they explained the increase in
Ant-dATP fluorescence intensity by a factor of 4 on binding
to AC–CaM [22], they allowed the signals of the free and
bound probe to be separated, which could not be easily
done in steady-state measurements because the shift in their
emission spectra is not large. Therefore, they allowed their
accessibility to the solvent and their respective rotation
motions to be measured separately.
CaM binding would probably make the flexible amino-
acid sequence between the catalytic and CaM-binding
domains rigid, an effect that can be checked by studying the
dynamics of W242 by fluorescence anisotropy decay
measurements. It may also change the overall shape of the
protein: a more compact complex would be obtained, with
observable consequences on the Brownian rotation motion,
which can be measured by fluorescence anisotropy decay.
With respect to the mobility and solvent accessibility of
Ant-dATP bound to the active site of the protein, it is
remarkable that it remained immobile and shielded from the
solvent in both AC and the AC–CaM complex. The
fluorescence excited-state lifetime of the anthraniloyl ring is
extremely sensitive to changes in its environment, partic-
ularly to the presence of water [24,25,27,49] and from the
absence of changes in this variable, we can conclude that
the local interactions of the fluorescent inhibitor with its
environment in the binding site remain undisturbed in
AC–CaM compared with AC. One very obvious difference
between AC and AC–CaM is the increased ratio of bound/
free Ant-dATP in the latter as detected by the CaM-induced
increase in the relative amplitude of the long lifetime
characteristic of the bound fluorescent nucleotide, caused
by its affinity increase [14,22]. In fact, using this relative
Ó FEBS 2004 CaM-induced conformational transition in AC (Eur. J. Biochem. 271) 829
amplitude, we estimated a K
d
very similar to that reported
previously for AC–CaM. This difference in amplitude also
suggests that a small proportion of AC is competent for
ATP binding in equilibrium with a majority of incompetent
protein. Binding to CaM shifts this equilibrium to the
bioactive competent protein.
The region of the catalytic subdomain, where a single Cys
residue C75 was introduced (instead of a Tyr) in the
conserved sequence A
73
GYIP
77
(AC numbering) in both
B. pertussis and B. anthracis proteins, undergoes some
conformational change on CaM binding. The local mobility
of the acrylodan probe, attached to the C75 residue, remains
slow and weak but the red shift of its fluorescence emission
spectrum shows some increase in local polarity. A small
conformational change was also observed in this region of
the anthrax exotoxin on CaM addition [23].
In contrast with the relatively low sensitivity of the
catalytic subdomain to CaM binding, at least indicated
using the two probes acrylodan and Ant-dATP, the highly
flexible CaM-binding sequence of AC is strongly rigidified
on CaM binding, as shown by fluorescence anisotropy
decays of W242 in the AC–CaM complex compared with
AC. The W242 mobility is almost as large in AC as that
observed for the peptide segment 196–267 [16] and the
rigidifying effect of CaM binding is almost as strong too.
This indicates that this segment in the protein behaves
rather independently from the rest of the molecule. It is
tempting to speculate that it adopts a similar conformation
in AC–CaM to that in the isolated peptide, CaM producing
stabilization of two potential a-helices in this sequence
[13,15,16]. A turn-like geometry has been proposed, bring-
ing the two a-helices closer in a helix–turn–helix motif [21].
Moreover, the complexes of CaM with these peptides
exhibit elongated ellipsoidal shapes, by virtue of their much
larger Brownian rotational correlation times than expected
for hydrated spheres of equivalent mass [16], in contrast
with the complexes of CaM with a-helical peptides derived
from the myosin light chain kinase [50]. In the latter
complexes, the CaM molecule wraps around the peptides,
undergoing a conformational collapse achieved by bending
of the interconnecting helix region and bringing the two
Ca
2+
lobes in close contact [51,52]. An extended confor-
mation of CaM may also prevail in the AC–CaM complex,
as recently observed for the exotoxin from B. anthracis in
solution [53] and confirmed in the 3D structure [23].
This large conformational change in the CaM-binding
sequence may change the hydrodynamic properties of the
AC–CaM with respect to AC. These hydrodynamic prop-
erties of globular proteins can be studied by time-resolved
fluorescence anisotropy decay of either intrinsic or extrinsic
probes [44]. According to Perrin [54], the Brownian
rotational correlation time (h) for a sphere is proportional
to the hydrated volume of the particle (V
h
)andtothe
viscosity/temperature factor (g/T)suchas:
h ¼ V
h
g
RT
Proteins, however, are usually not spherical. When approxi-
mated by ellipsoids of revolution, the fluorescence aniso-
tropy decay can be described by three exponential terms
[44,55], in the absence of internal motion. The time
constants (rotational correlation times h
i
) are related to
the Brownian principal rotational diffusion coefficients of
the ellipsoid, whereas the pre-exponential terms are related
to the relative orientation of the fluorophore transition
moment with respect to the principal axes of the ellipsoid
[55]. Experimentally, however, and in particular because of
the intrinsic Poissonian noise, fluorescence anisotropy decay
measurements are not accurate enough to permit the
separation of these different rotational correlation times,
especially if fast depolarization caused by internal motions
occurs, which is usually the case. The fit of the polarized
decays in most cases shows a single long correlation time,
describing the average tumbling motion of the molecule.
This approximation holds rather well in fact as shown by
the linear relation between the experimental average Brow-
nian correlation time of some 20 proteins, determined in our
laboratory in recent years by fluorescence anisotropy decay
(for most of them obtained with tryptophan) and their
molecular masses (Fig. 10). We compared these data with
the results of calculations of their hydrodynamic properties
performed from their atomic structure (when available)
using the downloadable version of the
HYDROPRO
program
[56–58]. This program models the surface of proteins as
joined beads including the water hydration layer.
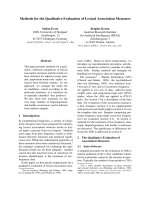
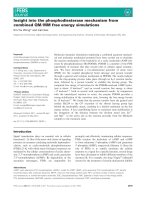
Fig. 10. Variation in the average Brownian rotational correlation time of
proteins as a function of their molecular mass. (d)Valuescalculated
with
HYDROPRO
[57]; (h) values experimentally measured from the
fluorescence anisotropy decays. The peptides or proteins concerned are
(sorted by increasing molecular mass; PDB code in parentheses when
needed): adrenocorticotropic hormone (5–10) d,h; adrenocortico-
tropic hormone-(1–24) d; glucagon (1gcn) h, bovine pancreatic
trypsin inhibitor (4pti) d; black mamba dendrotoxin K (1dtk) d,h;
black mamba dendrotoxin I (1dem) d,h; Aspergillus Orizae ribo-
nuclease T1 (9rnt) d,h; human epidermal growth factor (1jl9) d,h;
bovine ribonuclease A (1rbx) d; porcine pancreatic phospholipase A
2
(1p2p) d,h; FKBP59-I (1rot) d,h; sperm whale myoglobin (1mbo)
d; E. coli CMP kinase (2cmk) d,h; bovine pancreatic chymotrypsi-
nogen A (2cga) d; human recombinant annexin V (anx5) d,h; hen egg
ovalbumin (1ova) d; Mycobacterium tuberculosis thymidine mono-
phosphate kinase (dimeric form, 1g3u) d; pig heart citrate synthase
(1cts) d; human serum albumin (1bmo) d,h; B. anthracis AC–CaM
complex (1k93) d.
830 J. Gallay et al.(Eur. J. Biochem. 271) Ó FEBS 2004
We can see that the two sets of data agree quite
satisfactorily. The agreement is particularly good for small
proteins such as dendrotoxin K, pancreatic phospholipase
A
2
and E. coli cytidine monophosphate kinase, but also for
human serum albumin. A Brownian rotational correlation
time of 1 ns corresponds to a molecular mass of 1.5 and
1.7 kDa for the
HYDROPRO
data and the experimental
anisotropy decay data, respectively.
The average Brownian rotational correlation time for the
AC molecule estimated from Fig. 10 is 23–25 ns, according
to whether the experimental fluorescence anisotropy decay
data or the
HYDROPRO
data are used. This is close to the
value reported by W242 and Ant-dATP but not by
acrylodan. The value measured by W242 is clearly orien-
tation-averaged, owing to its large wobbling-in-cone angle
of rotation (Table 3). For Ant-dATP and acrylodan, this
averaging does not apply as these probes are either
immobilized for the former (Fig. 8) or only slowly mobile
for the latter (Fig. 9C). This suggests that the acrylodan
emission transition moment is oriented close to the long
protein axis, as the anisotropy measures rotational motion
around an axis perpendicular to the emission moment of the
fluorophore [55]. The 35-ns rotational correlation time may
correspond to the long axis rotation; its ratio with the
rotational correlation time of the equivalent rotating sphere
would be 1.45 and the axial ratio calculated from Perrin’s
factor [54] would be 1.9. For the AC–CaM complex, the
expected value of its average Brownian rotation correlation
time would range between 34 and 38 ns according to the
data of Fig. 10. This value corresponds quite well to that
indicated by W242. Acrylodan and especially Ant-dATP
display much larger values, suggesting that the shape of the
complex diverges significantly from spherical. Moreover, its
shape is probably more elongated than AC: if the 60–70 ns
rotational correlation time of AC–CaM measured with
these last two probes corresponded to its long axis rotation,
the rotation correlation time relative to the equivalent
rotating sphere would be 1.81 and the axial ratio calculated
from Perrin’s factor [54] would be 2.4.
We can also compare the hydrodynamic properties of
B. anthracis exotoxin, based on its atomic structure and
using the
HYDROPRO
software, with that of B. pertussis AC
obtained in this study by fluorescence anisotropy decay. The
expected averaged Brownian rotation correlation time for
the exotoxin molecule, which has a molecular mass of
59 kDa, is 38 ns according to data of Fig. 10. The
calculated value obtained by
HYDROPRO
is however,
48.5 ns, which is significantly larger. The protein is clearly
not spherical, as shown by its 3D structure [23]. The axial
ratio obtained by the hydrodynamic calculations is 1.7. For
the complex with CaM, the expected average Brownian
rotation correlation time is 49 ns. The calculated axial ratio
becomes 1.3. This reduction indicates that, in contrast with
the AC to AC–CaM transition, the exotoxin to exotoxin–
CaM transition results in a more compact shape.
Therefore, although the B. pertussis and B. anthracis
toxins exhibit similar features with respect to the activation
by CaM, differences in the CaM-induced conformational
change are likely. This does not permit a direct exploitation
of the structural results of the former to explain the
mechanism of CaM activation of the latter. Crystallization
and resolution of the 3D structures of AC and AC–CaM,
which are still not available, and labeling of the AC protein at
other locations in its regulatory and catalytic domains using
single-cysteine mutants are under current investigation.
Acknowledgements
The technical staff of LURE is acknowledged for running the
synchrotron machine during the beam sessions. I. M. L. S. acknow-
ledges financial support from the laboratory during the course of this
work. M. V. acknowledges the Institut National de la Sante
´
et de la
Recherche Me
´
dicale for its financial support. H. M L., H. S., O. B. and
A M. G. received grants from the Institut Pasteur, the Institut
National de la Sante
´
et de la Recherche Me
´
dicale and the Centre
National de la Recherche Scientifique (URA 2185). We thank M.
Goldberg for the ultracentrifugation experiments, E. Krin for the gift of
plasmid pDIA5311, and Dr C. Condon for improving the English.
References
1. Weiss, A.A. & Hewlett, E.L. (1986) Virulence factors of Bordetella
pertussis. Annu. Rev. Microbiol. 40, 661–686.
2. Mock, M. & Ullmann, A. (1993) Calmodulin-activated bacterial
adenylate cyclases as virulence factors. Trends Microbiol. 5,
187–192.
3. Confer, D.L. & Eaton, J.W. (1982) Phagocyte impotence caused
by an invasive bacterial adenylate cyclase. Science 217, 948–950.
4. Wolff, J., Cook, G.H., Goldhammer, A.R. & Berkowitz, S.A.
(1980) Calmodulin activates prokaryotic adenylate cyclase. Proc.
NatlAcad.Sci.USA77, 3841–3844.
5. Glaser, P., Sakamoto, H., Bellalou, J., Ullmann, A. & Danchin, A.
(1988) Secretion of cyclolysin, the calmodulin-sensitive adenylate
cyclase-haemolysin bifunctional protein of Bordetella pertussis.
EMBO J. 7, 3997–4004.
6.Glaser,P.,Ladant,D.,Sezer,O.,Pichot,F.,Ullmann,A.&
Danchin, A. (1988) The calmodulin-sensitive adenylate cyclase of
Bordetella pertussis: cloning and expression in Escherichia coli.
Mol. Microbiol. 2, 19–30.
7. Glaser,P.,Danchin,A.,Ladant,D.,Barzu,O.&Ullmann,A.
(1988) Bordetella pertussis adenylate cyclase: the gene and the
protein. TokaiJ.Exp.Clin.Med.13 (Suppl.), 239–252.
8. Ladant, D., Brezin, C., Alonso, J.M., Crenon, I. & Guiso, N.
(1986) Bordetella pertussis adenylate cyclase. Purification, char-
acterization, and radioimmunoassay. J. Biol. Chem. 261, 16264–
16269.
9. Ladant, D., Michelson, S., Sarfati, R., Gilles, A.M., Predeleanu,
R. & Baˆ rzu, O. (1989) Characterization of the calmodulin-binding
and of the catalytic domains of Bordetella pertussis adenylate
cyclase. J. Biol. Chem. 264, 4015–4020.
10. Haiech, J., Predeleanu, R., Watterson, D.M., Ladant, D., Bella-
lou,J.,Ullmann,A.&Baˆ rzu, O. (1988) Affinity-based chroma-
tography utilizing genetically engineered proteins. Interaction of
Bordetella pertussis adenylate cyclase with calmodulin. J. Biol.
Chem. 263, 4259–4262.
11. Baˆ rzu, O. & Danchin, A. (1994) Adenylyl cyclases: a hetero-
geneous class of ATP-utilizing enzymes. Prog. Nucleic Acid Res.
Mol. Biol. 49, 241–283.
12. Ladant, D. (1988) Interaction of Bordetella pertussis adenylate
cyclase with calmodulin. Identification of two separated calmo-
dulin-binding domains. J. Biol. Chem. 263, 2612–2618.
13. Munier, H., Gilles, A.M., Glaser, P., Krin, E., Danchin, A.,
Sarfati, R. & Barzu, O. (1991) Isolation and characterization of
catalytic and calmodulin-binding domains of Bordetella pertussis
adenylate cyclase. Eur. J. Biochem. 196, 469–474.
14. Glaser, P., Munier, H., Gilles, A.M., Krin, E., Porumb, T., Baˆ rzu,
O., Sarfati, R., Pellecuer, C. & Danchin, A. (1991) Functional
Ó FEBS 2004 CaM-induced conformational transition in AC (Eur. J. Biochem. 271) 831
consequences of single amino acid substitutions in calmodulin-
activated adenylate cyclase of Bordetella pertussis. EMBO J. 10,
1683–1688.
15. Craescu, C.T., Bouhss, A., Mispelter, J., Diesis, E., Popescu, A.,
Chiriac, M. & Baˆ rzu, O. (1995) Calmodulin binding of a peptide
derived from the regulatory domain of Bordetella pertussis ade-
nylate cyclase. J. Biol. Chem. 270, 7088–7096.
16. Bouhss, A., Vincent, M., Munier, H., Gilles, A.M., Takahashi,
M., Baˆ rzu, O., Danchin, A. & Gallay, J. (1996) Conformational
transitions within the calmodulin-binding site of Bordetella per-
tussis adenylate cyclase studied by time-resolved fluorescence of
Trp242 and circular dichroism. Eur. J. Biochem. 237, 619–628.
17. Glaser, P., Elmaoglou-Lazaridou, A., Krin, E., Ladant, D., Baˆ rzu,
O. & Danchin, A. (1989) Identification of residues essential for
catalysis and binding of calmodulin in Bordetella pertussis ade-
nylate cyclase by site-directed mutagenesis. EMBO J. 8, 967–972.
18. Gilles, A.M., Munier, H., Rose, T., Glaser, P., Krin, E., Danchin,
A.,Pellecuer,C.&Baˆ rzu, O. (1990) Intrinsic fluorescence of a
truncated Bordetella pertussis adenylate cyclase expressed in
Escherichia coli. Biochemistry 29, 8126–8130.
19. Precheur, B., Siffert, O., Barzu, O. & Craescu, C.T. (1991) NMR
and circular dichroic studies on the solution conformation of a
synthetic peptide derived from the calmodulin-binding domain of
Bordetella pertussis adenylate cyclase. Eur. J. Biochem. 196, 67–72.
20. Bouhss, A., Krin, E., Munier, H., Gilles, A.M., Danchin, A.,
Glaser,P.&Baˆ rzu, O. (1993) Cooperative phenomena in binding
and activation of Bordetella pertussis adenylate cyclase by cal-
modulin. J. Biol. Chem. 268, 1690–1694.
21. Munier, H., Bouhss, A., Gilles, A.M., Palibroda, N., Baˆ rzu, O.,
Mispelter, J. & Craescu, C.T. (1995) Structural characterization
by nuclear magnetic resonance spectroscopy of a genetically
engineered high-affinity calmodulin-binding peptide derived from
Bordetella pertussis adenylate cyclase. Arch. Biochem. Biophys.
320, 224–235.
22. Sarfati, R.S., Kansal, V.K., Munier, H., Glaser, P., Gilles, A.M.,
Labruye
`
re, E., Mock, M., Danchin, A. & Baˆ rzu, O. (1990)
Binding of 3¢-anthraniloyl-2¢-deoxy-ATP to calmodulin-activated
adenylate cyclase from Bordetella pertussis and Bacillus anthracis.
J. Biol. Chem. 265, 18902–18906.
23. Drum,C.L.,Yan,S Z.,Bard,J.,Shen,Y Q.,Lu,D.,Soelalman,
S., Grabarek, Z., Bohm, A. & Tang, W J. (2002) Structural basis
for the activation of anthrax adenylyl cyclase exotoxin by cal-
modulin. Nature (London) 415, 396–402.
24. Hiratsuka, T. (1982) New fluorescent analogs of cAMP and
cGMP available as substrates for cyclic nucleotide phosphodiest-
erase. J. Biol. Chem. 257, 13354–13358.
25. Jameson, D. & Eccleston, J.F. (1997) Fluorescent nucleotide
analogs: synthesis and applications. Methods Enzymol. 278, 363–
390.
26. Hazlett, T.L., Moore, K.J.M., Lowe, P.N., Jameson, D. &
Eccleston, J.F. (1993) Solution dynamics of p21ras proteins bound
with fluorescent nucleotides: a time-resolved fluorescence study.
Biochemistry 32, 13575–13583.
27. Li de la Sierra, I., Gallay, J., Vincent, M., Briozzo, P., Baˆ rzu, O. &
Gilles, A.M. (2000) Substrate-induced fit of the ATP binding site
of cytidine monophosphate kinase from E. coli: time-resolved
fluorescence of 3¢-anthraniloyl-2¢-deoxy-adenosine-diphosphate
and molecular modeling. Biochemistry 39, 15870–15878.
28. Prendergast, F.G., Meyer, M., Carlson, G.L., Iida, S. & Potter,
J.D. (1983) Synthesis, spectral properties, and use of 6-acryloyl-2-
dimethylaminonaphthalene (Acrylodan). A thiol-selective, polar-
ity-sensitive fluorescent probe. J. Biol. Chem. 258, 7541–7544.
29. Lehrer, S.S. & Ishii, Y. (1988) Fluorescence properties of acrylo-
dan-labeled tropomyosin and tropomyosin-actin: evidence for
myosin subfragment 1 induced changes in geometry between
tropomyosin and actin. Biochemistry 27, 5899–5906.
30. Danchin, A., Sezer, O., Glaser, P., Chalon, P. & Caput, D. (1989)
Cloning and expression of mouse-brain calmodulin as an activator
of Bordetella pertussis adenylate cyclase in Escherichia coli. Gene
80, 145–149.
31. Vincent, M., Gallay, J. & Demchenko, A.D. (1995) Solvent
relaxation around the excited state of indole: analysis of fluores-
cence lifetime distributions and time-dependent spectral shifts.
J. Phys. Chem. 99, 14931–14941.
32. Livesey, A.K. & Brochon, J C. (1987) Analyzing the distribution
of decay constants in pulse-fluorimetry using the maximum
entropy method. Biophys. J. 52, 693–706.
33. Brochon, J C. (1994) Maximum entropy method of data analysis
in time-resolved spectroscopy. Methods Enzymol. 240, 262–311.
34. Vincent, M. & Gallay, J. (1991) The interactions of horse heart
apocytochrome c with phospholipid vesicles and surfactant
micelles: time-resolved fluorescence study of the single tryptophan
residue (Trp-59). Eur. Biophys. J. 20, 183–191.
35. Bradford, M.M. (1976) A rapid and sensitive method for the
quantification of microgram quantities of protein utilizing the
principle of protein-dye binding. Anal. Biochem. 72, 248–254.
36. Laemmli, U.K. (1970) Cleavage of structural proteins during the
assembly of the head of bacteriophage T4. Nature (London) 227,
680–685.
37. Bollag, D.M. & Edelstein, S.J. (1991) Protein Methods. pp. 143–
160. John Wiley & Sons Inc, New York.
38. Johnson, D.A. & Yguerabide, J. (1985) Solute accessibility to
N epsilon-fluorescein isothiocyanate-lysine-23 cobra alpha-toxin
bound to the acetylcholine receptor. A consideration of the effect
of rotational diffusion and orientation constraints on fluorescence
quenching. Biophys. J. 48, 949–955.
39. Ludescher, R.D., Peting, L., Hudson, S. & Hudson, B. (1987)
Time-resolved fluorescence anisotropy for systems with lifetime
and dynamic heterogeneity. Biophys. Chem. 28, 59–75.
40. Ruggiero, A. & Hudson, B. (1989) Analysis of the anisotropy
decay of trans-parinaric acid in lipid bilayers. Biophys. J. 55, 1125–
1135.
41. Thompson, E.H., van Bailey, M.F., van der Schans, E.J., Joyce,
C.M. & Millar, D.P. (2002) Determinants of DNA mismatch
recognition within the polymerase domain of the Klenow frag-
ment. Biochemistry 41, 713–722.
42. Bailey, M.F., Thompson, E.H. & Millar, D.P. (2001) Probing
DNA polymerase fidelity mechanisms using time-resolved fluor-
escence anisotropy. Methods 25, 62–77.
43. Valeur, B. & Weber, G. (1977) Resolution of the fluorescence
excitation spectrum of indole into the
1
L
a
and
1
L
b
excitation
bands. Photochem. Photobiol. 25, 441–444.
44. Wahl, P. (1983) Fluorescence anisotropy decay and Brownian
rotational motion: theory and applications in biological systems.
Time-Resolved Fluorescence Spectroscopy in Biochemistry and
Biology (Cundall, R.B. & Dale, R.E., eds), pp. 497–521. Plenum
Press, New York.
45. Colbran, R.J. & Soderling, T.R. (1990) Calcium/calmodulin-
dependent protein kinase II. Curr. Top. Cell. Reg. 31, 181–221.
46. Jarrett, H.W. & Madhavan, R. (1991) Calmodulin-binding pro-
teins also have a calmodulin-like binding site within their struc-
ture. The flip-flop model. J. Biol. Chem. 266, 362–371.
47. Labruyere,E.,Mock,M.,Ladant,D.,Michelson,S.,Gilles,A.M.,
Laoide, B. & Barzu, O. (1990) Characterization of ATP and cal-
modulin-binding properties of a truncated form of Bacillus
anthracis adenylate cyclase. Biochemistry 29, 4922–4928.
48. Labruyere, E., Mock, M., Surewicz, W.K., Mantsch, H.H.,
Rose, T., Munier, H., Sarfati, R.S. & Barzu, O. (1991) Struc-
tural and ligand-binding properties of a truncated form of Bacillus
anthracis adenylate cyclase and of a catalytically inactive variant
in which glutamine substitutes for lysine-346. Biochemistry 30,
2619–2624.
832 J. Gallay et al.(Eur. J. Biochem. 271) Ó FEBS 2004
49. Mocz,G.,Helms,M.K.,Jameson,D.M.&Gibbons,I.R.(1998)
Probing the nucleotide binding sites of axonemal dynein with the
fluorescent nucleotide analogue 2¢(3¢)-O-(-N-methylanthraniloyl)-
adenosine-5¢-triphosphate. Biochemistry 37, 9862–6869.
50. Ikura, M., Clore, G.M., Gronenborn, A.M., Zhu, G., Klee, C.B.
& Bax, A. (1992) Solution structure of a calmodulin-target peptide
complex by multidimensional NMR. Science 256, 632–638.
51. Meador, W.E., Means, A.R. & Quiocho, F.A. (1992) Target
enzyme recognition by calmodulin: 2.4 A
˚
structure of a calmo-
dulin–peptide complex. Science 257, 1251–1255.
52. Clore, G.M., Bax, A., Ikura, M. & Gronenborn, A. (1993)
Structure of calmodulin–target peptide complexes. Curr. Opin.
Struct. Biol. 3, 838–845.
53. Drum,C.L.,Yan,S.Z.,Sarac,R.,Mabuchi,Y.,Beckingham,K.,
Bohm, A., Grabarek, Z. & Tang, W.J. (2000) An extended con-
formation of calmodulin induces interactions between the struc-
tural domains of adenylyl cyclase from Bacillus anthracis to
promote catalysis. J. Biol. Chem. 275, 36334–36340.
54. Perrin, F. (1936) Mouvement brownien d’un ellipsoide (II).
Rotation libre et de
´
polarisation des fluorescences. Translation et
diffusion de mole
´
cules e
´
llipsoidales. J. Phys. et le Radium 7, 1–11.
55. Weber, G. (1971) Theory of fluorescence depolarization by
anisotropic Brownian rotations. Discontinuous distribution
approach. J. Chem. Phys. 55, 2399–2407.
56. Carrasco, B. & Garcia de la Torre, J. (1999) Hydrodynamic
properties of rigid particles: comparison of different modeling and
computational procedures. Biophys. J. 76, 3044–3057.
57. Garcia De La Torre, J., Huertas, M.L. & Carrasco, B. (2000)
Calculation of hydrodynamic properties of globular proteins from
their atomic-level structure. Biophys. J. 78, 719–730.
58. Ferrer, M.L., Duchowicz, R., Carrasco, B., de la Torre, J.G. &
Acuna, A.U. (2001) The conformation of serum albumin in
solution: a combined phosphorescence depolarization-hydro-
dynamic modeling study. Biophys. J. 80, 2422–2430.
59. Kinosita, K.J., Kawato, S. & Ikegami, A. (1977) A theory of
fluorescence polarization decay in membranes. Biophys. J. 20,
289–305.
60. Wahl, P. (1979) Analysis of fluorescence anisotropy decays by a
least-square method. Biophys. Chem. 10, 91–104.
Ó FEBS 2004 CaM-induced conformational transition in AC (Eur. J. Biochem. 271) 833