Báo cáo khoa học: Ligand-specific dose–response of heterologously expressed olfactory receptors potx
Bạn đang xem bản rút gọn của tài liệu. Xem và tải ngay bản đầy đủ của tài liệu tại đây (311.18 KB, 8 trang )
Ligand-specific dose–response of heterologously expressed
olfactory receptors
Gre
´
goire Levasseur
1
, Marie-Annick Persuy
1
, Denise Grebert
1
, Jean-Jacques Remy
2
, Roland Salesse
1
and Edith Pajot-Augy
1
1
INRA-Biotechnologies, Neurobiologie de l’Olfaction et de la Prise Alimentaire, Re
´
cepteurs et Communication Chimique,
Jouy-en-Josas, France;
2
Unite
´
Neurogene
`
se et Morphogene
`
se au cours du De
´
veloppement et chez l’Adulte, UMR CNRS 6545,
Institut de Biologie du De
´
veloppement de Marseille, Parc scientifique de Luminy, Marseille, France
Primary olfactory neuronal cultures exposed to odorant
stimulation have previously exhibited concentration-related
effects in terms of intracellular cAMP levels and adenylate
cyclase activity [Ronnett, G.V., Parfitt, D.J., Hester, L.D. &
Snyder, S.H. (1991) PNAS 88, 2366–2369]. Maximal sti-
mulation occurred for intermediate concentrations, whereas
AC activity declined for both low and high odorant con-
centrations. We suspected that this behavior might be
ascribed to the intrinsic response of the first molecular
species concerned by odorant detection, i.e. the olfactory
receptor itself. In order to check this hypothesis, we deve-
loped an heterologous expression system in mammalian cells
to characterize the functional response of receptors to
odorants. Two mammalian olfactory receptors were used to
initiate the study, the rat I7 olfactory receptor and the
human OR17-40 olfactory receptor. The cellular response of
transfected cells to an odorant stimulation was tested by a
spectrofluorimetric intracellular calcium assay, and proved
in all cases to be dose-dependent for the known ligands of
these receptors, with an optimal response for intermediate
concentrations. Further experiments were carried out with
the rat I7 olfactory receptor, for which the sensitivity to an
odorant, indicated by the concentration yielding the optimal
calcium response, depended on the carbon chain length of
the aldehydic odorant. The response is thus both ligand-
specific and dose-dependent. We thus demonstrate that a
differential dose–response originates from the olfactory
receptor itself, which is thus capable of efficient discrimin-
ation between closely related agonists.
Keywords:olfactoryreceptors;olfactorycoding;olfactory
discrimination; odorants; intracellular calcium.
Olfactory receptors (ORs) belong to the large family of
G-protein coupled receptors (GPCRs) characterized by
their seven transmembrane spanning domains. Investigation
of olfactory receptors/odorant interactions is crucial to
understand the molecular basis of olfactory coding. For this
purpose, olfactory receptor genes have been heterologously
expressed in various surrogate cells [1–4], in cell lines with a
neuronal phenotype [5], or derived from the olfactory
epithelium [5–7], or even directly in olfactory epithelium
[8,9]. Individual olfactory sensory neurons have also been
tested for their responsiveness to odorant stimulation [10–
15]. So far, due to the large number of potential ligands and
the lack of a suitable screening system, only a few OR–
odorant couples have been identified. The rat I7 receptor
[16] was the first mammalian olfactory receptor for which a
preferential ligand (octanal) was identified [8]. As such, it
has been the subject of subsequent investigations [3,9],
involving an impressive range of odorants and reporting a
number of stimulating odorants. This raises the possibility
that the receptor itself is capable of some olfactory
discrimination, as suggested by the response of individual
olfactory neurons to a few odorants at given concentrations
[12,13], and that this is not only performed in higher
olfactory centers (i.e. olfactory bulb). OR17-40 was the first
characterized human olfactory receptor, for which helional
represented the most effective odorant ligand [6]. An
heterologous expression system in a mammalian host cell
line was thus developed, using the full-length cDNA
sequence instead of chimeric constructions. We report a
functional expression of the rat I7 olfactory receptor in
stably transfected COS cells, and of the human OR17-40
olfactory receptor in stably transfected ODORA cells tested
by a spectrofluorimetric intracellular calcium assay. Both
COS-I7 cells and ODORA OR17-40 cells exhibit a dose-
dependent response to their ligands with optimal concen-
trations in a subpico- to subnano-molar range. Moreover,
COS-I7 cells responded differentially to odorants of the
same family of aldehydes but with varying carbon chain
length, in terms of concentration providing the optimal
response. Thus, olfactory receptors themselves can not only
efficiently discriminate broad families of odorants, but they
are also able to differentiate close odorants of a given
family.
Correspondence to E. Pajot-Augy, INRA-Biotechnologies, Neuro-
biologie de l’Olfaction et de la Prise Alimentaire, Re
´
cepteurs et
Communication Chimique, 78352 Jouy-en-Josas Cedex, France.
Fax: + 33 1 34 65 22 41, Tel.: + 33 1 34 65 25 63,
E-mail:
Abbreviations: OR, olfactory receptor; GPCR, G-protein coupled
receptor; COS, Cercopithecus aethiops SV40 transformed;
PLC, phospholipase C; NaCl/P
i
, phosphate buffer saline;
HEK, human embryonic kidney; FBS, fetal bovine serum.
(Received 17 February 2003, revised 18 April 2003,
accepted 15 May 2003)
Eur. J. Biochem. 270, 2905–2912 (2003) Ó FEBS 2003 doi:10.1046/j.1432-1033.2003.03672.x
Materials and methods
Constructs
The I7 full-length sequence was amplified by PCR from
genomic rat DNA with cloned Pfu DNA polymerase
(Stratagene) and inserted in a pGEM-T vector (Promega)
for subcloning and control sequencing (Genome Express).
I7 was inserted in the pCMV-Tag3 expression vector
(Stratagene), in frame with the translationalstarting sequence
(10-base Kozak consensus sequence) and the 10 amino acids
long tag from the human c-myc gene of this vector, using sites
PstIandKpnI of the MCS. Similarly, OR17-40 full-length
sequence was cloned into a pGEM-T vector, then inserted in
the pCMV-Tag3 expression vector using sites BamHI and
XhoI of the MCS. Therefore, the c-myc epitope is located at
the 5¢-terminus of olfactory receptor sequences.
Cell lines and transfection
COS-7 cells (Cercopithecus aethiops kidney cells transformed
by an origin-defective mutant of SV-40) were grown in Dul-
becco’s Modified Eagle’s Medium containing 10% decom-
plemented foetal bovine serum in a 5% (v/v) CO
2
atmosphere
at 37 °C, and transfected at a 50% confluence using
ExGen 500 from Euromedex in six-well dishes. Geneticin
(G418) was used at a final concentration of 0.5 mgÆmL
)1
to
select stable clones. Culture media, G418 and trypsin-EDTA
were from Gibco BRL, fetal bovine serum(FBS)fromPerbio.
ODORA cells [17] consist of a conditionally immortalized
cell line derived from the olfactory sensory neuron lineage,
obtained from rat olfactory epithelium. They were grown at
33 °C in the same medium as COS cells. Transfection, and
selection of stable clones, were performed similarly.
Human embryonic kidney (HEK) 293 cells were grown
and transfected in the same conditions as COS cells.
For further experiments, transfected cells were used 24 h
after transfection.
RT-PCR on extracted RNA
RNAs from established stable clones were prepared from 10
7
cells following the modified procedure of Chomczynski [18]
proposed by Puissant and Houdebine [19]. RT-PCR was
performed on DNase-treated RNA samples (RQ1 DNase,
RNase-free from Promega). First-strand synthesis was
achieved with Gibco BRL SuperScript kit using oligo(dT)
12)18
as the primer. Specific primers were designed with I7 or OR17-
40 sequences and used to specifically amplify the target cDNA
by PCR on the first strand: 5-ATggAgCAgAAACTC
ATCTCTgAA-3¢ and 5¢-TTCTgCAgCTAACCAATTTTg
CTgCCTTTgTT-3¢ for I7, 5-CgggATCCATgCAgCCA
gAATCTggggCC-3¢ and 5¢-CCgCTCgAgTCAAgCCAg
TgACCgCCTCCC-3¢ for OR17-40.
Each PCR consisted of 40 cycles: 94 °C/60 °C/72 °Cwith
1 min steps, with a final elongation of 10 min at 72 °C. PCR
products were sequenced (Genome Express).
Immunofluorescence microscopy
Cells were cultured on glass slides, coated with either FBS
or 0.01% poly
L
-Lysine. They were washed with NaCl/P
i
(Na
2
HPO
4
8m
M
,KH
2
PO
4
1.5 m
M
, NaCl 150 m
M
,KCl
3m
M
)for4· 5 min. Fixation was performed with 2.5%
paraformaldehyde in NaCl/P
i
for 20 min at room tempera-
ture. Cells werewashed again with NaCl/P
i
for 4 · 5min.No
permeabilization was performed. Preincubation was carried
out for 1 h at room temperature in NaCl/P
i
+2%BSA
(Sigma). A mouse monoclonal anti-(c-myc Ig) (Roche) was
used in combination with a FITC-coupled secondary anti-
body (Jackson Immunoresearch Laboratories). The primary
antibody was diluted at 1/800 from the 1 mgÆmL
)1
stock
solution and incubated for 18 h at 4 °CinNaCl/P
i
incuba-
tion buffer. Cellswere washed four times in NaCl/P
i
+0.2%
BSA, then incubated for 1 h at room temperature in the
dark witha 1/800 dilutionof FITC-coupled goatanti-(mouse
IgG). Cells werewashed four times in NaCl/P
i
+0.2%BSA.
After a final NaCl/P
i
rinsing, slides were mounted with
Vectashield (Vector), and kept at 4 °C in the dark. They were
examined under a fluorescent microscope (Leica DMRB)
equipped with the appropriate filter for fluorescein, or on a
Carl Zeiss LSM 310 confocal laser scanning microscope at
488 nm excitation using helium-neon ion laser, and optimal
depth resolution. It was checked with another membrane
receptor with the same c-myc tag at its N-terminus, expressed
in the same type of cells, that this procedure indeed
induces only a membrane-located fluorescence (data not
shown, prolactin receptor expression vector by courtesy of
I. Gourdou-Jacovella, NOPA, INRA Jouy-en-Josas).
Odorants
Octanal, heptanal, nonanal, octanol and octanoic acid were
from Sigma-Aldrich. Helional, lyral and lilial were free gifts
from Roche. Stock solutions (10
)1
M
) were prepared each
day in dimethylsulfoxide, and 10
)4
M
dilutions in water
were made extemporaneously, directly from the 10
)1
M
stock solution. EtOH was used instead of dimethylsulfoxide
for lyral and lilial, with further extemporaneous dilutions
starting from 10
)3
M
dilutions in water. Further dilutions
were prepared extemporaneously by successive 1 : 10 dilu-
tions in water. Diacetyl (Sigma-Aldrich) solutions were
prepared directly in water.
Spectrofluorimetric intracellular calcium assay
Stable cells were seeded at about 200 cellsÆmm
)2
on glass
coverslips of adequate size coated previously with either
FBS or 0.01% poly(
L
-lysine), grown until a uniform layer of
subconfluent cells was obtained, and placed in a 1% FBS
medium 24 h before experiments. Cells to be transfected
were seeded at about 100 cellsÆmm
)2
on glass coverslips
previously coated with either FBS or 0.01% poly(
L
-lysine),
grown for 24 h, transfected as described above, and used
24 h later. Prior to the assay, cells were washed in a Hank’s
Hepes buffer, pH 7.4 (137 m
M
NaCl, 5.4 m
M
KCl,
0.441 m
M
KH
2
PO
4
,0.16m
M
NaH
2
PO
4
,0.885m
M
MgCl
2
,
5.55 m
M
glucose, 1.25 m
M
CaCl
2
,25m
M
Hepes; buffer A).
They were then loaded with 1 l
M
fluorescent marker fura-2-
acetoxy-methyl [20] (Molecular Probes) for 30 min in the
dark at room temperature, and washed three times in
buffer A. Fura-2-acetoxy-methyl is an EGTA-derived cal-
cium chelator that enters the cells and is transformed in
Fura-2 by nonspecific esterases. Coverslips were introduced
2906 G. Levasseur et al. (Eur. J. Biochem. 270) Ó FEBS 2003
in an adapted cuvette, with excitation and emission beams
at 45 ° relative to the surface.
Experiments were performed on a Hitachi F-2500 spec-
trofluorimeter using a double wavelength excitation
(k1 ¼ 340 nm, k2 ¼ 380 nm, excitation slits at 10 nm).
Emission intensities F(k1) (calcium-chelating Fura-2) and
F(k2) (nonchelating Fura-2) were monitored at 510 nm for
10 min (emission slit at 10 nm). Each measurement was
calibrated by final injection of 25 l
M
digitonin (Sigma) to
obtain the maximum of calcium-chelating Fura-2 [providing
F
max
(k1) and F
min
(k2)], followed by an injection of EGTA
4m
M
Tris 30 m
M
, pH 8, to reach the minimum non-
chelating Fura-2 [providing F
min
(k1) and F
max
(k2)].
The intracellular calcium concentration is provided by the
spectrofluorimeter using: [Ca
2+
]
i
(nM) ¼ K · (R ) R
min
)/
(R
max
) R)where,R
min
¼ [F
min
(k1) ) Z1]/[F
min
(k2) ) Z2]
and R
max
¼ [F
max
(k1) ) Z1)/[F
max
(k2) – Z2] and
R ¼ [F(k1) ) Z1)/F(k2) – Z2] and K ¼ K
d
· F
0
/F
s
,where
K
d
is Fura-2 dissociation constant (224 n
M
), F
0
is the 510 nm
emission signal (380 nm excitation) in the absence of
calcium, and F
s
is the 510 nm emission signal (380 nm
excitation) with a saturating concentration of calcium. Z1
and Z2 are the intrinsic fluorescence intensities of the sample
excited at k1andk2.
Odorant stimulation was performed by injection of a
30-lL volume of a given dilution of the odorant in the
spectrofluorimeter cuvette containing 3 mL buffer A, indu-
cing a further odorant dilution of 1/100. A magnetic stirrer
ensures efficient homogenization of odorant in the medium
in less than 2 s. As there is no buffer aspiration and thus no
rinsing of the odorant, a new coverslip must be used for each
odorant stimulation and for each concentration. Measure-
ments were performed several times at each concentration
and for each odorant. Experiments with solvents at the
same dilution used in odorant samples were also performed
under the same conditions with new coverslips. Data plots
mention first quartile, median (second quartile) and third
quartile of all significant data. In the case of a single
odorant, all data points are also plotted as a scatter chart.
Results
Clonal transfected cell lines
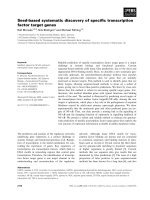
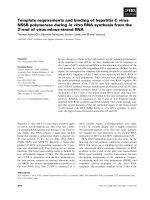
The presence of I7 mRNA in COS-I7 cells and of OR17-40
mRNA in ODORA OR17-40 cells was tested by RT-PCR
in the stable clones, after a DNase treatment to eliminate a
potential genomic DNA contamination. The expected bands
(980 bp for I7 and 950 bp for OR17-40) were detected on
agarose–ethidium bromide gels for COS-I7 cells and
ODORA OR17-40 cells, respectively (Fig. 1, lanes 2 and
4). Negative controls were obtained by RT-PCR performed
on mRNAs from untransfected cells (Fig. 1, lanes 1 and 3),
and by PCR on nonretro-transcripted mRNAs (not shown).
Sequencing the PCR product confirmed that the RT-PCR
products indeed had the expected OR sequences.
Fluorescence microscopy
In order to visualize the recombinant expression of I7
and OR17-40 olfactory receptors, we performed immuno-
fluorescence microscopy on nonpermeabilized COS-I7 and
ODORA OR17-40 stable clonal cell lines, using an anti-
(c-myc Ig) and a fluorescein isothiocyanate (FITC)-coupled
secondary antibody. Stable COS-I7 cells never exhibited any
detectable labeling, nor did stable ODORA OR17-40 cells.
Detection was thus attempted on various types of cells
transiently transfected with I7 or OR17-40 expression
vectors. Observations were performed with a confocal
microscope. COS cells transiently transfected with I7 showed
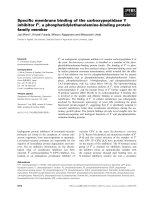
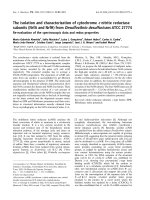
no specific labeling either. In the case of OR17-40, positive
labeling was observed in a number of transiently transfected
cell lines (Fig. 2). About 1% of OR17-40 transiently trans-
fected COS cells showed a positive labeling (Fig. 2A). A
cortical localization is particularly visible in HEK293 OR17-
40 cells, in which about 10% of the cells exhibited this pattern
(Fig. 2B). As for OR17-40 transiently transfected ODORA
cells, only1& of thecells yieldeda discretepunctuate labeling
at the level of the plasmic membrane (Fig. 2C).
Intracellular calcium assay
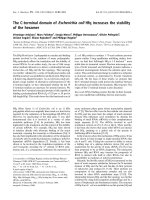
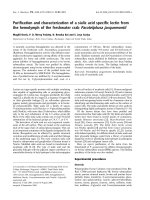
Characteristics of the calcium response to odorant
stimulation. Figure 3 shows representative curves obtained
during spectrofluorimetric intracellular calcium assays on
COS-I7 cells from a stable clone, each with a single odorant
stimulation performed, respectively, at heptanal 10
)13
M
,
octanal 10
)10
M
and nonanal 10
)12
M
(final concentrations),
and on a ODORA OR17-40 stable clone stimulated with
helional 10
)12
M
(final concentration). The response of the
cells consists of a transient peak of intracellular calcium
concentration, with a maximum reached about 10 s after
injection, and prompt return to the baseline. The late broad
increase results from the calibration procedure.
Specificity and dose-dependence of the calcium response:
I7 response from COS-I7 cells. Specificity of olfactory
receptors responses to odorant stimulation was investigated
Fig. 1. Detection of rat I7 mRNA in RT-PCR products from cell
strains. Lane 1, native COS 7 cells; lane 2, COS-I7 clone obtained
through stable transfection (see conditions in the text). A 980 bp band
corresponding to the expected sequence size of the PCR product is
detected. Lane 3, native ODORA cells; lane 4, ODORA OR17-40
clone obtained through stable transfection. A 950 bp band corres-
ponding to the expected sequence size of the PCR product is detected.
Size marker is DRIgest III from Amersham.
Ó FEBS 2003 Ligand-specific dose–response of olfactory receptors (Eur. J. Biochem. 270) 2907
on both rat I7 and human OR17-40 receptors. I7 was
expressed in COS cells that represent a widely used,
multipurpose cell factory.
A number of odorants were tested on COS-I7 cells from
the same clone. A series of aliphatic aldehydes (heptanal,
octanal, nonanal), aromatic aldehydes (lyral, lilial) and
odorants with same carbon chain length but a different
chemical function from octanal (octanol and octanoic acid),
and diacetyl were used. We obtained a very specific response
of I7 receptor with the three aliphatic aldehydes, but not
with other odorants (Fig. 4). Solvents at the same dilution
used in odorant samples did not induce any stimulation of
the cells. Negative controls were obtained with native COS
cells, for which no calcium response was ever obtained with
any odorant stimulation (aldehydes, lyral, lilial or diacetyl).
ATP disodium salt (10
)4
M
) was used as positive control.
Fig. 2. Confocal fluorescence microscopy on OR17-40 transiently transfected cells. Immunolabeling was performed with a mouse monoclonal anti-
(c-myc Ig), and a FITC-coupled secondary antibody. A, COS cells; B, HEK293 cells; C, ODORA cells.
2908 G. Levasseur et al. (Eur. J. Biochem. 270) Ó FEBS 2003
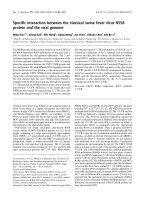
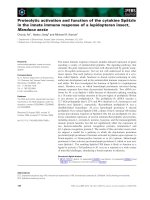
The different COS-I7 clones gave comparable responses
to odorant stimulations. In a given clone, plotting [Ca
2+
]
i
increase in response to various concentrations of heptanal
yields a narrow bell-shaped curve, with a maximum for a
10
)13
M
concentration of heptanal (Fig. 4), and no response
for higher concentrations.
Specificity and dose-dependence of the calcium response:
OR17-40 response from ODORA OR17-40 cells. In an
effort to reproduce more closely natural conditions, OR17-
40 was expressed in ODORA cells that are more
representative of the native tissue expressing olfactory
receptors. Stable ODORA OR17-40 cells were submitted
to helional or other odorant stimulation. Only helional
induced a response from the cells. No response was obtained
with solvents used at the same dilution as in odorant samples.
Native ODORA cells never exhibited any response to any
odorant stimulation tested. Again, the dose–response profile
to helional stimulation is a narrow bell-shaped curve, with a
maximum for 10
)11
M
helional, almost no response for
10
)10
M
and above, few responses for 10
)12
M
helional, and
no response for lower concentrations (Fig. 5).
In addition, stimulation experiments were attempted on
ODORA, COS and HEK cells transiently transfected with
OR17-40 expression vector, as immunodetection was able
to reveal various levels of receptor expression at the
membrane in those cells. Although the same global response
pattern was observed as in ODORA OR17-40 stable cells
(not shown), both response level and reproducibility were
too low to allow accurate data processing in any of those
transiently transfected cells.
Differential dose–response to a family of linear aldehydes
for I7. In the case of I7, the response of the receptor to a
family of linear aldehydes was investigated. For each
aldehyde, a bell-shaped dose–response curve was
obtained. The maximal signal amplitude is of the same
order of magnitude for each aldehyde studied. However,
the concentration–response curves are shifted along the
concentration axis as a function of the odorant carbon chain
length. COS-I7 clones cells exhibit a response to heptanal in
a low concentration range (10
)14
to 10
)12
M
), to nonanal in
an intermediate concentration range (10
)13
to 10
)10
M
), and
to octanal for higher odorant concentrations over a broader
range (10
)12
to 10
)7
M
).
Fig. 3. Spectrofluorimetric intracellular calcium assays. The curves
show representative responses of cells to single odorant stimulation.
COS-I7 cells were stimulated with aldehydic odorants, and ODORA
OR17-40 cells with helional. The final concentration indicated for the
respective odorants is reached by injection of a dilution of the odorant
at t
0
indicated by the arrow. A typical curve resulting from pure
dimethylsulfoxide (or ethanol) injection is also shown.
Fig. 4. Differential dose-response of rat I7 receptor expressed in a
COS-I7 clone. Dose-response curves were plotted by measuring the
intracellular calcium concentration increase in response to stimulation
by aldehydic odorants over a large concentration range (final con-
centrations). Heptanal, j; octanal,
•
;nonanal,m. First quartile,
median (second quartile), and third quartile of all significant data are
plotted. The symbols for the medians are enlarged and curves are
drawn from these points for each odorant.
Fig. 5. Dose-response of human OR17-40 receptor expressed in an
ODORA-OR17-40 clone stimulated by helional over a large concen-
tration range (final concentrations). All significant data points are
plotted. First quartile, median (second quartile), and third quartile are
shown, and the curve based on the median is traced.
Ó FEBS 2003 Ligand-specific dose–response of olfactory receptors (Eur. J. Biochem. 270) 2909
Discussion
Expression of olfactory receptors in surrogate cells is
necessary to study molecular interaction with odorants
and signalling pathways used for olfactory coding. A
number of attempts have already been reported in hetero-
logous systems, as well as in cells presenting neuronal
phenotypes (primary neurons cultures or immortalized
olfactory cell lines), to express olfactory receptors properly
inserted into the plasma membrane [1,4,5,7,17,21]. How-
ever, it is still a matter of debate whether nonengineered,
native receptors, can indeed be functionally expressed. As
we expect to use the designed system to study not only
ligand/receptor interaction, but also the functional charac-
terization and desensitization of stimulated signalling path-
ways, we assumed that any modification of the expressed
protein could interfere with its functional interactions.
Therefore, unlike in previous studies, we expressed the
olfactory receptor without any molecular manipulation of
the coding sequence of the receptor, such as addition of an
import sequence to enhance protein translocation to the
membrane [2,6,22–24], or engineering chimeric constructs
with only part of the coding sequences of olfactory receptors
[3,24]. Only the c-myc tag was added at the 5¢-terminus of I7
sequence.
Olfactory receptor specific and dose-dependent response
The cells expressing recombinant I7 exclusively exhibit a
response to odorants of the aldehyde family (namely
heptanal, octanal and nonanal) consistent with the results
of previous in vivo [8] or in vitro studies [3,9]. However, in
those studies, octanal was reported as being the main ligand
for rat I7 receptor. Further analysis shows that these results
and ours are in fact complementary. Zhao and Araneda’s
experiments on adenovirus-infected olfactory epithelium
were conducted with varying carbon chain length aldehydes
using a single odorant concentration of 10
)3
M
. At this
concentration, octanal was reported to show the largest
response – with a response amplitude (electro-olfactogram)
of 1.7 relative to the control, whereas aldehydes with shorter
or longer chains exhibited lower responses (1.5 for nonanal,
1.45 for decanal, 1.35 for heptanal). These results compare
to our own results at the highest odorant concentrations
used (10
)10
or 10
)9
M
), which induced the largest calcium
response with octanal, a less intense response with nonanal,
and no response at all with heptanal. Nevertheless, shifting
to lower and more physiological concentrations highlighted
a different ranking of the odorants, heptanal singled out as
the preferential odorant at a 10
)13
M
concentration, more
efficient than nonanal, and octanal no longer inducing any
response at this concentration. These observations allow us
to conclude that heptanal can in fact be defined as the
preferential odorant ligand for rat I7, inducing a response at
the lowest concentration. Moreover, the concentration
range of odorants giving rise to signal detection is in the
submicro- to subpico-molar concentration range that seems
to be close to reported physiological detection limits for
some odorants in humans (10
)7
to 10
)11
M
[6,25]) or in dogs
(10
)14
to 10
)17
M
[25,26]). All previous studies have been
performed using much higher odorant concentrations –
thus, far above the physiological range – and a much
narrower concentration range than in the present work:
1 l
M
to 100 m
M
range [8], 1–30 l
M
range [3], 640 l
M
[23].
We have also performed heterologous expression of I7 in a
yeast system, where a specific dose-dependent response was
obtained exclusively in response to heptanal stimulation, in
the 10
)8
to 10
)5
M
range [27], which corroborates the
present results in terms of preferential ligand, even though
the odorant concentration range needed for stimulating the
receptor response in the yeast system is much higher than in
COS cells. This modulation could arise from modifications
in the lipidic environment differing among cellular types
[28].
In the case of OR17-40 human olfactory receptor, only
helional, among all other odorants tested, elicited a response
from the cells expressing the receptor. This is true for stable
ODORA cells, but also for transiently transfected ODORA
cells or COS cells. This specificity had already been
reported, but only for an odorant concentration of 50 l
M
[22], whereas in our experimental set-up, an optimum was
obtained for 10
)11
M
helional, a dose far below those
usually tested in other systems.
Bell-shaped dose-dependent response
The bell-shaped odor dose–response curves obtained here
for both human OR17-40 and rat I7 olfactory receptors
expressed in various cell types clearly differs from ÔclassicalÕ
pharmacological GPCR dose–response curves exhibiting a
plateau at high ligand concentration. However, some
previous studies already seemed to yield a similar dose–
response curve, though shifted to higher concentrations: in
Krautwurst’s study [3], involving expression in HEK293
cells of a chimeric receptor including the N-terminus of
rhodopsin and full-length I7 sequence and G
a15,16
,octanal
induced a response at 10 l
M
but also a smaller response at
1 l
M
and 30 l
M
. Other measurements reported in the
literature fall short of answering the question of the shape of
the dose–response curves [12] as the concentration ranges
for the odorants that were explored lie within the submil-
limolar to millimolar range, thus far from physiological
concentrations and far from the concentrations used in this
study. For the highest concentrations, experiments are
prevented by the toxic effect of both the solvent and the
odorant chemical itself, and by solubility problems. Kajiya
et al. [29] also reported cAMP elevation and [Ca
2+
]
i
increase when using recombinant olfactory receptors
expressed in HEK293; dose–response curves seemed to
downturn at the highest ligand concentration (1 m
M
for
mOR-EG, 3 m
M
for mOR-EV). Similarly, increasing
odorant concentrations elicit increasingly larger responses
from isolated olfactory neurons [11,14], while even higher
concentrations seem to yield relatively smaller responses
[14]. Moreover, the results obtained by Ronnett et al.,on
populations of primary olfactory neuronal cultures exposed
to odorant stimulation, had previously exhibited concen-
tration-related patterns in terms of intracellular cAMP
levels and adenylate cyclase activity, where maximal stimu-
lation occurred for intermediate concentrations, whereas
adenylate cyclase activity declined for both low and high
odorant concentrations [30]. In the present study, we
followed the response of populations of cells expressing a
single olfactory receptor, either I7 or OR17-40. The results
2910 G. Levasseur et al. (Eur. J. Biochem. 270) Ó FEBS 2003
obtained tend to support the interpretation that the bell-
shaped dose–response curve indeed arises from an intrinsic
response of the olfactory receptor itself.
Desensitization mechanisms may be evoked to account
for the shape of the dose–response curves
Desensitization of the receptors depends on their phos-
phorylation, as well as downstream mechanisms with
contribution of GRKs and beta-arrestins [31], and on their
internalization [32]. We infer that some inhibition of the
receptor or saturation of its transduction pathway might
occur at high concentration, as it had been evoked for
isolated olfactory neurons [14]. In the present experimental
set-up with no rinsing after odorant application, this could
involve a blocked, ÔsaturatedÕ conformation of the receptor,
with bound ligand but no activation of the transduction
pathway. In other experimental set-ups with extensive
washing following the stimulation, highly concentrated
odorants may nonetheless elicit some response from the
receptors. At the other end of the concentration range, the
present experiments clearly established the threshold odor-
ant concentration, above which the receptor is able to
trigger a cellular response.
Olfactory receptor discrimination ability
The I7 olfactory receptor exhibits a differential dose-
dependent response to odorants of a same chemical family.
It was already known that an olfactory receptor could
recognize a number of odorants, that a given odorant could
be detected by a number of different receptors, and that
different odorants could be recognized by different combi-
nations of olfactory receptors (Ôcombinatorial receptor
codingÕ [12,33]). This observation can also be related to
the behavior of individual ORNs, which have a different
reaction profile according to the odorant tested, and a
different concentration threshold for each odorant [11,14].
Here again, as in the case of the shape of the dose–response
curves, we demonstrate that a single receptor exhibits an
elaborate discrimination ability, responding differentially to
closely related odorants, with a different coding of the
olfactory information in terms of odorant concentration.
This may arise from a modulation of the odorant–receptor
interactions depending on odorant chain length, within the
putative ligand-binding site determined by transmembrane
domains IV–VII, which will be further investigated by
bio-informatic docking studies.
Visual estimation of the olfactory receptors expression
level
Comparison between immunofluorescence results and spec-
trofluorimetric calcium measurements performed in the
various cell lines indicate that no direct correlation exists
between immunodetection and functional response levels.
Indeed, transiently transfected HEK cells yield no better
intracellular calcium results than stable ODORA OR17-40
cells. Expression of olfactory receptors in only limited
amounts could lead to adequate membrane trafficking and
functional expression, whereas overexpression could be
detrimental to functionality, leading to intracellular receptor
aggregation or to unphysiological receptor coupling as
already observed in the case of other GPCRs [34].
A few experiments performed on stable COS-I7 cells with
heptanal 10–13
M
using calcium imaging in B. Dufy’s
laboratory in Bordeaux (CNRS UMR 5543, France)
showed that less than 10% of the cells are in fact responsive
to the stimulation by this odorant. Similar observations
were made from other cell types (e.g. CHO) stably
transfected with the same expression vector (results not
shown). This confirms that the absence of immunodetection
of the receptor at the cell surface is not synonymous to an
absence of functional response. The observations also
suggest that not all cells of a stable cell line under continuous
Geneticin selection pressure may at a given time yield a
functional response. Several phenomena could be respon-
sible for this behavior: the physiological state of the cell may
influence receptor expression efficiency, the adequacy of the
effector pathway may limit the responsiveness, and consti-
tutive activity of olfactory receptors could induce receptor
internalization and recycling without odorant stimulation
[35]. Thus, future experiments involving our nonengineered
receptors could largely benefit from implementing calcium
imaging experiments as an alternative technique to calcium
spectrofluorimetry.
Taken together, our results indicate that olfactory recep-
tors themselves exhibit a complex pharmacology. Consid-
ering the high number of olfactory receptor genes and the
large spectrum of odorants detected by a given receptor, this
adds another level of complexity to the olfactory receptor
world. The combination of these properties could account
for the exquisite adaptation of the olfactory perception to
the amazing complexity of the odor space.
Acknowledgements
We are grateful to Miche
`
le Lieberherr for supporting G. L. concerning
the spectrofluorimetric intracellular calcium measurements, and for
fruitful discussion. The authors wish to warmly thank Bernard Dufy,
Pierre Vacher and Thomas Ducret (CNRS UMR 5543, Bordeaux 2
University) for their generous offer to perform calcium imaging
experiments using their equipment, their skills, and their time. We
acknowledge the generous gift of helional, lyral and lilial samples by
Roche (Dubendorf, Switzerland) through the courtesy of Boris
Schilling. This research was supported in part by Institut National de
la Recherche Agronomique. G. L. is a doctorant with a grant from the
French Ministe
`
re de l’Education Nationale, de la Recherche et de la
Technologie.
References
1. Raming,K.,Krieger,J.,Strotmann,J.,Boekhoff,I.,Kubick,S.,
Baumstark, C. & Breer, H. (1993) Cloning and expression of
odorant receptors. Nature 361, 353–356.
2. Wellerdieck,C.,Oles,M.,Pott,L.,Korsching,S.,Gisselmann,G.
& Hatt, H. (1997) Functional expression of odorant receptors of
the Zebrafish Danio rero and of the nematode C. elegans in
HEK293 cells. Chem. Senses 22, 467–476.
3. Krautwurst, D., Yau, K.W. & Reed, R.R. (1998) Identification of
ligands for olfactory receptors by functional expression of a
receptor library. Cell 95, 917–926.
4. Monastyrskaia, K., Goepfert, F., Hochstrasser, R., Leighton, J.,
Pink, J.R. & Lundstrom, J. (1999) Expression and intracellular
localisation of odorant receptors in mammalian cell lines using
Ó FEBS 2003 Ligand-specific dose–response of olfactory receptors (Eur. J. Biochem. 270) 2911
semiliki forest virus vectors. J. Receptor Signal Transd. Res. 19,
687–701.
5. Gimelbrant,A.A.,Stoss,T.D.,Landers,T.M.&McClintock,T.S.
(1999) Truncation releases olfactory receptors from the
endoplasmic reticulum of heterologous cells. J. Neurochem. 72,
2301–2311.
6.Wetzel,C.,Oles,M.,Wellerdieck,C.,Kuczkowiak,M.,
Gisselmann, G. & Hatt, H. (1999) Specificity and sensitivity of a
human olfactory receptor functionally expressed in human
embryonic kidney 293 cells and Xenopus laevis oocytes. J. Neurosci.
19, 7426–7433.
7. Gimelbrant, A.A., Haley, S.L. & McClintock, T.S. (2001)
Olfactory receptor trafficking involves conserved regulatory steps.
J.Biol.Chem.276, 7285–7290.
8. Zhao,H.,Ivic,L.,Otaki,J.M.,Hashimoto,M.,Mikoshiba,K.&
Firestein, S. (1998) Functional expression of a mammalian odor-
ant receptor. Science 279, 237–242.
9. Araneda, R.C., Kini, A. & Firestein, S. (2000) The molecular
receptive range of an odorant receptor. Nature Neurosci. 3,
12487–11255.
10. Firestein, S., Picco, C. & Menini, A. (1993) The relation between
stimulus and response in olfactory receptor cells of the tiger sal-
amander. J. Physiol. (Lond.) 468, 1–10.
11. Duchamp-Viret, P., Chaput, M.A. & Duchamp, A. (1999) Odor
response properties of rat olfactory receptor neurons. Science 284,
2171–2174.
12. Malnic, B., Hirono, J., Sato, T. & Buck, L. (1999) Combinatorial
receptor codes for odors. Cell 96, 713–723.
13. Touhara, K., Sengoku, S., Inaki, K., Tsuboi, A., Hirono, J., Sato,
T., Sakano, H. & Haga, T. (1999) Functional identification and
reconstitution of an odorant receptor in single olfactory neurons.
Proc.NatlAcad.Sci.USA96, 4040–4045.
14. Kaluza, J.F. & Breer, H. (2000) Responsiveness of olfactory
neurons to distinct aliphatic aldehydes. J.Exp.Biol.203, 927–933.
15. Duchamp-Viret, P., Duchamp, A. & Chaput, M.A. (2000) Peri-
pheral odor coding in the rat and frog: quality and intensity spe-
cification. J.Neurosci.20, 2383–2390.
16. Buck, L. & Axel, R. (1991) A novel multigene family may encode
odorant receptors: a molecular basis for odor recognition. Cell 65,
175–187.
17. Murrell, J.P. & Hunter, D.D. (1999) An olfactory sensory neuron
line, Odora, properly targets olfactory proteins and responds to
odorants. J. Neurosci. 19, 8260–8270.
18. Chomczynski, P. & Sacchi, N. (1987) Single-step method of RNA
isolation by acid guanidinium thiocyanate-phenol-chloroform
extraction. Anal. Biochem. 162, 156–159.
19. Puissant, C. & Houdebine, L.M. (1990) An improvement of the
single-step method of RNA isolation by acid guanidinium thio-
cyanate-phenol-chloroforme extraction. Biotechniques 8, 148–149.
20. Grynkiewicz, G., Poenie, M. & Tsien, R.Y. (1985) A new gen-
eration of Ca
2+
indicators with greatly improved fluorescence
properties. J. Biol. Chem. 260, 3440–3450.
21. MacDonald, K.P.A., Mackay-Sim, A., Bushell, G.R. & Bartlett,
P.F. (1996) Olfactory neuronal cell lines generated by retroviral
insertion of the n-myc oncogene display different developmental
phenotypes. J.Neurosci.45, 237–247.
22. Hatt, H., Gisselmann, G. & Wetzel, C. (1999) Cloning, functional
expression and characterization of a human olfactory receptor.
Cell. Mol. Biol. 45, 285–291.
23. Hatt, H., Lang, K. & Gisselmann, G. (2001) Functional expres-
sion and characterization of odorant receptors using the Semliki
Forest virus system. Biol. Chem. 382, 1207–1214.
24. Gaillard, I., Rouquier, S., Pin, J.P., Mollard, P., Richard, S.,
Barnabe
´
, C., Demaille, J.G. & Giorgi, D. (2002) A single olfactory
receptor specifically binds a set of odorant molecules. Eur. J.
Neurosci. 15, 409–418.
25. Dorst, J. (1972) Les chimiore
´
cepteurs – Organes de l’olfaction.
Traite
´
de Zoologie. Anatomie, Syste
´
matique, Biologie. (Masson,
ed.), pp. 439–475, P.P. Grasse
´
,Paris,France.
26. Dulac, C. (2000) The physiology of taste, Vintage 2000. Cell 100,
607–610.
27.Pajot-Augy,E.,Crowe,M.,Levasseur,G.,Salesse,R.&
Connerton, I. (2003) Engineered yeasts as reporter systems for
odorant detection. J. Recept. Signal Transd. Res. 23,2
28. Lagane,B.,Gaibelet,G.,Meilhoc,E.,Masson,J.M.,Cezanne,L.
& Lopez, A. (2000) Role of sterols in modulating the human
mu-opiod receptor function in Saccharomyces cerevisiae. J. Biol.
Chem. 275, 33197–33200.
29. Kajiya, K., Inaki, K., Tanaka, M., Haga, T., Kataoka, H. &
Touhara, K. (2001) Molecular bases of odor discrimination:
reconstitution of olfactory receptors that recognize overlapping
sets of odorants. J.Neurosci.21, 6018–6025.
30. Ronnett, G.V., Parfitt, D.J., Hester, L.D. & Snyder, S.H. (1991)
Odorant-sensitive adenylate cyclase: rapid, potent activation and
desensitization in primary olfactory neuronal cultures. Proc. Natl
Acad. Sci. USA 88, 2366–2369.
31. Ferguson, S.S. (2001) Evolving concepts in G protein-coupled
receptor endocytosis: the role in receptor desensitization and
signaling. Pharmacol. Rev. 53, 1–24.
32. Boekhoff, I., Inglese, J., Schleicher, S., Koch, W.J., Lefkowitz,
R.J. & Breer, H. (1994) Olfactory desensitization requires mem-
brane targeting of receptor kinase mediated by beta gamma-
subunits of heterotrimeric G proteins. J.Biol.Chem.269,
37–40.
33. Buck, L.B. (2000) The molecular architecture of odor and
pheromone sensing in mammals. Cell 100, 611–618.
34. Pajot-Augy,E.,Couture,L.,Bozon,V.,Remy,J.J.,Biache,G.,
Severini, M., Huet, J.C., Pernollet, J.C. & Salesse, R. (1995) High-
level expression of recombinant porcine luteinizing hormone
receptor in baculovirus-infected insect cells or caterpillars. J.Mol.
Endocr. 14, 51–66.
35. Lefkowitz, R.J., Cotecchia, S., Samana, P. & Costa, T. (1993)
Constitutive activity of receptors coupled to guanine nucleotide
regulatory proteins. Trends Pharmacol. Sci. 14, 303–304.
2912 G. Levasseur et al. (Eur. J. Biochem. 270) Ó FEBS 2003