Understanding the Value of the MBA: A Program Type Comparison pdf
Bạn đang xem bản rút gọn của tài liệu. Xem và tải ngay bản đầy đủ của tài liệu tại đây (228.15 KB, 16 trang )
1600 Tysons Boulevard • Suite 1400 • McLean, Virginia • 22102 • USA • www.gmac.com • www.mba.com
GMAC
®
Understanding the Value of the MBA: A Program Type
Comparison
Grady D. Bruce GMAC
®
Research Reports • RR-06-01 • February 6, 2006
Introduction
Prior research conducted by the Graduate Management
Admission Council
®
(GMAC
®
) of mba.com registrants
(Edgington, 2003a) identified the stages through which
potential MBA students pass from the time they first
consider pursuing an MBA (a category-level decision) to
the time that they select the school and program in which
they pursue the MBA (a brand-level decision). These
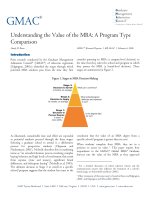
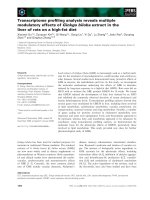
stages are summarized in Figure 1.
Figure 1. Stages in MBA Decision-Making
Stage 3:
Decision to Enroll
3 months, on average
Stage 2:
Decision to Apply
10 months, on average
Stage 1:
Decision to
Pursue Degree
2 years, or
more (46%)
What can I commit to?
What school/program
attributes are important
to me?
Is the degree right
for me?
As illustrated, considerable time and effort are expended
as potential students proceed through the three stages.
Selecting a graduate school to attend is a deliberative
process for prospective students (Chapman and
Niedermayer, 2001). Nicholls describes this in marketing
terms as “an extended decision process involving complex
buying behavior and high levels of involvement that result
from expense (time and money), significant brand
differences, and infrequent buying” (Nicholls et al, 1995).
The ultimate decision at Stage 3 to enroll in a specific
school/program suggests that the student has come to the
conclusion that the value of an MBA degree from a
specific school/program is greater than its cost.
1
When students complete their MBA, they are in a
position to assess its value.
2
This paper reports how
respondents to the GMAC
®
Global MBA
®
Graduate
Surveys rate the value of the MBA as they approach
1
For a detailed discussion of school selection criteria and the
communication sources that influence the formation of a school’s
brand image, see Schoenfeld and Bruce (2005).
2
Other treatments of this topic may be found in Bruce and Edgington
(2001) and Edgington and Schoenfeld (2005a).
Understanding the Value of the MBA, Bruce
© 2006, Graduate Management Admission Council
®
. All rights reserved.
2
graduation day, as well has how their ratings vary
depending on the type of MBA program in which they are
enrolled (i.e. full-time, part-time, and executive). In
addition, the paper discusses the relative influence of their
category-level and brand-level decisions on their
assessments of overall value. Finally, data are presented to
explore why there are differences in ratings of overall value
between some types of MBA programs.
Methodology
Graduate Management Admission Council
®
has
conducted Global MBA
®
Graduate Surveys each year since
2000. The objectives of these surveys are to understand
how graduates evaluate their educational experiences, how
they select the schools they attend, how satisfied they are
with their programs and the potential benefits of an MBA,
and how they choose their careers and jobs. In order to
develop the sample for the survey, select AACSB-
accredited business schools are invited to participate.
Survey invitations with a unique link to a Web-based
survey are then sent to the students for whom GMAC
®
has contact information, and survey invitations with a
school-level unique link to a Web-based survey are sent to
the primary contact at schools that elected to contact their
students directly. Surveys are conducted from the middle
of February through the middle of March (several months
before graduation for the typical respondent). In surveys
conducted from 2003 through 2005, graduates answered
this specific question: “When you compare the total
monetary cost of your MBA (or equivalent degree)
program to the quality of education you received, how
would you rate the
overall value
of your MBA (or
equivalent) degree?” They responded along the following
five-point scale: outstanding (5), excellent (4), good (3),
fair (2), or poor (1). An annual average of 5,423 students
answered this question over the three survey years
(representing an annual average of 120 schools and an
average survey response rate of 31%). This paper is based
on the combined three-year sample.
In addition to rating the overall value of the MBA,
respondents to the three surveys answered questions
designed to understand satisfaction with their educational
experience.
One question asked the following: “How satisfied are you
that your MBA (or equivalent) degree will give you each
of the following?”
The following nine potential benefits
of the MBA degree were listed; and respondents indicated
their satisfaction along the following scale: extremely
satisfied (5), very satisfied (4), somewhat satisfied (3), not
very satisfied (2), or not at all satisfied (1).
1. Preparation to get a good job in the business world
2. An increase in your career options
3. Credentials you desired
4. Opportunity to improve yourself personally
5. Opportunity for quicker advancement
6. Development of your management
knowledge/technical skills
7. An increase in earning power
8. Opportunity to network and to form relationships
with long-term value
9. Job security
Another question asked: “Based on your entire educational
experience as a graduate business school student, please
rate each of the following aspects of your program.” Seven
aspects of their MBA programs were listed, and
respondents rated each one (applicable to them) along this
scale: outstanding (5), excellent (4), good (3), fair (2), or
poor (1).
1. Admissions
2. Career services
3. Curriculum
4. Faculty
5. Program management (mission, standards, continuous
improvement (etc.)
6. Student services
7. Fellow students
Responses to the question on MBA benefits indicate how
satisfied students are with the category-level decision they
made, whereas the ratings on aspects of program delivery
indicate their satisfaction with the brand-level decision
they made. Accordingly, two scales are developed to
measure satisfaction with the MBA degree and satisfaction
with the school/program. Each scale aggregates responses
to the items of which it is composed: nine items for the
MBA Degree scale and seven items for the
Understanding the Value of the MBA, Bruce
© 2006, Graduate Management Admission Council
®
. All rights reserved.
3
School/Program scale. Both scales are reliable. For the
MBA Degree, Cronbach’s alpha = .91; and for the
School/Program scale, Cronbach’s alpha = .88.
3
Factor
analysis shows each scale is unidimensional, with the first
factor accounting for 59% of the variance in the factor
analysis of each scale. Table 1 reports item-total
correlations for items comprising the two scales; items in
each scale are ranked in descending order of their
correlation with scale values. Examination of Table 1
shows that the items in each scale are moderately to
strongly correlated with the total scale value. Within the
limited range represented by these correlation coefficients,
job-related items are the most highly correlated with total
scale values for the MBA Degree scale and
networking/personal improvement items, the least
correlated. For the School/Program scale, program
management is correlated most strongly with the total
scale value and fellow students, least strongly. These item-
total correlations suggest that each scale is measuring what
it is intended to measure (i.e., possesses construct validity).
The bivariate correlation between the two scales is .70.
Table 1. Item-Total Correlations
Item
Pearson
Correlation
(
n
= 14,462)
MBA Degree
Opportunity for quicker advancement 0.83
Preparation to get a good job in the business world 0.83
An increase in your career options 0.81
An increase in earning power 0.80
Credentials you desired 0.77
Job security 0.76
Development of your management
knowledge/technical skills
0.72
Opportunity to network and to form relationships
with long-term value
0.71
Opportunity to improve yourself personally 0.69
School/Program
Program management 0.82
Student services 0.80
Curriculum 0.79
Faculty 0.76
Admissions 0.75
Career services 0.74
Fellow students 0.71
3
3
These alpha coefficients are quite satisfactory. Peterson (1994)
conducted a meta-analysis by harvesting alpha coefficients from a
census of eight leading psychology and marketing-related journals and a
convenience sample of sixteen other journals. A total of 4,286 alpha
coefficients were harvested. A relatively low 14% were .90 or greater.
Understanding the Value of the MBA, Bruce
© 2006, Graduate Management Admission Council
®
. All rights reserved.
4
Figure 2 shows the distribution of values for
the MBA Degree scale and Figure 3, the distribution of
values for the School/Program scale.
Figure 2. Distribution of MBA Degree Scale
10
15
20 25 30 35 40 45
MBA Degree
0
200
400
600
800
1,000
1,200
Mean = 35.4953
Std. Dev. = 6.0436
N = 14,462
Fre
q
uenc
y
Understanding the Value of the MBA, Bruce
© 2006, Graduate Management Admission Council
®
. All rights reserved.
5
Figure 3. Distribution of School/Program Scale
10
15 20 25 30 35
School/Program
0
200
400
600
800
1,000
1,200
Mean = 24.8083
Std. Dev. =
5.39083
N = 14,462
Frequency
Given the importance of both category-level and brand-
level factors in the ultimate decision to enroll in an MBA
program, the hypothesis is that both will affect the overall
value of the MBA at the time of graduation. Multiple
regression analysis is used to test this hypothesis. Separate
models are developed for each type of MBA program to
discover if the hypothesis is supported, as well as whether
results can be generalized across different types of MBA
programs. Program types are also compared using items
comprising the MBA Degree and School/Program scales.
ANOVA is used to test the statistical significance of
differences in means across program types; t-tests are used
to test the significance of differences between means of
pairs of program types. Due to the large sample sizes, a p
< .001 significance level is used in all analyses of
differences between means, as large samples are likely to
produce statistically significant results. This .001 level
reduces the possibility of concluding that results are
statistically significant when those same results may not be
practically significant.
Results
Overall Value of the MBA
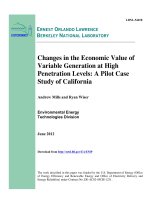
As seen in Figure 4 (
n
= 14,455), more than three-fifths
of graduates rate the overall value of the MBA as either
“outstanding” or “excellent.” Slightly more than one-
fourth rate overall value as “good,” and the balance rate
value as either “fair” (9%) or “poor” (3%).
Understanding the Value of the MBA, Bruce
© 2006, Graduate Management Admission Council
®
. All rights reserved.
6
Figure 4. Overall Value of the MBA
Outstanding, 30%
Excellent, 34%
Good, 25%
Fair, 9%
Poor, 3%
When program types are compared (Figure 5), the results
show that the majority of graduates rates overall value of
the MBA as “outstanding” or “excellent,” regardless of the
type of MBA program in which they are enrolled. There
are, however, slight (yet statistically significant) differences
in mean ratings between full-time and executive programs
and part-time programs. Overall value is rated higher by
graduates from full-time programs (mean = 3.8,
n
=
11,122) than those from part-time programs (mean =
3.5,
n
= 2,502) [t
= 13.9, p < .001, df = 13,622]; and
overall value is rated higher by graduates from executive
programs (mean = 3.8,
n
= 677) than those from part-
time programs [t
= 5.9, p < .001, df = 3,177]. Graduates
of full-time programs rate overall value “outstanding” at
nearly twice the rate of those in part-time programs.
Understanding the Value of the MBA, Bruce
© 2006, Graduate Management Admission Council
®
. All rights reserved.
7
Figure 5. Overall Value of the MBA by Program Type
33% 33%
23%
8%
3%
18%
35%
32%
12%
3%
25%
40%
23%
10%
2%
0%
5%
10%
15%
20%
25%
30%
35%
40%
45%
Outstanding Excellent Good Fair Poor
Percent Rating
Full-time Part-time Executive
Model Results
Results of the multiple regression analysis show that both
the MBA Degree and School/Program variables
contribute significantly to prediction of the overall value
of the MBA, regardless of the type of MBA program from
which the student is graduating. Table 2 shows the
standardized beta coefficients for each model, significance
probabilities, and adjusted R
2
values.
4
4
Inspection of tolerances indicates the absence of problems with
multicollinearity. Examination of Cook’s D and externally
Studentized residuals led to the elimination of seven cases before final
models were developed.
Understanding the Value of the MBA, Bruce
© 2006, Graduate Management Admission Council
®
. All rights reserved.
8
Table 2. Results of Multiple Regression Analyses
Program Type
Beta
Coefficient Probability
Effect Size
(Adjusted R
2
)
Full-time 0.45
MBA Degree 0.347 < .001
School/Program 0.383 < .001
Part-time 0.41
MBA Degree 0.315 < .001
School/Program 0.392 < .001
Executive 0.49
MBA Degree 0.369 < .001
School/Program 0.391 < .001
The relative contribution of each predictor is shown in
Figure 6. Relative contribution is calculated using the
Pratt Index.
5
As shown in Table 2 and Figure 6, both the
5
* The contributions of variables in the prediction were calculated using the
Pratt Index (Johnson & LeBreton, 2004) with
*
2
ij i
i
r
PI
R
β
=
where
*
ij
r
is the adjusted bivariate correlation of predictor variable i with
criterion variable j;
i
β
is the standardized beta weight for variable I; and
R
2
is the squared multiple correlation of the set of variables
with j.
MBA Degree and School/Program variables exert highly
similar influences on the prediction of overall value across
the three types of MBA programs.
Understanding the Value of the MBA, Bruce
© 2006, Graduate Management Admission Council
®
. All rights reserved.
9
Figure 6. Relative Contribution of MBA Degree and School/Program to the Prediction of Overall Value
47%
43%
48%
53%
57%
52%
0%
10%
20%
30%
40%
50%
60%
Full-time Part-time Executive
Pratt Index
MBA Degree School/Program
Discussion
The hypothesis that both MBA Degree (category-level)
and School/Program (brand-level) variables contribute to
predicting the overall value of the MBA is supported for
each type of MBA program. The School/Program
variable is slightly more influential in the prediction than
the MBA Degree variable. However, both make
independent contributions. And the relative contributions
make it clear that neither can be ignored in studies of
overall value of the MBA.
When R
2
is used to indicate effect size for the three
models, the analysis of the statistical significance of
differences between pairs of models shows significant
differences for the full-time/part-time and part-
time/executive comparisons (p < .05), but not for the
full-time/executive comparison. This suggests that, just as
part-time students rate the overall value of the MBA lower
than do full-time and executive students, the capacity to
model or predict their ratings is also lower. In general, the
R
2
values indicate that the models, while good for studies
involving attitudinal data, still explain less than one-half
of the variation in respondents’ ratings of the overall value
of the MBA. To fully understand “why” overall value is
higher in full-time and executive programs than in part-
time programs—as well as more predictable—it is useful
to explore differences between full-time, part-time, and
executive programs in the items used to construct both
predictors. Multiple regression analysis is a technique
based upon associations between variables and does not
indicate causation. To discuss “why” is to discuss what
the models suggest about causes rather than what they
prove. This is done in Table 3.
Understanding the Value of the MBA, Bruce
© 2006, Graduate Management Admission Council
®
. All rights reserved.
10
Table 3. Predictor Scale Components: Program Type Comparisons
Program Type Effect Size
Predictors
Full-time
(Mean)
Part-time
(Mean)
Executive
(Mean)
Full-time –
Part-time
(Cohen’s d)
Executive –
Part-time
(Cohen’s d)
Full-time –
Executive
(Cohen’s d)
MBA Degree
Preparation to get a good job 3.91 3.70 3.96 0.2 0.3 0.1
An increase in career options 4.07 3.92 4.22 0.2 0.4 0.2
Credentials you desired 4.11 4.06 4.30 0.1 0.3 0.3
Opportunity to improve
yourself personally
4.29 4.20 4.51 0.1 0.4 0.3
Opportunity for quicker
advancement
3.97 3.68 3.93 0.3 0.3 0.0
Development of your
management knowledge/
technical skills
4.16 4.00 4.27 0.2 0.4 0.1
An increase in earning power 3.84 3.59 3.81 0.3 0.3 0.0
Opportunity to network and
to form relationships with
long-term value
3.97 3.63 4.09 0.4 0.5 0.1
Job security 3.41 3.40 3.62 0.0 0.2 0.2
School/Program
Admissions 3.58 3.31 3.65 0.3 0.4 0.1
Career services 2.90 2.68 2.76 0.2 0.1 0.1
Curriculum 3.74 3.56 3.95 0.2 0.5 0.2
Faculty 3.93 3.68 4.03 0.3 0.4 0.1
Program management 3.58 3.37 3.71 0.2 0.4 0.1
Student services 3.42 3.07 3.50 0.3 0.4 0.1
Fellow students 3.94 3.66 4.06 0.3 0.4 0.1
Graduates from full-time programs are significantly more
satisfied than those from part-time programs on seven of
the nine items making up the MBA Degree scale (all but
credentials you desired and job security) and on all items
making up the School/Program scale. Graduates from
executive programs are significantly more satisfied than
those from part-time programs on all items making up the
MBA Degree scale and on six of the seven items making
Understanding the Value of the MBA, Bruce
© 2006, Graduate Management Admission Council
®
. All rights reserved.
11
up the School/Program scale (all but career services).
Cohen’s d is used to evaluate effect sizes in the
comparisons of means for the predictor scale components
in Table 3. Using conventional interpretations of Cohen’s
d, effect sizes for the full-time/part-time and
executive/part-time comparisons are generally small to
medium, whereas almost all of the effect sizes for the full-
tme/executive comparisons are small. Effect sizes for the
full-time/part-time and executive/part-time comparisons
are generally greater than for the full-time/executive
comparisons. This is precisely what would be expected
from the regression results.
Part-time Programs
The lower ratings of the overall value of the MBA by
graduates from part-time programs are explained only
partially by the model offered here, as the R
2
of .41
indicates (the lowest of the three program-type models).
To fully understand these lower ratings, it is necessary to
look behind the lower ratings on predictor scale
components (Table 3), as well as to consider other
possible explanations that could contribute to the 59%
variance in overall ratings of the MBA left unexplained by
the part-time model.
One other possible explanation relates to work-life
balance problems of part-time MBA students. Work-life
balance problems contribute to the
personal
cost of
obtaining an MBA. If students experience work-life
balance problems while pursuing the MBA that increase
its total cost (monetary cost + personal cost), they may
rate the overall value of the degree lower. There is
considerable evidence from GMAC
®
survey research to
indicate that part-time students experience work-life
balance problems while pursuing the degree. Among pre-
MBA students, those intending to enroll in part-time
programs cited these reservations about pursuing an MBA
significantly more than did those intending to enroll in
full-time programs: it might require more energy than I
am willing to invest; it might require more time than I am
willing to invest; it might be too stressful; and it might
severely limit the time I have for people who are
important to me (Edgington, 2003b).
Among students who ultimately enrolled in part-time
programs, a model of the matriculation process revealed
convenient class schedules and proximity to work or home
as the principal influences on school/program selection
(Edgington and Schoenfeld, 2004a). In contrast, among
those who matriculated in full-time programs, convenient
class schedules, while still the primary influence, had the
opposite effect: the less important convenient class
schedules were in school/program selection, the more
likely students were to matriculate in full-time programs.
And proximity to work or home did not even enter the
full-time matriculation model as a significant influence.
In a study of work-life balance conducted by Schoenfeld,
the author reports that respondents who were under 28
years of age when they graduated from their MBA
programs are significantly more likely to have higher
work-life balance than older respondents (Schoenfeld,
2005). In the sample of graduates on which the present
study is based, 18% of graduates from part-time programs
were under 28 when they graduated, significantly less than
the 34% of full-time graduates (X
2
= 547, p < .001, df =
1). This lends further support to likely work-life balance
problems for part-time students while in school. Other
evidence comes from additional analysis of Schoenfeld’s
work-life balance scale conducted as part of the present
study. Work-life balance for part-time alumni was
significantly lower than that for full-time alumni (t = 3.5,
p < .001, df = 1,934). It appears that the work-life
balance problems of part-time students extend into their
post-MBA lives, although age and length of employment
(also found by Schoenfeld to negatively influence work-
life balance) may affect this result.
Another possible explanation for lower ratings of the
overall value of the MBA by part-time graduates relates to
their objectives when pursuing the degree. Prior GMAC
®
research among registrants at mba.com (the GMAC
®
Web
portal for prospective MBA students) showed that those
intending to study in part-time programs are significantly
more likely to be career-enhancers (69%) than are those
intending to study in full-time programs (35%)
(Edgington, 2003b). Career-enhancers use the MBA to
enhance their opportunities in their current occupation
and industry, rather than to move to a different
occupation or industry (career-switchers). According to
the September 2004 survey of alumni conducted by
GMAC
®
, 77% of graduates of part-time programs were
employed while they were in school, a significantly larger
proportion than graduates of full-time programs
(Edgington and Schoenfeld, 2004b). This same survey
also showed that 86% of part-time graduates were
Understanding the Value of the MBA, Bruce
© 2006, Graduate Management Admission Council
®
. All rights reserved.
12
employed by the same employer they had at graduation.
The differential emphasis on career-enhancement by part-
time students and their employment status while in school
(and after) mark a clear distinction between part-time and
full-time students. The reactions of part-time and
executive students to their MBA programs as they
graduate, then, are more likely to be influenced by their
employment situations than are those of full-time
students. That is, graduates from full-time programs are
more likely to have a “fresh start” when they graduate
than are graduates from part-time and executive programs.
The career-switching goals of the typical full-time student
are more quickly achieved than the career-enhancing goals
of part-time students. And there is a direct relationship
between ratings of the overall value of the MBA and the
speed with which investment in the degree is recouped.
Alumni responding to the April 2005 MBA Alumni
Perspectives survey rated the overall value of the MBA and
also indicated to what extent they had recouped their
investment. There is a moderate correlation of .52 (
n =
2,207, p < .001): the more quickly the investment is
recouped, the higher the rating of the overall value of the
MBA.
The overall value of the MBA is also related to the job
satisfaction of alumni. In MBA Alumni Perspectives
surveys conducted from 2003 through 2005, respondents
were asked: “How satisfied are you with your job?” They
responded along a five-point scale: very satisfied (5),
somewhat satisfied (4), neither satisfied nor dissatisfied
(3), somewhat dissatisfied (2), and very dissatisfied (1).
Alumni in these same surveys also rated the overall value
of the MBA, using the same scale (dependent variable)
used in the present study. There is a positive correlation
between job satisfaction and ratings of the overall value of
the MBA in each survey (Table 4), although the
correlation is not strong. The consistency of these results,
however, across three alumni surveys conducted a year
apart (with a minimal amount of overlap in sample
members)
7
reinforces this conclusion: the more satisfied
respondents are with their jobs, the higher they rate the
value of the MBA.
Table 4. Alumni Job Satisfaction and Overall Value of the MBA
Alumni Perspectives Survey
Pearson
Correlation
Coefficient
n
Probability*
March, 2003 0.38 2,062 < .001
April, 2004 0.40 2,060 < .001
April, 2005 0.44 2,087 < .001
*Probability correlation coefficient differs from zero as a result of chance.
Additional information on alumni satisfaction with their
6
jobs and employers is available from the GMAC
®
Alumni
Perspectives survey conducted in September 2004, in
which alumni rated their satisfaction with several specific
aspects of their jobs and employers. Among respondents
who are still working for the same employer they had after
graduation, alumni from part-time programs are less
6
For example, the overlap of respondents participating in the March,
2003 and April, 2004 surveys is 26%.
satisfied than those from full-time programs on five
important aspects of their jobs and on two important
aspects of their employers, as shown in Table 5.
Understanding the Value of the MBA, Bruce
© 2006, Graduate Management Admission Council
®
. All rights reserved.
13
Table 5. Alumni Satisfaction with Employers by Program Type
% Extremely or Very Satisfied Differences
Satisfaction with…
Full-time Part-time Executive
Full-time–
Part-time
Executive–
Part-time
Full-time–
Executive
Job
Opportunity to use your skills to the
maximum*
53% 35% 43% 18% 8% 10%
Achieving something that you
personally value*
58% 43% 50% 15% 8% 8%
Challenging and interesting work* 67% 50% 58% 17% 7% 9%
Opportunity for advancement* 56% 30% 39% 25% 9% 17%
Opportunity to learn new things* 72% 53% 53% 19% 0% 19%
Employer
Value employer places on MBA
skills*
51% 25% 28% 26% 3% 23%
Organizational climate* 56% 36% 44% 20% 9% 12%
p < .001
As seen in Table 5, alumni from full-time programs are
twice as likely as alumni from part-time programs to be
extremely or very satisfied with the value the employer
places on MBA skills. This finding is somewhat
surprising, given company reimbursement and sponsorship
practices: significantly more companies reimburse or
sponsor employees to part-time programs (63%) and
executive programs (53%) than to full-time programs
(38%), according to the 2005 GMAC
®
survey of
corporate recruiters (Edgington and Schoenfeld, 2005b).
And, in the sample on which the current study is based,
47% of part-time students and 41% of executive program
students cite employer reimbursement or sponsorship as
the principal way they financed their MBA education,
significantly higher than the 4% of full-time students (X
2
= 3,968, p = < .001, df = 14). It may be that the
expectations of part-time graduates are driven higher by
employer reimbursement and sponsorship, whereas
employers perceive reimbursement and sponsorship
programs as an employee benefit. Recruiters from
companies that measure ROI for these programs indicated
the following as the top-five factors they use in calculating
return: improved leadership skills (84%), improved
management skills (83%), improved promotability,
improved quality of work (70%), and increased likelihood
of retention (68%). These are not outcomes likely to be
observed immediately, adding to the problems of career-
enhancers in achieving delayed returns when compared
with career-switchers. In fact, asked if they give any special
recognition to strong employees upon completion of their
MBA programs, 75% of corporate recruiters working for
companies that reimburse or sponsor to part-time
programs said they did not.
Conclusion
The MBA Degree and School/Program quality scales
account for much of the variance in overall value of the
MBA degree. Work-life balance, graduate career goals and
expectations, and current employment situations all are
factors not explicitly included in the models presented in
this paper for predicting the overall value of the MBA
(and likely contribute to the variation that the models
leave unexplained). With regard to variation that the
models do explain, the discussion suggests that part-time
students (generally career-enhancers) express less
satisfaction in the degree’s potential to increase their career
options and provide an opportunity for quicker
advancement because neither of these potential benefits
Understanding the Value of the MBA, Bruce
© 2006, Graduate Management Admission Council
®
. All rights reserved.
14
can be realized quickly for them. With regard to lower
satisfaction with the opportunity to network and form
relationships of long-term value, it is not difficult to
understand why part-time students, whose matriculation
decisions were primarily influenced by convenient class
schedules and who face work-life balance issues while
pursuing the MBA, are less satisfied than full-time
students. None of this analysis, of course, is intended to
suggest that part-time program administrators cannot take
actions that would ultimately result in improved ratings of
the overall value of the MBA by their graduates. Instead,
what it does suggest is that some aspects of the MBA
Degree and School/Program predictors are under their
control, while others are not. And almost all are a mixture.
For example, 44% of graduates from part-time programs
expressed a need for more education and training in career
management in the April 2005 MBA Alumni Perspectives
survey, higher than the 35% of full-time graduates (X
2
=
19, p < .001, df = 1). And in Table 3, career services is
rated lower by graduates of part-time programs than by
those from full-time programs. This suggests a need for
career service directors in part-time programs to offer
more career-management education to students. At the
same time, the existing employer relationships of part-time
students may constrain what career services directors can
do. The mixture of controllable and uncontrollable
elements in both the MBA Degree and School/Program
predictors means that administrators in part-time
programs face unique challenges.
This paper has shown that both MBA Degree (category-
level) and School/Program (brand-level) predictors are
relevant to predicting graduate ratings of the overall value
of the MBA. Separate models for full-time, part-time, and
executive programs show only slight differences in the
influence of these two predictors. The reasons for slightly
lower ratings of the overall value of the MBA by part-time
students than by students in full-time and executive
programs have been explored. It is hoped that results will
be useful to future investigators of the overall value of the
MBA, as well as to those on the frontline of MBA
program administration whose goal it is to enhance the
value of the MBA for their students.
Contact Information
For questions or comments regarding study findings,
methodology or data, please contact the GMAC
®
Research and Development department at
Acknowledgements
Rachel Edgington, Director, Market Research and
Analysis, GMAC
®
; Robert A. Peterson, Professor of
Marketing, The University of Texas at Austin; Neil
Granitz, Professor of Marketing, California State
University, Fullerton; Lawrence M. Rudner, Vice
President, Research and Development, GMAC
®
, all for
comments on earlier versions of this manuscript; and
Veronica Garcia, Research Writer/Editor, GMAC
®
, for
writing and editorial services.
The views and opinions expressed in this paper are those
of the author and do not necessarily reflect those of
the Graduate Management Admission Council
®
.
Understanding the Value of the MBA, Bruce
© 2006, Graduate Management Admission Council
®
. All rights reserved.
15
References
Bruce, G. and R. Edgington (Spring, 2001). “For All It’s Worth: Assessing the Value of the MBA,”
Selections
,
3(2), 12-17.
Chapman, G. and L Niedermayer (2001). “What Counts As a Decision? Predictors of Perceived Decision Making.”
Psychonomic Bulletin and Review
8(3), 615-621.
Edgington, R. (2003a). Mba.com Registrants Survey Executive Summary 2003. Graduate Management Admission
Council®. Available at
Edgington, R. (2003b). mba.com Registrants Survey Overall Report 2003. Graduate Management Admission Council®.
Available at
Edgington, R. and G. Schoenfeld (2004a). mba.com Registrants Survey Executive Summary 2004. Graduate
Management Admission Council®. Available at
Edgington, R. and G. Schoenfeld (2004b). MBA Alumni Perspectives Survey Executive Summary 2004-2005. Graduate
Management Admission Council®. Available at
Edgington, R. and G. Schoenfeld (2005a). Global MBA Graduate Survey 2005. Graduate Management Admission
Council®. Available at
Edgington, R. and G. Schoenfeld (2005b). Corporate Recruiters Survey Comprehensive Report 2005. Graduate
Management Admission Council®. Available at
Johnson, J. W. & LeBreton, J. M. (2004). History and use of relative importance indices in organizational research.
Organizational Research Methods, 7, 238-257.
Nicholls J., J. Harris, E. Morgan, K. Clarke K., and D. Sims (February, 1995). “Marketing Higher Education: the MBA
Experience,”
International Journal of Educational Management
. 9(2), 31-38.
Peterson, R. A. (1994). “A Meta-analysis of Cronbach’s Coefficient Alpha,”
Journal of Consumer Research
21(2), 381-
391.
Schoenfeld, G. (2005). “Work-Life Balance: An MBA Alumni Report.” Graduate Management Admission Council®.
Available at
Schoenfeld, G. and G. Bruce (2005). “School Brand Images and Brand Choices in MBA Programs,”
2005 Symposium
for the Marketing of Higher Education
. Chicago: American Marketing Association, 130-139. Available at
© 2006 Graduate Management Admission Council
®
(GMAC
®
). All rights reserved.
No part of this publication may be reproduced, stored in a retrieval system, distributed or transmitted in any form by any means, electronic,
mechanical, photocopying, recording or otherwise, without the prior written permission of GMAC
®
. For permission contact the GMAC
®
legal
department at
Creating Access to Graduate Business Education
®
, Global MBA
®
, GMAC
®
, GMAT
®
, Graduate Management Admission Council
®
, and
Graduate Management Admission Test
®
are registered trademarks of the Graduate Management Admission Council
®
(GMAC
®
).