Báo cáo khoa học: "Randomized Algorithms and NLP: Using Locality Sensitive Hash Function for High Speed Noun Clustering" pdf
Bạn đang xem bản rút gọn của tài liệu. Xem và tải ngay bản đầy đủ của tài liệu tại đây (92.57 KB, 8 trang )
Proceedings of the 43rd Annual Meeting of the ACL, pages 622–629,
Ann Arbor, June 2005.
c
2005 Association for Computational Linguistics
Randomized Algorithms and NLP: Using Locality Sensitive Hash Function
for High Speed Noun Clustering
Deepak Ravichandran, Patrick Pantel, and Eduard Hovy
Information Sciences Institute
University of Southern California
4676 Admiralty Way
Marina del Rey, CA 90292.
{ravichan, pantel, hovy}@ISI.EDU
Abstract
In this paper, we explore the power of
randomized algorithm to address the chal-
lenge of working with very large amounts
of data. We apply these algorithms to gen-
erate noun similarity lists from 70 million
pages. We reduce the running time from
quadratic to practically linear in the num-
ber of elements to be computed.
1 Introduction
In the lastdecade, the field of Natural Language Pro-
cessing (NLP), has seen a surge in the use of cor-
pus motivated techniques. Several NLP systems are
modeled based on empirical data and have had vary-
ing degrees of success. Of late, however, corpus-
based techniques seem to have reached a plateau
in performance. Three possible areas for future re-
search investigation to overcoming this plateau in-
clude:
1. Working with large amounts of data (Banko and
Brill, 2001)
2. Improving semi-supervised and unsupervised al-
gorithms.
3. Using more sophisticated feature functions.
The above listing may not be exhaustive, but it is
probably not a bad bet to work in one of the above
directions. In this paper, we investigate the first two
avenues. Handling terabytes of data requires more
efficient algorithms than are currently used in NLP.
We propose a web scalable solution to clustering
nouns, which employs randomized algorithms. In
doing so, we are going to explore the literature and
techniques of randomized algorithms. All cluster-
ing algorithms make use of some distance similar-
ity (e.g., cosine similarity) to measure pair wise dis-
tance between sets of vectors. Assume that we are
given n points to cluster with a maximum of k fea-
tures. Calculating the full similarity matrix would
take time complexity n
2
k. With large amounts of
data, say n in the order of millions or even billions,
having an n
2
k algorithm would be very infeasible.
To be scalable, we ideally want our algorithm to be
proportional to nk.
Fortunately, we can borrow some ideas from the
Math and Theoretical Computer Science community
to tackle this problem. The crux of our solution lies
in defining Locality Sensitive Hash (LSH) functions.
LSH functions involve the creation of short signa-
tures (fingerprints) for each vector in space such that
those vectors that are closer to each other are more
likely to have similar fingerprints. LSH functions
are generally based on randomized algorithms and
are probabilistic. We present LSH algorithms that
can help reduce the time complexity of calculating
our distance similarity atrix to nk.
Rabin (1981) proposed the use of hash func-
tions from random irreducible polynomials to cre-
ate short fingerprint representations for very large
strings. These hash function had the nice property
that the fingerprint of two identical strings had the
same fingerprints, while dissimilar strings had dif-
ferent fingerprints with a very small probability of
collision. Broder (1997) first introduced LSH. He
proposed the use of Min-wise independent functions
to create fingerprints that preserved the Jaccard sim-
622
ilarity between every pair of vectors. These tech-
niques are used today, for example, to eliminate du-
plicate web pages. Charikar (2002) proposed the
use of random hyperplanes to generate an LSH func-
tion that preserves the cosine similarity between ev-
ery pair of vectors. Interestingly, cosine similarity is
widely used in NLP for various applications such as
clustering.
In this paper, we perform high speed similarity
list creation for nouns collected from a huge web
corpus. We linearize this step by using the LSH
proposed by Charikar (2002). This reduction in
complexity of similarity computation makes it pos-
sible to address vastly larger datasets, at the cost,
as shown in Section 5, of only little reduction in
accuracy. In our experiments, we generate a simi-
larity list for each noun extracted from 70 million
page web corpus. Although the NLP community
has begun experimenting with the web, we know
of no work in published literature that has applied
complex language analysis beyond IR and simple
surface-level pattern matching.
2 Theory
The core theory behind the implementation of fast
cosine similarity calculation can be divided into two
parts: 1. Developing LSH functions to create sig-
natures; 2. Using fast search algorithm to find near-
est neighbors. We describe these two components in
greater detail in the next subsections.
2.1 LSH Function Preserving Cosine Similarity
We first begin with the formal definition of cosine
similarity.
Definition: Let u and v be two vectors in a k
dimensional hyperplane. Cosine similarity is de-
fined as the cosine of the angle between them:
cos(θ(u, v)). We can calculate cos(θ(u, v)) by the
following formula:
cos(θ(u, v)) =
|u.v|
|u||v|
(1)
Here θ(u, v) is the angle between the vectors u
and v measured in radians. |u.v| is the scalar (dot)
product of u and v, and |u| and |v| represent the
length of vectors u and v respectively.
The LSH function for cosine similarity as pro-
posed by Charikar (2002) is given by the following
theorem:
Theorem: Suppose we are given a collection of
vectors in a k dimensional vector space (as written as
R
k
). Choose a family of hash functions as follows:
Generate a spherically symmetric random vector r
of unit length from this k dimensional space. We
define a hash function, h
r
, as:
h
r
(u) =
1 : r.u ≥ 0
0 : r.u < 0
(2)
Then for vectors u and v,
P r[h
r
(u) = h
r
(v)] = 1 −
θ(u, v)
π
(3)
Proof of the above theorem is given by Goemans
and Williamson (1995). We rewrite the proof here
for clarity. The above theorem states that the prob-
ability that a random hyperplane separates two vec-
tors is directly proportional to the angle between the
two vectors (i,e., θ(u, v)). By symmetry, we have
P r[h
r
(u) = h
r
(v)] = 2P r[u.r ≥ 0, v.r < 0]. This
corresponds to the intersection of two half spaces,
the dihedral angle between which is θ. Thus, we
have P r[u.r ≥ 0, v.r < 0] = θ(u, v)/2π. Proceed-
ing we have P r[h
r
(u) = h
r
(v)] = θ(u, v)/π and
P r[h
r
(u) = h
r
(v)] = 1 − θ(u, v)/π. This com-
pletes the proof.
Hence from equation 3 we have,
cos(θ(u, v)) = cos((1 − P r[h
r
(u) = h
r
(v)])π)
(4)
This equation gives us an alternate method for
finding cosine similarity. Note that the above equa-
tion is probabilistic in nature. Hence, we generate a
large (d) number of random vectors to achieve the
process. Having calculated h
r
(u) with d random
vectors for each of the vectors u, we apply equation
4 to find the cosine distance between two vectors.
As we generate more number of random vectors, we
can estimate the cosine similarity between two vec-
tors more accurately. However, in practice, the num-
ber (d) of random vectors required is highly domain
dependent, i.e., it depends on the value of the total
number of vectors (n), features (k) and the way the
vectors are distributed. Using d random vectors, we
623
can represent each vector by a bit stream of length
d.
Carefully looking at equation 4, we can ob-
serve that P r[h
r
(u) = h
r
(v)] = 1 −
(hamming distance)/d
1
. Thus, the above theo-
rem, converts the problem of finding cosine distance
between two vectors to the problem of finding ham-
ming distance between their bit streams (as given by
equation 4). Finding hamming distancebetween two
bit streams is faster and highly memory efficient.
Also worth noting is that this step could be consid-
ered as dimensionality reduction wherein we reduce
a vector in k dimensions to that of d bits while still
preserving the cosine distance between them.
2.2 Fast Search Algorithm
To calculate the fast hamming distance, we use the
search algorithm PLEB (Point Location in Equal
Balls) first proposed by Indyk and Motwani (1998).
This algorithm was further improved by Charikar
(2002). This algorithm involves random permuta-
tions of the bit streams and their sorting to find the
vector with the closest hamming distance. The algo-
rithm given in Charikar (2002) is described to find
the nearest neighbor for a given vector. We mod-
ify it so that we are able to find the top B closest
neighbor for each vector. We omit the math of this
algorithm but we sketch its procedural details in the
next section. Interested readers are further encour-
aged to read Theorem 2 from Charikar (2002) and
Section 3 from Indyk and Motwani (1998).
3 Algorithmic Implementation
In the previous section, we introduced the theory for
calculation of fast cosine similarity. We implement
it as follows:
1. Initially we are given n vectors in a huge k di-
mensional space. Our goal is to find all pairs of
vectors whose cosine similarity is greater than
a particular threshold.
2. Choose d number of (d << k) unit random
vectors {r
0
, r
1
, , r
d
} each of k dimensions.
A k dimensional unit random vector, in gen-
eral, is generated by independently sampling a
1
Hamming distance is the number of bits which differ be-
tween two binary strings.
Gaussian function with mean 0 and variance 1,
k number of times. Each of the k samples is
used to assign one dimension to the random
vector. We generate a random number from
a Gaussian distribution by using Box-Muller
transformation (Box and Muller, 1958).
3. For every vector u, we determine its signature
by using the function h
r
(u) (as given by equa-
tion 4). We can represent the signature of vec-
tor u as: ¯u = {h
r1
(u), h
r2
(u), , h
rd
(u)}.
Each vector is thus represented by a set of a bit
streams of length d. Steps 2 and 3 takes O(nk)
time (We can assume d to be a constant since
d << k).
4. The previous step gives n vectors, each of them
represented by d bits. For calculation of fast
hamming distance, we take the original bit in-
dex of all vectors and randomly permute them
(see Appendix A for more details on random
permutation functions). A random permutation
can be considered as random jumbling of the
bits of each vector
2
. A random permutation
function can be approximated by the following
function:
π(x) = (ax + b)mod p (5)
where, p is prime and 0 < a < p , 0 ≤ b < p,
and a and b are chosen at random.
We apply q different random permutation for
every vector (by choosing random values for a
and b, q number of times). Thus for every vec-
tor we have q different bit permutations for the
original bit stream.
5. For each permutation function π, we lexico-
graphically sort the list of n vectors (whose bit
streams are permuted by the function π) to ob-
tain a sorted list. This step takes O(nlogn)
time. (We can assume q to be a constant).
6. For each sorted list (performed after applying
the random permutation function π), we calcu-
late the hamming distance of every vector with
2
The jumbling is performed by a mapping of the bit index
as directed by the random permutation function. For a given
permutation, we reorder the bit indexes of all vectors in similar
fashion. This process could be considered as column reording
of bit vectors.
624
B of its closest neighbors in the sorted list. If
the hamming distance is below a certain prede-
termined threshold, we output the pair of vec-
tors with their cosine similarity (as calculated
by equation 4). Thus, B is the beam parameter
of the search. This step takes O(n), since we
can assume B, q, d to be a constant.
Why does the fast hamming distance algorithm
work? The intuition is that the number of bit
streams, d, for each vector is generally smaller than
the number of vectors n (ie. d << n). Thus, sort-
ing the vectors lexicographically after jumbling the
bits will likely bring vectors with lower hamming
distance closer to each other in the sorted lists.
Overall, the algorithm takes O(nk +nlogn) time.
However, for noun clustering, we generally have the
number of nouns, n, smaller than the number of fea-
tures, k. (i.e., n < k). This implies logn << k and
nlogn << nk. Hence the time complexity of our
algorithm is O(nk + nlogn) ≈ O(nk). This is a
huge saving from the original O(n
2
k) algorithm. In
the next section, we proceed to apply this technique
for generating noun similarity lists.
4 Building Noun Similarity Lists
A lot of work has been done in the NLP community
on clustering words according to their meaning in
text (Hindle, 1990; Lin, 1998). The basic intuition
is that words that are similar to each other tend to
occur in similar contexts, thus linking the semantics
of words with their lexical usage in text. One may
ask why is clustering of words necessary in the first
place? There may be several reasons for clustering,
but generally it boils down toone basic reason: if the
words that occur rarely in a corpus are found to be
distributionally similar to more frequently occurring
words, then one may be able to make better infer-
ences on rare words.
However, to unleash the real power of clustering
one has to work with large amounts of text. The
NLP community has started working on noun clus-
tering on a few gigabytes of newspaper text. But
with the rapidly growing amount of raw text avail-
able on the web, one could improve clustering per-
formance by carefully harnessing its power. A core
component of most clustering algorithms used in the
NLP community is the creation of a similarity ma-
trix. These algorithms are of complexity O(n
2
k),
where n is the number of unique nouns and k is the
feature set length. These algorithms are thus not
readily scalable, and limit the size of corpus man-
ageable in practice to a few gigabytes. Clustering al-
gorithms for words generally use the cosine distance
for their similarity calculation (Salton and McGill,
1983). Hence instead of using the usual naive cosine
distance calculation between every pair of words we
can use the algorithm described in Section 3 to make
noun clustering web scalable.
To test our algorithm we conduct similarity based
experiments on 2 different types of corpus: 1. Web
Corpus (70 million web pages, 138GB), 2. Newspa-
per Corpus (6 GB newspaper corpus)
4.1 Web Corpus
We set up a spider to download roughly 70 million
web pages from the Internet. Initially, we use the
links from Open Directory project
3
as seed links for
our spider. Each webpage is stripped of HTML tags,
tokenized, and sentence segmented. Each docu-
ment is language identified by the software TextCat
4
which implements the paper by Cavnar and Trenkle
(1994). We retain only English documents. The web
contains a lot of duplicate or near-duplicate docu-
ments. Eliminating them is critical for obtaining bet-
ter representation statistics from our collection. The
problem of identifying near duplicate documents in
linear time is not trivial. We eliminate duplicate and
near duplicate documents by using the algorithm de-
scribed by Kolcz et al. (2004). This process of dupli-
cate elimination is carried out in linear time and in-
volves the creation of signatures for each document.
Signatures are designed so that duplicate and near
duplicate documents have the same signature. This
algorithm is remarkably fast and has high accuracy.
This entire process of removing non English docu-
ments and duplicate (and near-duplicate) documents
reduces our document set from70 million web pages
to roughly 31 million web pages. This represents
roughly 138GB of uncompressed text.
We identify all the nouns in the corpus by us-
ing a noun phrase identifier. For each noun phrase,
we identify the context words surrounding it. Our
context window length is restricted to two words to
3
/>4
/>625
Table 1: Corpus description
Corpus Newspaper Web
Corpus Size 6GB 138GB
Unique Nouns 65,547 655,495
Feature size 940,154 1,306,482
the left and right of each noun. We use the context
words as features of the noun vector.
4.2 Newspaper Corpus
We parse a 6 GB newspaper (TREC9 and
TREC2002 collection) corpus using the dependency
parser Minipar (Lin, 1994). We identify all nouns.
For each noun we take the grammatical context of
the noun as identified by Minipar
5
. We do not use
grammatical features in the web corpus since pars-
ing is generally not easily web scalable. This kind of
feature set does not seem to affect our results. Cur-
ran and Moens (2002) also report comparable results
for Minipar features and simple word based proxim-
ity features. Table 1 gives the characteristics of both
corpora. Since we use grammatical context, the fea-
ture set is considerably larger than the simple word
based proximity feature set for the newspaper cor-
pus.
4.3 Calculating Feature Vectors
Having collected all nouns and their features, we
now proceed to construct feature vectors (and
values) for nouns from both corpora using mu-
tual information (Church and Hanks, 1989). We
first construct a frequency count vector C(e) =
(c
e1
, c
e2
, , c
ek
), where k is the total number of
features and c
ef
is the frequency count of feature
f occurring in word e. Here, c
ef
is the number
of times word e occurred in context f. We then
construct a mutual information vector MI(e) =
(mi
e1
, mi
e2
, , mi
ek
) for each word e, where mi
ef
is the pointwise mutual information between word e
and feature f, which is defined as:
mi
ef
= log
c
ef
N
n
i=1
c
if
N
×
k
j=1
c
ej
N
(6)
where n is the number of words and N =
5
We perform this operation so that we can compare the per-
formance of our system to that of Pantel and Lin (2002).
n
i=1
m
j=1
c
ij
is the total frequency count of all
features of all words.
Having thus obtained the feature representation of
each noun we can apply the algorithm described in
Section 3 to discover similarity lists. We report re-
sults in the next section for both corpora.
5 Evaluation
Evaluating clustering systems is generally consid-
ered to be quite difficult. However, we are mainly
concerned with evaluating the quality and speed of
our high speed randomized algorithm. The web cor-
pus is used to show that our framework is web-
scalable, while the newspaper corpus is used to com-
pare the output of our system with the similarity lists
output by an existing system, which are calculated
using the traditional formula as given in equation
1. For this base comparison system we use the one
built by Pantel and Lin (2002). We perform 3 kinds
of evaluation: 1. Performance of Locality Sensitive
Hash Function; 2. Performance of fast Hamming
distance search algorithm; 3. Quality of final simi-
larity lists.
5.1 Evaluation of Locality sensitive Hash
function
To perform this evaluation, we randomly choose 100
nouns (vectors) from the web collection. For each
noun, we calculate the cosine distance using the
traditional slow method (as given by equation 1),
with all other nouns in the collection. This process
creates similarity lists for each of the 100 vectors.
These similarity lists are cut off at a threshold of
0.15. These lists are considered to be the gold stan-
dard test set for our evaluation.
For the above 100 chosen vectors, we also calcu-
late the cosine similarity using the randomized ap-
proach asgiven byequation 4and calculate the mean
squared error with the gold standard test set using
the following formula:
error
av
=
i
(CS
real,i
− CS
calc,i
)
2
/total
(7)
where CS
real,i
and CS
calc,i
are the cosine simi-
larity scores calculated using the traditional (equa-
tion 1) and randomized (equation 4) technique re-
626
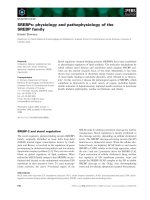
Table 2: Error in cosine similarity
Number of ran-
dom vectors d
Average error in
cosine similarity
Time (in hours)
1 1.0000 0.4
10 0.4432 0.5
100 0.1516 3
1000 0.0493 24
3000 0.0273 72
10000 0.0156 241
spectively. i is the index over all pairs of elements
that have CS
real,i
>= 0.15
We calculate the error (error
av
) for various val-
ues of d, the total number of unit random vectors r
used in the process. The results are reported in Table
2
6
. As we generate more random vectors, the error
rate decreases. For example, generating 10 random
vectors gives us a cosine error of 0.4432 (which is a
large number since cosine similarity ranges from 0
to 1.) However, generation of more random vectors
leads to reduction in error rate as seen by the val-
ues for 1000 (0.0493) and 10000 (0.0156). But as
we generate more random vectors the time taken by
the algorithm also increases. We choose d = 3000
random vectors as our optimal (time-accuracy) cut
off. It is also very interesting to note that by using
only 3000 bits for each of the 655,495 nouns, we
are able to measure cosine similarity between every
pair of them to within an average error margin of
0.027. This algorithm is also highly memory effi-
cient since we can represent every vector by only a
few thousand bits. Also the randomization process
makes the the algorithm easily parallelizable since
each processor can independently contribute a few
bits for every vector.
5.2 Evaluation of Fast Hamming Distance
Search Algorithm
We initially obtain a list of bit streams for all the
vectors (nouns) from our web corpus using the ran-
domized algorithm described in Section 3 (Steps 1
to 3). The next step involves the calculation of ham-
ming distance. To evaluate the quality of this search
algorithm we again randomly choose 100 vectors
(nouns) from our collection. For each of these 100
vectors wemanually calculate the hamming distance
6
The time is calculated for running the algorithm on a single
Pentium IV processor with 4GB of memory
with all other vectors in the collection. We only re-
tain those pairs of vectors whose cosine distance (as
manually calculated) is above 0.15. This similarity
list is used as the gold standard test set for evaluating
our fast hamming search.
We then apply the fast hamming distance search
algorithm as described in Section 3. In particular, it
involves steps 3 to 6 of the algorithm. We evaluate
the hamming distance with respect to two criteria: 1.
Number of bit index random permutations functions
q; 2. Beam search parameter B.
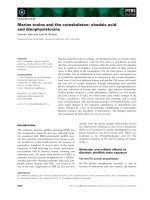
For each vector in the test collection, we take the
top N elements from the gold standard similarity list
and calculate how many of these elements are actu-
ally discovered by the fast hamming distance algo-
rithm. We report the results in Table 3 and Table 4
with beam parameters of (B = 25) and (B = 100)
respectively. For each beam, we experiment with
various values for q, the number of random permu-
tation function used. In general, by increasing the
value for beam B and number of random permu-
tation q , the accuracy of the search algorithm in-
creases. For example in Table 4 by using a beam
B = 100 and using 1000 random bit permutations,
we are able to discover 72.8% of the elements of the
Top 100 list. However, increasing thevalues of q and
B also increases search time. With a beam (B) of
100 and the number of random permutations equal
to 100 (i.e., q = 1000) it takes 570 hours of process-
ing time on a single Pentium IV machine, whereas
with B = 25 and q = 1000, reduces processing time
by more than 50% to 240 hours.
We could not calculate the total time taken to
build noun similarity list using the traditional tech-
nique on the entire corpus. However, we estimate
that its time taken would be at least 50,000 hours
(and perhaps even more) with a few of Terabytes of
disk space needed. This is a very rough estimate.
The experiment was infeasible. This estimate as-
sumes the widely used reverse indexing technique,
where in one compares only those vector pairs that
have at least one feature in common.
5.3 Quality of Final Similarity Lists
For evaluating the quality of our final similarity lists,
we use the system developed by Pantel and Lin
(2002) as gold standard on a much smaller data set.
We use the same 6GB corpus that was used for train-
627
Table 3: Hamming search accuracy (Beam B = 25)
Random permutations q Top 1 Top 5 Top 10 Top 25 Top 50 Top 100
25 6.1% 4.9% 4.2% 3.1% 2.4% 1.9%
50 6.1% 5.1% 4.3% 3.2% 2.5% 1.9%
100 11.3% 9.7% 8.2% 6.2% 5.7% 5.1%
500 44.3% 33.5% 30.4% 25.8% 23.0% 20.4%
1000 58.7% 50.6% 48.8% 45.0% 41.0% 37.2%
Table 4: Hamming search accuracy (Beam B = 100)
Random permutations q Top 1 Top 5 Top 10 Top 25 Top 50 Top 100
25 9.2% 9.5% 7.9% 6.4% 5.8% 4.7%
50 15.4% 17.7% 14.6% 12.0% 10.9% 9.0%
100 27.8% 27.2% 23.5% 19.4% 17.9% 16.3%
500 73.1% 67.0% 60.7% 55.2% 53.0% 50.5%
1000 87.6% 84.4% 82.1% 78.9% 75.8% 72.8%
ing by Pantel and Lin (2002) so that the results are
comparable. We randomly choose 100 nouns and
calculate the top N elements closest to each noun in
the similarity lists using the randomized algorithm
described in Section 3. We then compare this output
to the one provided by the system of Pantel and Lin
(2002). For every noun in the top N list generated
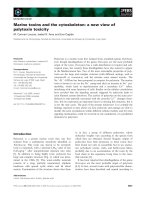
by our system we calculate the percentage overlap
with the gold standard list. Results are reported in
Table 5. The results shows that we are able to re-
trieve roughly 70% of the gold standard similarity
list. In Table 6, we list the top 10 most similar words
for some nouns, as examples, from the web corpus.
6 Conclusion
NLP researchers have just begun leveraging the vast
amount of knowledge available on the web. By
searching IR engines for simple surface patterns,
many applications ranging from word sense disam-
biguation, question answering, and mining seman-
tic resources have already benefited. However, most
language analysis tools are too infeasible to run on
the scale of the web. A case in point is generat-
ing noun similarity lists using co-occurrence statis-
tics, which has quadratic running time on the input
size. In this paper, we solve this problem by pre-
senting a randomized algorithm that linearizes this
task and limits memory requirements. Experiments
show that our method generates cosine similarities
between pairs of nouns within a score of 0.03.
In many applications, researchers have shown that
more data equals better performance (Banko and
Brill, 2001; Curran and Moens, 2002). Moreover,
at the web-scale, we are no longer limited to a snap-
shot in time, which allows broader knowledge to be
learned and processed. Randomized algorithms pro-
vide the necessary speed and memory requirements
to tap into terascale text sources. We hope that ran-
domized algorithms will make other NLP tools fea-
sible at the terascale and we believe that many al-
gorithms will benefit from the vast coverage of our
newly created noun similarity list.
Acknowledgement
We wish to thank USC Center for High Performance
Computing and Communications (HPCC) for help-
ing us use their cluster computers.
References
Banko, M. and Brill, E. 2001. Mitigating the paucity of dat-
aproblem. In Proceedings of HLT. 2001. San Diego, CA.
Box, G. E. P. and M. E. Muller 1958. Ann. Math. Stat. 29,
610–611.
Broder, Andrei 1997. On the Resemblance and Containment of
Documents. Proceedings of the Compression and Complex-
ity of Sequences.
Cavnar, W. B. and J. M. Trenkle 1994. N-Gram-Based Text
Categorization. In Proceedings of Third Annual Symposium
on Document Analysis and Information Retrieval, Las Ve-
gas, NV, UNLV Publications/Reprographics, 161–175.
628
Table 5: Final Quality of Similarity Lists
Top 1 Top 5 Top 10 Top 25 Top 50 Top 100
Accuracy 70.7% 71.9% 72.2% 71.7% 71.2% 71.1%
Table 6: Sample Top 10 Similarity Lists
JUST DO IT computer science TSUNAMI Louis Vuitton PILATES
HAVE A NICE DAY mechanical engineering tidal wave PRADA Tai Chi
FAIR AND BALANCED electrical engineering LANDSLIDE Fendi Cardio
POWER TO THE PEOPLE chemical engineering EARTHQUAKE Kate Spade SHIATSU
NEVER AGAIN Civil Engineering volcanic eruption VUITTON Calisthenics
NO BLOOD FOR OIL ECONOMICS HAILSTORM BURBERRY Ayurveda
KINGDOM OF HEAVEN ENGINEERING Typhoon GUCCI Acupressure
If Texas Wasn’t Biology Mudslide Chanel Qigong
BODY OF CHRIST environmental science windstorm Dior FELDENKRAIS
WE CAN PHYSICS HURRICANE Ferragamo THERAPEUTIC TOUCH
Weld with your mouse information science DISASTER Ralph Lauren Reflexology
Charikar, Moses 2002. Similarity Estimation Techniques from
Rounding Algorithms In Proceedings of the 34th Annual
ACM Symposium on Theory of Computing.
Church, K. and Hanks, P. 1989. Word association norms, mu-
tual information, and lexicography. In Proceedings of ACL-
89. pp. 76–83. Vancouver, Canada.
Curran, J. and Moens, M. 2002. Scaling context space. In
Proceedings of ACL-02 pp 231–238, Philadelphia, PA.
Goemans, M. X. and D. P. Williamson 1995. Improved Ap-
proximation Algorithms for Maximum Cut and Satisfiability
Problems Using Semidefinite Programming. JACM 42(6):
1115–1145.
Hindle, D. 1990. Noun classification from predicate-argument
structures. In Proceedings of ACL-90. pp. 268–275. Pitts-
burgh, PA.
Lin, D. 1998. Automatic retrieval and clustering of similar
words. In Proceedings of COLING/ACL-98. pp. 768–774.
Montreal, Canada.
Indyk, P., Motwani, R. 1998. Approximate nearest neighbors:
towards removing the curse of dimensionality Proceedings
of 30th STOC, 604–613.
A. Kolcz, A. Chowdhury, J. Alspector 2004. Improved ro-
bustness of signature-based near-replica detection via lexi-
con randomization. Proceedings of ACM-SIGKDD (2004).
Lin, D. 1994 Principar - an efficient, broad-coverage,
principle-based parser. Proceedings of COLING-94, pp. 42–
48. Kyoto, Japan.
Pantel, Patrick and Dekang Lin 2002. Discovering Word
Senses from Text. In Proceedings of SIGKDD-02, pp. 613–
619. Edmonton, Canada
Rabin, M. O. 1981. Fingerprinting by random polynomials.
Center for research in Computing technology , Harvard Uni-
versity, Report TR-15-81.
Salton, G. and McGill, M. J. 1983. Introduction to Modern
Information Retrieval. McGraw Hill.
Appendix A. Random Permutation
Functions
We define [n] = {0, 1, 2, , n − 1}.
[n] can thus be considered as a set of integers from
0 to n − 1.
Let π : [n] → [n] be a permutation function chosen
at random from the set of all such permutation func-
tions.
Consider π : [4] → [4].
A permutation function π is a one to one mapping
from the set of [4] to the set of [4].
Thus, one possible mapping is:
π : {0, 1, 2, 3} → {3, 2, 1, 0}
Here it means: π(0) = 3, π(1) = 2, π(2) = 1,
π(3) = 0
Another possible mapping would be:
π : {0, 1, 2, 3} → {3, 0, 1, 2}
Here it means: π(0) = 3, π(1) = 0, π(2) = 1,
π(3) = 2
Thus for the set [4] there would be 4! = 4∗3∗2 =
24 possibilities. In general, for a set [n] there would
be n! unique permutation functions. Choosing a ran-
dom permutation function amounts to choosing one
of n! such functions at random.
629