Báo cáo khoa học: Structural diversity in lipopolysaccharide expression in nontypeable Haemophilus influenzae Identification of L-glycero -D-manno-heptose in the outer-core region in three clinical isolates potx
Bạn đang xem bản rút gọn của tài liệu. Xem và tải ngay bản đầy đủ của tài liệu tại đây (666.14 KB, 15 trang )
Structural diversity in lipopolysaccharide expression in nontypeable
Haemophilus influenzae
Identification of
L
-
glycero
-
D
-
manno
-heptose in the outer-core region in three clinical
isolates
Martin Ma
˚
nsson
1
, Derek W. Hood
2
, E. Richard Moxon
2
and Elke K. H. Schweda
1
1
Clinical Research Centre, Karolinska Institutet and University College of South Stockholm, Huddinge, Sweden;
2
Molecular Infectious Diseases Group and Department of Paediatrics, Weatherall Institute of Molecular Medicine,
John Radcliffe Hospital, Oxford, UK
Structural elucidation of the lipopolysaccharide (LPS) from
three nontypeable Haemophilus influenzae clinical isolates,
1209, 1207 and 1233 was achieved using NMR spectro-
scopy and ESI-MS on O-deacylated LPS and core oligo-
saccharide (OS) material as well as ESI-MS
n
on
permethylated dephosphorylated OS. It was found that the
organisms expressed a tremendous heterogeneous glyco-
form mixture resulting from the variable length of the OS
chains attached to the common structural element of
H. influenzae,
L
-a-
D
–Hepp-(1fi2)-[PEtnfi6]-
L
-a-
D
–Hepp-
(1fi3)-[b-
D
-Glcp-(1fi4)]-
L
-a-
D
–Hepp-(1fi5)-[PPEtnfi4]-
a-Kdop-(2fi6)-Lipid A. Notably, the O-6 position of the
b-
D
-Glcp residue could either be occupied by PCho or
L
-glycero-
D
-manno-heptose (
L
,
D
–Hep), which is a location
for
L
,
D
–Hep that has not been seen previously in
H. influenzae LPS. The outer-core
L
,
D
–Hep residue was
further chain elongated at the O-6 position by the struc-
tural element b-
D
-GalpNAc-(1fi3)-a-
D
-Galp-(1fi4)-b-
D
-
Galp, or sequentially truncated versions thereof. The distal
heptose residue in the inner-core was found to be chain
elongated at O-2 by the globotetraose unit, b-
D
-GalpNAc-
(1fi3)-a-
D
-Galp-(1fi4)-b-
D
-Galp-(1fi4)-b-
D
-Glcp,or
sequentially truncated versions thereof. Investigation of
LPS from an lpsA mutant of isolate 1233 and a lic1 mutant
of isolate 1209 was also performed, which aside from
confirming the functions of the gene products, simplified
elucidation of the OS extending from the proximal heptose
(the lpsA mutant), and showed that the organism exclu-
sively expresses LPS glycoforms comprising the outer-core
L
,
D
–Hep residue when PCho is not expressed (the lic1
mutant).
Keywords: Haemophilus; lipopolysaccharide;
L
-glycero-
D
-manno-heptose; phase variation; ESI-MS
n
.
Haemophilus influenzae is an important cause of human
disease worldwide and is found in both encapsulated (types
a–f) and unencapsulated (nontypeable) forms. Nontypeable
H. influenzae (NTHi) strains routinely colonize the naso-
pharynx of healthy carriers and cause otitis media and
respiratory tract infections [1]. The outer membrane com-
ponent lipopolysaccharide (LPS) can influence each stage of
the pathogenesis of H. influenzae infection. H. influenzae
LPS is composed of a membrane-bound lipid A moiety
connected to the core oligosaccharide (OS) via a single
phosphorylated 3-deoxy-
D
-manno-oct-2-ulosonic acid (Kdo)
residue. The carbohydrate regions provide targets for
recognition by host immune responses and expression of
certain OS epitopes can alter the virulence of the pathogen
[2]. Some of these OS epitopes have been found to mimic
human antigens, possibly allowing the bacteria to evade the
host immune system [3,4]. The OS portion of H. influenzae
LPS is subject to high-frequency phase variation (on/off
switching of expression) of terminal epitopes, contributing
to the vast LPS heterogeneity usually found within a single
strain [2]. This heterogeneity may be an advantage to the
bacteria, allowing them to better confront different host
compartments and microenvironments and to survive the
host immune response [5]. The availability of the complete
genome sequence of H. influenzae strain Rd [6] has facili-
tated a comprehensive study of LPS biosynthetic loci in the
homologous strain RM118 [7] and in the type b strains
Eagan (RM153) and RM7004 [8]. Gene functions have been
identified that are responsible for most of the steps in the
biosynthesis of the OS portion of their LPS molecules.
Correspondence to E. Schweda, University College of
South Stockholm, Clinical Research Centre, NOVUM,
S-141 86 Huddinge, Sweden.
Fax: + 46 8585 838 20, Tel.: + 46 8585 838 23,
E-mail:
Abbreviations: CE, capillary electrophoresis; Kdo, 3-deoxy-
D
-manno-
oct-2-ulosonic acid; AnKdo-ol, reduced anhydro Kdo; Hep,
heptose;
D
,
D
-Hep,
D
-glycero-
D
-manno-heptose;
L
,
D
-Hep,
L
-glycero-
D
-manno-heptose; Hex, hexose; HexNAc, N-acetylhexos-
amine; HMBC, heteronuclear multiple-bond correlation; lipid A-OH,
O-deacylated lipid A; LPS, lipopolysaccharide; LPS-OH,
O-deacylated LPS; MS
n
, multiple step tandem mass spectrometry;
Neu5Ac, N-acetylneuraminic acid; NTHi, nontypeable Haemophilus
influenzae; OS, oligosaccharide; PCho, phosphocholine; PEtn,
phosphoethanolamine; PPEtn, pyrophosphoethanolamine.
(Received 5 September 2002, revised 19 November 2002,
accepted 26 November 2002)
Eur. J. Biochem. 270, 610–624 (2003) Ó FEBS 2003 doi:10.1046/j.1432-1033.2003.03399.x
Molecular structural studies of LPS from H. influenzae
strains [9–19] have resulted in a structural model consisting
of a conserved phosphoethanolamine (PEtn)-substituted
triheptosyl inner-core moiety (labelled HepI–HepIII) in
which each of the heptose residues can provide a point for
attachment of OS chains or noncarbohydrate substituents
(Scheme 1). HepIII and the b-
D
-Glcp residue that is linked
to HepI (labelled GlcI) have an especially wide range of
alternatives in the substitution-pattern. HepIII has been
found to be substituted by a b-
D
-Glcp residue either at O-2
[12] or O-3 [15]. Alternatively, substitution can occur by a
b-
D
-Galp residue either at O-2 [10] or O-3 [18]. Analysis of
LPS from lpsA mutants established in a number of strain
backgrounds supports a role for LpsA in each of the
alternative glycose substitutions of HepIII. HepIII has also
been found to be substituted by the noncarbohydrate
substituents Ac (either at O-2 [15] or O-3 [14]), Gly [15,20],
P (at O-4 [11]) and PEtn [9]. For GlcI, the O-4 position has
been found to be substituted by a b-
D
-Galp residue [9] or a
b-
D
-Glcp residue [10], while in other strains, O-6 was
substituted by phosphocholine (PCho) [12] or
D
-glycero-
D
-manno-heptose (
D
,
D
–Hep) [13]. In NTHi strains SB 33
and 176 [16,18], disubstitution by b-
D
-Glcp (at O-4) and
PCho (at O-6) occurs, while in strain RM118 [19],
disubstitution by b-
D
-Galp (atO-4)andPCho (at O-6)
was found. In NTHi strain 1003 [17], disubstitution by Ac
(at O-4) and PCho (at O-6) was shown. In each strain
analysed, PCho addition has been shown to be directed by
the products of the lic1 locus. Our recent studies have
focussed on the structural diversity of LPS expression and
the genetic basis for that diversity in a representative set
consisting of 24 NTHi clinical isolates obtained from otitis
media patients. In the present study we report on the
structural analysis of LPS from three of these isolates (1209,
1207 and 1233) which introduces a new glycosyl substituent
on GlcI.
Experimental procedures
Bacterial strains used in this study
NTHi middle ear isolates 1209, 1207 and 1233 were obtained
from the Finnish Otitis Media Study Group [20a]. Isolates
1209 and 1207 are from a single patient on the same day but
from different ears. 1233 was isolated from a different patient
on a different date. Molecular epidemiological data follow-
ing DNA sequence analysis showed that 1233 is identical
to 1209 and 1207 except for one nucleotide change in
one of the housekeeping genes investigated (unpublished
results). Strains 1233lpsA and 1209lic1 were constructed
by transformation of the designated isolate with plasmid
clones containing the relevant gene(s) interrupted by an
antibiotic resistance cassette, as described previously [7,8].
Bacterial cultivation and preparation of LPS
Bacteria were grown in brain-heart infusion broth supple-
mented with haemin (10 lgÆmL
)1
)andNAD(2lgÆmL
)1
).
LPS was extracted from lyophilized bacteria by using
phenol/chloroform/light petroleum, as described by Galanos
et al. [21], but modified with a precipitation step of the LPS
with diethyl ether/acetone (1 : 5, v/v; 6 vol.). LPS was
purified by ultracentrifugation (82 000 g,4°C, 12 h).
Chromatography
Gel filtration chromatography and GLC were carried out as
described previously [15].
Preparation of OS material
O-Deacylation of LPS. O-Deacylation of LPS was achi-
eved with anhydrous hydrazine as described previously
[15,22].
Mild acid hydrolysis of LPS. Reduced core OS material
was obtained after mild acid hydrolysis (1% aqueous acetic
acid, pH 3.1, 100 °C, 2 h) and simultaneous reduction
(borane-N-methylmorpholine complex) of LPS from 1209
(120 mg), 1207, 1233, 1233lpsA (75 mg) and 1209lic1.The
insoluble lipid A was separated by centrifugation and the
water-soluble part was purified by gel filtration, giving one
major OS-containing fraction from 1209 (OS-1, 22.5 mg),
1207, 1233, 1233lpsA (OS-2, 8.0 mg) and 1209lic1.AnNH
3
-
treatedpartofOS-1(OS-1¢) was repeatedly chromato-
graphed, giving a major (OS-1¢-A, 4.4 mg) and a minor
(OS-1¢-B, 1.0 mg) fraction. OS-2 was rechromatographed,
resulting in i.a. OS-2-A (3.0 mg) and OS-2-B (1.8 mg).
Dephosphorylation of OS. Dephosphorylation of OS
material was performed with 48% aqueous HF as described
previously [17].
Mass spectrometry
GLC-MS was carried out with a Hewlett-Packard 5890
chromatograph equipped with a NERMAG R10–10H
quadrupole mass spectrometer. ESI-MS was performed as
described previously [15]. ESI-MS
n
on permethylated
dephosphorylated OS was performed on a Finnigan-MAT
LCQ ion trap mass spectrometer (Finnigan-MAT, San
Jose, CA, USA) in the positive ion mode. The samples
were dissolved in methanol/water (7 : 3) containing 1 m
M
NaOAc to a concentration of about 1 mgÆmL
)1
,andwere
injected into a running solvent of identical composition at
10 lLÆmin
)1
.
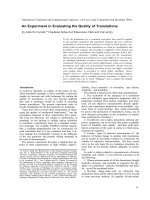
Scheme 1. R
1
¼ H, PCho or
D
,
D
–Hep, R
2
,R
4
,R
5
¼ H, Glc, Gal or
Ac, R
3
¼ HorGlc,Y¼ Gly, P or PEtn.
Ó FEBS 2003
L
,
D
–Hep in the outer-core region of NTHi LPS (Eur. J. Biochem. 270) 611
NMR spectroscopy
NMR spectra were obtained at 22 °CforOSandLPS-OH
samples either on a Varian UNITY 600 MHz spectrometer
as described previously [15,17] or on a JEOL JNM-ECP500
spectrometer using the previously described experiments
[15,17], except that a mixing time of 200 ms was used in all
NOESY experiments.
Analytical methods
Sugars were identified as their alditol acetates as previously
described [23]. Methylation analysis was performed as
described earlier [15]. The relative proportions of the various
alditol acetates and partially methylated alditol acetates
obtained in sugar- and methylation analyses correspond to
the detector response of the GLC-MS. Permethylation of
dephosphorylated OS was performed in the same way as in
the methylation analyses [15] but without the prior acety-
lation step. The absolute configurations of the hexoses were
determined by the method devised by Gerwig et al.[24].The
total content of fatty acids was analysed as described
previously [25].
Results
NTHi isolates 1209, 1207 and 1233 and selected mutant
strains were cultivated in liquid media and the LPS was
extracted using the phenol/chloroform/light petroleum
method.
Characterization of LPS from NTHi isolate 1209
Compositional sugar analysis of the LPS sample indicated
D
-glucose (Glc),
D
-galactose (Gal), 2-amino-2-deoxy-
D
-glucose (GlcN) and
L
-glycero-
D
-manno-heptose (
L
,
D
–
Hep) in the ratio 31 : 43 : 1 : 25, as identified by GLC-
MS of their corresponding alditol acetate and 2-butyl
glycoside derivatives [24]. As described earlier, the LPS
contained ester-linked glycine [20] and a low level of
N-acetylneuraminic acid (Neu5Ac) [26] as shown by high-
performance anion-exchange chromatography, following
treatment of samples with 0.1
M
NaOH and neuraminidase,
respectively.
Treatment of the LPS with anhydrous hydrazine under
mild conditions afforded water-soluble O-deacylated
material (LPS-OH). ESI-MS data (Table 1) indicated a
heterogeneous mixture of glycoforms consistent with each
molecular species containing a conserved PEtn-substituted
triheptosyl inner-core moiety attached via a phosphorylated
Kdo linker to the putative O-deacylated lipid A (lipid
A-OH). Quadruply charged ions were observed at m/z
650.1/680.8 (major) and at m/z 690.4/721.2 corresponding
to glycoforms with the respective compositions PCho•
Hex
3
•Hep
3
•PEtn
1)2
•P
1
•Kdo•Lipid A-OH and PCho•
Hex
4
•Hep
3
•PEtn
1)2
•P
1
•Kdo•Lipid A-OH (Fig. 1). Quad-
ruply charged ions were also observed at m/z 697.2/728.0
and at m/z 737.7/768.6 (minor) indicating the presence of
glycoforms containing four heptose residues with the
compositions Hex
4
•Hep
4
•PEtn
1)2
•P
1
•Kdo•Lipid A-OH
and Hex
5
•Hep
4
•PEtn
1)2
•P
1
•Kdo•Lipid A-OH, respect-
ively. Quadruply charged ions of very low abundance could
also be observed at m/z 609.4/640.4 and at m/z 741.2/772.1
consistent with the respective compositions PCho•Hex
2
•
Hep
3
•PEtn
1)2
•P
1
•Kdo•Lipid A-OH and PCho•HexNAc
1
•
Hex
4
•Hep
3
•PEtn
1)2
•P
1
•Kdo•Lipid A-OH. Thus, ESI-MS
data indicated the presence of two subpopulations of
glycoforms; a major subpopulation in which the glycoform
compositions comprised three heptoses and PCho (Hep3-
glycoforms), and a minor subpopulation with compositions
comprising four heptoses but lacking PCho (Hep4-glyco-
forms). NTHi LPS glycoforms with four heptoses have
previously been observed ([13], M. Ma
˚
nsson, E. R. Moxon
and E. K. H. Schweda, unpublished results), and in those
cases the fourth heptose has the
D
-glycero-
D
-manno-confi-
guration and is situated in the outer-core region of the LPS.
As
D
,
D
–Hep was completely absent in the sugar analysis,
it was concluded that the fourth heptose here has the
L
-glycero-
D
-manno-configuration.
Characterization of OS from NTHi isolate 1209
Partial acid hydrolysis of LPS with dilute aqueous acetic
acid afforded an insoluble lipid A and core OS material,
Table 1. Negative ion ESI-MS data and proposed compositions for LPS-OH of NTHi isolate 1209. Average mass units were used for calculation of
molecular mass values based on proposed compositions as follows: Hex, 162.14; Hep, 192.17; Kdo, 220.18; P, 79.98; PEtn, 123.05; PCho, 165.13
and Lipid A-OH, 953.02. Relative abundance was estimated from the area of molecular ion peak relative to the total area (expressed as percentage).
Peaks representing less than 5% of the base peak are not included in the table. Very minor amounts of glycoforms with the compositions
PCho•Hex
2
•Hep
3
•PEtn
1)2
•P
1
•Kdo•Lipid A-OH and PCho•HexNAc
1
•Hex
4
•Hep
3
•PEtn
1)2
•P
1
•Kdo•LipidA-OHwerealsoindicatedby
quadruply charged ions at m/z 609.4/640.4 and at m/z 741.2/772.1.
Observed ions (m/z) Molecular mass (Da)
Relative
abundance (%) Proposed composition
(M-4H)
4–
(M-3H)
3–
Observed Calculated
650.1 866.9 2604.0 2604.3 20 PCho•Hex
3
•Hep
3
•PEtn
1
•P
1
•Kdo•Lipid A-OH
680.8 908.0 2727.1 2727.3 43 PCho•Hex
3
•Hep
3
•PEtn
2
•P
1
•Kdo•Lipid A-OH
690.4 920.7 2765.4 2766.4 8 PCho•Hex
4
•Hep
3
•PEtn
1
•P
1
•Kdo•Lipid A-OH
721.2 962.0 2888.9 2889.5 7 PCho•Hex
4
•Hep
3
•PEtn
2
•P
1
•Kdo•Lipid A-OH
697.2 930.0 2792.9 2793.5 6 Hex
4
•Hep
4
•PEtn
1
•P
1
•Kdo•Lipid A-OH
728.0 970.9 2915.8 2916.5 12 Hex
4
•Hep
4
•PEtn
2
•P
1
•Kdo•Lipid A-OH
737.7 983.7 2954.4 2955.6 2 Hex
5
•Hep
4
•PEtn
1
•P
1
•Kdo•Lipid A-OH
768.6 1025.0 3078.2 3078.7 2 Hex
5
•Hep
4
•PEtn
2
•P
1
•Kdo•Lipid A-OH
612 M. Ma
˚
nsson et al. (Eur. J. Biochem. 270) Ó FEBS 2003
which was purified by gel filtration chromatography, giving
OS-1. ESI-MS indicated OS-1 to contain O-acetylated (0–3
Ac) and/or O-glycylated glycoforms (0–2 Gly), where the
most abundant peaks within each subpopulation of glyco-
forms corresponded to compositions comprising two acetyl
groups but lacking glycine (data not shown). On treatment
of OS-1 with 1% aqueous NH
3
(giving OS-1¢), ESI-MS
showed major doubly charged ions at m/z 785.3 and 879.9
corresponding to the respective compositions PCho•Hex
3
•
Hep
3
•PEtn
1
•AnKdo-ol and Hex
4
•Hep
4
•PEtn
1
•AnKdo-ol
(Table 2).
In order to obtain sequence and branching information,
OS-1 was dephosphorylated and permethylated and sub-
jected to ESI-MS
n
[27,28]. Due to the increased MS
response obtained by permethylation in combination with
added sodium acetate [27], several glycoforms were
observed in the MS spectra (positive mode) that were not
detected in underivatized samples (Fig. 2A). Sodiated
adduct ions were identified corresponding to the composi-
tions Hex
1)6
•Hep
3
•AnKdo-ol, HexNAc
1
•Hex
4)5
•Hep
3
•
AnKdo-ol, Hex
2)6
•Hep
4
•AnKdo-ol and HexNAc
1
•
Hex
5)6
•Hep
4
•AnKdo-ol (Tables 3 and 4). The monosac-
charide sequence and branching for the different glycoforms
were obtained following collision-induced dissociation
(CID) of the glycosidic bonds [27,28]. Through the ion
mass distinction between reducing, nonreducing and inter-
nal fragments resulting from the bond ruptures [27], the
topology could be determined for all compositions found in
the MS profiling spectrum (Tables 3 and 4). For most
compositions, the presence of several (2–3) isomeric com-
pounds were revealed by identifying product ions in the
MS
2
spectra resulting from glycosidic cleavage between the
heptose residues. MS
3
experiments were employed when
necessary to confirm the structures.
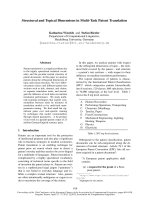
Fig. 1. Negative ion ESI-MS spectrum of O-deacylated LPS from NTHi isolate 1209 showing quadruply charged ions. The peak at m/z 650.1
corresponds to a glycoform with the composition PCho•Hex
3
•Hep
3
•PEtn
1
•P
1
•Kdo•Lipid A-OH. The peak at m/z 697.2 corresponds to a
glycoform with the composition Hex
4
•Hep
4
•PEtn
1
•P
1
•Kdo•Lipid A-OH. Sodiated adduct ions are indicated by asterisks (*).
Table 2. Negative ion ESI-MS data and proposed compositions for NH
3
-treated OS preparations OS-1¢,OS-1¢-A and OS-1¢-B derived from LPS of
NTHi isolate 1209. Average mass units were used for calculation of molecular mass values based on proposed compositions as follows: Hex, 162.14;
HexNAc, 203.19; Hep, 192.17; AnKdo-ol, 222.20; PEtn, 123.05 and PCho, 165.13. Relative abundance was estimated from the area of molecular
ion peak relative to the total area (expressed as percentage). ND, not detected.
Observed ions (m/z)
(M-2H)
2–
Molecular mass (Da) Relative abundance (%)
Proposed composition
Observed Calculated OS-1¢ OS-1¢-A OS-1¢-B
623.4 1248.8 1249.0 Trace
a
ND 5 PCho•Hex
1
•Hep
3
•PEtn
1
•AnKdo-ol
704.3 1410.6 1411.2 3 1 6 PCho•Hex
2
•Hep
3
•PEtn
1
•AnKdo-ol
785.3 1572.6 1573.3 70 80 30 PCho•Hex
3
•Hep
3
•PEtn
1
•AnKdo-ol
866.4 1734.8 1735.4 9 11 2 PCho•Hex
4
•Hep
3
•PEtn
1
•AnKdo-ol
968.2 1938.4 1938.6 Trace 2 ND PCho•HexNAc
1
•Hex
4
•Hep
3
•PEtn
1
•AnKdo-ol
718.0 1438.0 1438.2 ND ND 1 Hex
2
•Hep
4
•PEtn
1
•AnKdo-ol
798.8 1599.6 1600.4 Trace ND 3 Hex
3
•Hep
4
•PEtn
1
•AnKdo-ol
879.9 1761.8 1762.5 16 5 47 Hex
4
•Hep
4
•PEtn
1
•AnKdo-ol
960.9 1923.8 1924.6 2 1 6 Hex
5
•Hep
4
•PEtn
1
•AnKdo-ol
a
Trace amounts, defined as peaks representing less than 1% of the base peak.
Ó FEBS 2003
L
,
D
–Hep in the outer-core region of NTHi LPS (Eur. J. Biochem. 270) 613
For the major Hep3-glycoform with the composition
Hex
3
•Hep
3
•AnKdo-ol ([M + Na]
+
1671.8 Da), ion selec-
tion and collisional activation of the precursor ion at m/z
1671.8 provided the MS
2
spectrum shown in Fig. 3. The
ions at m/z 1453.6 and 1249.5 indicated losses of a single
nonreducing terminal-Hex (t-Hex) and the nonreducing
fragment t-Hex-Hex, respectively. The fragment at m/z
1001.5 (loss of t-Hex-Hex–Hep) and its trisaccharide
counterpart at m/z 693.4 resulting from cleavage between
HepII and HepIII, indicated the dihexose moiety to be
attached to HepIII. The ions at m/z 753.4 (t-Hex–Hep-
AnKdo-ol) and 941.4 (the counterpart) resulting from
cleavage between HepI and HepII, finally, showed a
terminal Hex residue to be linked to HepI. Loss of the
terminal AnKdo-ol residue was also observed (as in almost
every MS
2
spectrum) from the ion at m/z 1393.5.
For the Hep3-glycoform with the composition Hex
4
•
Hep
3
•AnKdo-ol ([M + Na]
+
1875.9 Da), three isomers
were shown to be present [Table 3, o ¼ 3, q ¼ 1(I),o¼ 2,
q ¼ 2 (II), o ¼ 1, q ¼ 3 (III)]. Ions in the MS
2
spectrum at
m/z 1657.7, 1453.6 and 1249.5 corresponded to losses of
t-Hex (from I, II and III), t-Hex-Hex (I, II and III) and
t-Hex-Hex-Hex (I and III), respectively. Isomer III could be
derived from the ion pairs at m/z 753.3/1145.3 (cleavage
HepI–HepII) and 1001.5/897.5 (cleavage HepII–HepIII).
Isomer II was derived from the fragment pairs at m/z 957.5/
941.3 and 1205.5/693.3 and isomer I, finally, from the ion
pair at m/z 1161.4/737.4 and from the ion at m/z 1409.9.
MS
3
experiments on selected product ions confirmed the
assigned structures. For the structures containing HexNAc
residues, it was observed that cleavage of the glycosidic
bonds were highly favoured on the reducing side of the
HexNAc residues [27]. To obtain unambiguous results, it
was often necessary to perform MS
3
experiments on the
product ion after loss of t-HexNAc or t-Hex-HexNAc.
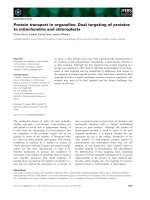
Fig. 2. ESI-MS spectra of permethylated dephosphorylated OS derived
from LPS of NTHi isolates 1209 (A) and 1233 (B) showing singly
charged ions, [M + Na]
+
. (A) Ions corresponding to selected Hep3-
glycoforms are labelled. (B) Ions corresponding to selected Hep4-
glycoforms are labelled.
Table 3. Structures of the Hep3-glycoforms of NTHi isolates 1209 and
1233 as indicated by ESI-MS
n
on permethylated dephosphorylated OS.
Subscripts denoted by the letters m, n, o, p and q indicate the number
of glycose residues in the following structure:
ND, not determined.
Relative
abun-
dance
a
(%) Structure
Relative
abundance
b
Glycoform 1209 1233 m n o p q 1209 1233
Hex1 0.5 – 0 0 1 0 0 High
0 0 0 0 1 Trace
Hex2 3.6 2.1 0 0 2 0 0 Low Medium
0 0 1 0 1 High Medium
0 0 0 0 2 Trace Trace
Hex3 57.5 13.3 0 0 300– Low
0 0201– Trace
0 0 1 0 2 High Medium
0 0003– Trace
Hex4 10.4 30.1 0 0 3 0 1 Trace Trace
0 0202Medium Low
0 0103Medium High
Hex5 1.9 3.2 0 0 3 0 2 High Medium
0 0 2 0 3 Trace Medium
Hex6 0.7 3.2 0 0 3 0 3 High High
Hex7 – 0.8 ND
HexNAc1Hex4 1.9 1.5 0 0 1 1 3 High High
HexNAc1Hex5 0.7 0.9 0 0 213Medium Medium
1 1202Medium Medium
HexNAc1Hex6 – 1.0 1 1 2 0 3 High
HexNAc1Hex7 – 0.4 ND
HexNAc2Hex6 – 0.2 ND
a
Relative abundance for each glycoform. Estimated from the area
of molecular ion peak relative to the total area in the MS spectrum
(expressed as percentage).
b
Relative abundance for the isomers of
each glycoform. Estimated from the intensity of the fragments in
MS
2
experiments and indicated as follows: high (over 80%),
medium (30–80%), low (2–30%), trace (below 2%).
614 M. Ma
˚
nsson et al. (Eur. J. Biochem. 270) Ó FEBS 2003
Elucidation of the Hep4-glycoforms introduced an addi-
tional level of complexity, as ions resulting from cleavages of
outer-core glycosidic linkages in some cases could not be
mass differentiated from fragments resulting from HepII–
HepIII ruptures. It was thus necessary to identify product
ions resulting from cleavages between HepI and HepII with
unique masses due to the AnKdo-ol moiety. For the major
Hep4-glycoform with the composition Hex
4
•Hep
4
•AnKdo-
ol ([M + Na]
+
2124.0 Da), ions in the MS
2
spectrum
(precursor ion [M + 2Na]
2+
1073.5 Da) (Fig. 4A) at m/z
1905.9, 1701.7 (counterpart at m/z 445.3) and 1453.6
(counterpart at m/z 693.3) corresponded to losses of
t-Hex, t-Hex-Hex and t-Hex-Hex–Hep. The fragments at
m/z 1205.6 (loss of t-Hex-Hex–Hep–Hep) and 941.5 (the
counterpart) indicated a dihexose moiety to be linked to
HepIII. An MS
3
experiment on m/z 1205.6 (Fig. 4B) resul-
tedinfragmentsatm/z 987.5 (loss of t-Hex), 739.3 (loss of
t-Hex–Hep) and 693.3 (corresponding to t-Hex–Hep-Hex),
which showed the trisaccharide element Hex–Hep-Hex to
be attached to HepI. The topology of the other glycoforms
were determined in a similar manner (data not shown).
Table 4. Structures of the Hep4-glycoforms of NTHi isolates 1209 and
1233 as indicated by ESI-MS
n
on permethylated dephosphorylated OS.
Subscripts denoted by the letters m, n, o and p indicate the number of
glycose residues in the following structure:
ND, not determined.
Glycoform
Relative
abundance
a
(%) Structure
Relative
abundance
b
1209 1233 m n o p 1209 1233
Hex1 – 0.3 0 0 0 0 High
Hex2 1.6 0.8 0 1 0 0 High Medium
0 0 0 1 Low Medium
Hex3 2.4 2.1 0 2 0 0 Low Medium
0 1 0 1 Medium Medium
0 0 0 2 Medium Medium
Hex4 14.9 7.2 0 2 0 1 – Low
0 1 0 2 High Medium
0 0 0 3 – Medium
Hex5 2.7 12.6 0 2 0 2 Medium Medium
0 1 0 3 Medium Medium
Hex6 0.5 15.2 0 2 0 3 High High
Hex7 – 1.5 ND
Hex8 – 0.5 ND
HexNAc1Hex4 – 0.7 1 2 0 1 Medium
0 0 1 3 Medium
HexNAc1Hex5 0.4 0.7 1 2 0 2 Medium Medium
0 1 1 3 Medium Medium
HexNAc1Hex6 0.3 1.2 1 2 0 3 Medium Medium
0 2 1 3 Medium Medium
HexNAc1Hex7 – 0.3 ND
HexNAc1Hex8 – 0.1 ND
HexNAc2Hex6 – 0.1 1 2 1 3 High
a
Relative abundance for each glycoform. Estimated from the area
of molecular ion peak relative to the total area in the MS spectrum
(expressed as percentage).
b
Relative abundance for the isomers of
each glycoform. Estimated from the intensity of the fragments in
MS
2
experiments and indicated as follows: high (over 80%),
medium (30–80%), low (2–30%), trace (below 2%).
Fig. 3. ESI-MS
2
analysis of permethylated dephosphorylated OS
derived from LPS of NTHi isolate 1209. Product ion spectrum of
[M + Na]
+
m/z 1671.8 corresponding to a glycoform with the com-
position Hex
3
•Hep
3
•AnKdo-ol. The proposed structure is shown in
the inset.
Fig. 4. ESI-MS
n
analysis of permethylated dephosphorylated OS
derived from LPS of NTHi isolate 1209. (A) MS
2
spectrum of
[M + 2Na]
2+
m/z 1073.5 corresponding to a glycoform with the
composition Hex
4
•Hep
4
•AnKdo-ol. The proposed structure is shown
in the inset. (B) MS
3
spectrum of the fragment ion at m/z 1205.6.
Ó FEBS 2003
L
,
D
–Hep in the outer-core region of NTHi LPS (Eur. J. Biochem. 270) 615
A large number of structural types were observed for the
Hep3-glycoforms (15 found) and Hep4-glycoforms (13
found), all of which can be represented by structures I and
II (Hep3-glycoforms) and structure III (Hep4-glycoforms)
in Scheme 2.
Structural characterization of the major glycoforms was
achieved by NMR spectroscopy (see below). In order to
decrease the OS heterogeneity and thereby simplify the
elucidation by NMR, OS-1¢ was repeatedly chromato-
graphed on a P-4 column with intermediate selection for the
Hep3- and Hep4-glycoforms (by ESI-MS). The final result
wasamajorfraction(OS-1¢-A, 4.4 mg) in which the Hep3-
glycoforms accounted for about 95%, and a minor fraction
(OS-1¢-B, 1.0 mg) in which the Hep4-glycoforms accounted
for about 60% (Table 2). Sugar analysis of OS-1¢-A and
OS-1¢-B indicated Glc, Gal and
L
,
D
–Hep in ratios of
26 : 48 : 26 and 29 : 37 : 34, respectively. Methylation
analysis of OS-1¢-A (Table 5) indicated terminal-Gal
(t-Gal), 4-substituted-Gal (4-Gal), 4-Glc, 3-Gal, 6-Glc, 4,6-
disubstituted-Glc (4,6-Glc), 2–Hep, 3,4–Hep and 2,6–Hep in
the relative proportions 27 : 7 : 37 : 2 : 2 : 2 : 17 : 4 : 2.
The methylation analysis of OS-1¢-B showed significantly
higher levels of 6-Glc and 6–Hep, of which the latter sugar
derivative indicated the substitution-pattern for the fourth
heptose residue (shown below).
Characterization of OS fractions and LPS-OH
from NTHi isolate 1209 by NMR
The
1
H NMR resonances of OS material and LPS-OH were
assigned by
1
H-
1
H chemical shift correlation experiments
(DQF-COSY and TOCSY). Subspectra corresponding to
the individual glycosyl residues were identified on the basis
of spin-connectivity pathways delineated in the
1
Hchemical
shift correlation maps, the chemical shift values, and the
vicinal coupling constants. From the glycoform composi-
tions of the different oligosaccharide fractions determined
by ESI-MS (Table 2), the spin-systems could more easily be
identified as originating from either the Hep3- or the Hep4-
glycoform population. The
13
C NMR resonances of OS
fractions and LPS-OH were assigned by heteronuclear
1
H-
13
C chemical shift correlation in the
1
H detected mode
(HSQC). The chemical shift data obtained for the Hep4-
glycoforms are summarized in Table 6 and are consistent
Scheme 2. Structures representing the various Hep3- and Hep4-
glycoforms in isolates 1209 and 1233. Truncated structures are
indicated by ÔÆÆÆÆÕ.
Table 5. Linkage analysis data for OS preparations derived from LPS of NTHi isolates 1209 and 1233. Trace amounts (defined as peaks representing
less than 3% of the base peak) of 2,3,4,6-Me
4
-Glc [assigned as
D
-Glcp-(1fi], 2,3,4,6,7-Me
5
–Hep [
L
,
D
–Hepp-(1fi], 2,3,4,6-Me
4
-GalN
[
D
-GalpNAc-(1fi] and 2,3,6-Me
3
-GlcN [fi4)-
D
-GlcpNAc-(1fi] were also indicated.
Methylated sugar
a
T
gm
b
Relative detector response (%)
Linkage assignment
OS-1¢-A OS-1¢-B 1233 OS
2,3,4,6-Me
4
-Gal 1.04 27 42 17
D
-Galp-(1fi
2,3,6-Me
3
-Gal 1.16 7 1 22 fi4)-
D
-Galp-(1fi
2,3,6-Me
3
-Glc 1.17 37 28 13 fi4)-
D
-Glcp-(1fi
2,4,6-Me
3
-Gal 1.19 2 Trace 5 fi3)-
D
-Galp-(1fi
2,3,4-Me
3
-Glc 1.20 2 6 5 fi6)-
D
-Glcp-(1fi
2,3-Me
2
-Glc 1.34 2 Trace 1 fi4,6)-
D
-Glcp-(1fi
2,3,4,7-Me
4
–Hep 1.41 Trace 4 3 fi6)-
L
,
D
–Hepp-(1fi
3,4,6,7-Me
4
–Hep 1.42 17 17 19 fi2)-
L
,
D
–Hepp-(1fi
2,6,7-Me
3
–Hep 1.48 4 2 14 fi3,4)-
L
,
D
–Hepp-(1fi
3,4,7-Me
3
–Hep 1.53 2 Trace 1 fi2,6)-
L
,
D
–Hepp-(1fi
a
2,3,4,6-Me
4
-Glc represents 1,5-di-O-acetyl-2,3,4,6-tetra-O-methyl-
D
-glucitol-1-d
1
, etc.
b
Retention times (T
gm
) are reported relative to
2,3,4,6-Me
4
-Glc (T
gm
1.00).
616 M. Ma
˚
nsson et al. (Eur. J. Biochem. 270) Ó FEBS 2003
with each
D
-sugar residue being present in the pyranosyl
ring form. Further evidence for this conclusion was
obtained from NOE data which also served to confirm
the anomeric configurations of the linkages and, together
with an HMBC experiment on OS-1¢, determined the
monosaccharide sequence.
Characterization of the Kdo-lipidA-OH element. ESI-MS
data (Table 1), fatty acid compositional analysis (yielding
3-hydroxytetradecanoic acid) and NMR experiments on
LPS-OH (data not shown, giving similar results as for
NTHi strains 486 [15] and 1003 [17]) indicated the presence
of the usual Kdo-lipid A-OH element in isolate 1209. As
observed earlier [15,17], two spin-systems could be traced
for the single a-linked Kdo residue, probably due to the
partial occurrence of PEtn attached to the phosphate group
at O-4 of Kdo [11,12,15].
Structure of the core region of the Hep3-glycoforms. In
the
1
H NMR spectra of OS-1¢-A (Fig. 5A) and OS-1¢
(Fig. 5B), anomeric resonances corresponding to the inner-
core region and GlcI could be observed at d 5.70–5.63
(HepII), 5.15–5.04 (HepI), 5.12 (HepIII) and 4.51 (GlcI),
respectively. In addition, anomeric signals corresponding to
a globotetraose unit and sequentially truncated versions
thereof linked to HepIII, were identified at d 4.96 (t-a-
D
-
Galp), 4.93 (weak, 3-a-
D
-Galp), 4.70 (4-b-
D
-Glcp), 4.64
(weak, t-b-
D
-GalpNAc), 4.52 (4-b-
D
-Galp)and4.46(t-b-
D
-
Galp) as previously described for strain RM118 [12]. Spin-
systems for the additional glycose residues shown by MS
n
(see Scheme 2) could not be rationalized due to weak and
overlapping signals. Signals for methyl protons of PCho
were observed at d 3.25 and spin-systems for ethylene
protons from this residue and from PEtn were similar to
those observed earlier [15,17].
1
H-
31
P NMR correlation
studies (data not shown) demonstrated PChotobelocated
at O-6 of GlcI and PEtn to substitute HepII at O-6, as
previously observed in strain RM118 [12] and NTHi strain
1003 [17]. The positions of the O-acetyl groups were
determined from NMR experiments on OS-1. Intense
signals from methyl protons of the O-acetyl groups were
observed at d 2.20/2.18, which correlated to
13
C signals at d
21.1 in the HSQC spectrum. For GlcI, a spin-system was
found where characteristic downfield shifts were obtained
for the signals from H-4 and C-4, consistent with acetylation
at O-4 as previously described for NTHi strain 1003 [17].
HepIII was indicated to be acetylated at O-3 as character-
istic downfield shifts were obtained for the signals from H-3
and C-3, as previously described for strain 1003 [17]. A
crosspeak from the ester-linked glycine substituent was also
observed at d 3.99/40.7 (in the HSQC spectrum) due to
correlation between the methylene proton and its carbon.
From the combined data, the structure in Scheme 3 is
proposed for the globotetraose-containing Hep3-glycoform
(HexNAc1Hex4) of NTHi isolate 1209.
Structure of the core region of the Hep4-glycoforms. In
the
1
H NMR spectrum of OS-1¢-B (Fig. 5C), anomeric
resonances of the three heptose residues (HepI–HepIII) in
the inner-core region were observed at d 5.73–5.62 (1H, not
resolved), 5.18–5.05 (1H, not resolved) and 4.99 (1H, not
resolved). The Hep ring systems were identified on the basis
Table 6.
1
H and
13
C NMR chemical shifts for Hep4-glycoforms of OS-1¢-B derived from LPS of NTHi isolate 1209. Data was recorded in D
2
Oat
22 °C. Pairs of deoxyprotons of reduced AnKdo were identified in the DQF-COSY spectrum at 2.19–1.55 p.p.m.
Residue Glycose unit H-1/C-1 H-2/C-2 H-3/C-3 H-4/C-4 H-5/C-5 H-6
A
/C-6 H-6
B
H-7
A
/C-7 H-7
B
HepI fi3,4)-
L
-a-
D
–Hepp-(1fi 5.05–5.18
a
4.00–4.06
a
4.01–4.04
a
4.25
b
–
c
4.13
b
––
97.4–98.8
a
71.1–71.2
a
73.8 74.3 – 68.5 –
HepII fi2)-
L
-a-
D
–Hepp-(1fi 5.62–5.73
a
4.18 3.94 3.96 3.77 4.57 3.71 3.89
6›
PEtn 99.2–99.5
a
79.6 69.9 67.0 72.5 75.3 62.9
HepIII fi2)-
L
-a-
D
–Hepp-(1fi 4.99 4.16 4.00 3.78 – – – –
100.3 79.9 70.1 67.6 – – –
GlcI fi6)-b-
D
-Glcp-(1fi 4.51 3.40 3.44 3.52 3.59 3.87 3.96
103.9 74.3 77.3 70.8 74.2 66.0
HepIV fi6)-
L
-a-
D
–Hepp-(1fi 4.96 4.10 3.80 4.01 – 4.21 3.75 3.93
100.0 70.5 – 66.6 – 79.3 63.1
GalI b-
D
-Galp-(1fi 4.51 3.62 3.69 3.94 3.74
d
––
104.8 71.7 73.2 69.2 75.5 –
GlcII fi4)-b-
D
-Glcp-(1fi 4.54 3.41 3.72 3.71 3.71 3.84 4.00
103.1 73.1 75.1 79.0 75.1 60.8
GalII b-
D
-Galp-(1fi 4.46 3.54 3.68 3.94 3.74
d
––
103.7 71.6 73.2 69.2 76.0 –
GalII* fi4)-b-
D
-Galp-(1fi 4.52 3.59 3.75 4.05 3.79
d
––
103.7 71.6 72.8 78.0 76.0 –
GalIII a-
D
-Galp-(1fi 4.96 3.84 3.91 4.04 4.37 – –
101.0 69.3 69.9 69.6 71.5 –
PEtn 4.13 3.27
62.7 40.8
a
Several signals were observed for HepI and HepII due to heterogeneity in the AnKdo moiety.
b
H-4/H-6 of HepI were identified at d 4.25/
4.13 by NOE from GlcI.
c
–, not obtained owing to the complexity of the spectrum.
d
Tentative assignment from NOE data.
Ó FEBS 2003
L
,
D
–Hep in the outer-core region of NTHi LPS (Eur. J. Biochem. 270) 617
of the observed small J
1,2
-values and their a-configurations
were confirmed by the occurrence of single intraresidue
NOE between the respective H-1 and H-2 resonances as
observed earlier [15,17]. Several signals for methylene
protons of AnKdo-ol were observed in the DQF-COSY
and TOCSY spectra of OS-1¢-B in the region d 2.19–1.55.
As previously observed [10,15,17], several anhydro-forms of
Kdo are formed during the hydrolysis by elimination of
phosphate or pyrophosphoethanolamine from the C-4
position, which causes both the signal splitting of the
methylene protons and the appearance of several anomeric
signals for HepI and HepII (Table 6). The occurrence of
intense transglycosidic NOE connectivities between the
proton pairs HepIII H-1/HepII H-2, HepII H-1/HepI H-3
(LPS-OH and OS-1¢-B) and HepI H-1/Kdo H-5 and H-7
(LPS-OH) confirmed the sequence of the heptose-contain-
ing trisaccharide unit and the point of attachment to Kdo as
L
-a-
D
–Hepp-(1fi2)-
L
-a-
D
–Hepp-(1fi3)-
L
-a-
D
–Hepp-(1fi5)-
a-Kdop.
1
H-
31
P NMR correlation studies demonstrated
PEtntobelinkedtoO-6ofHepIIasa
31
P resonance at d
0.03 correlated to the signals from H-6 of HepII (d 4.57) and
the methylene proton pair of PEtn (d 4.13).
Fig. 5. 600 MHz
1
HNMRspectraofOS-1¢-A (A), OS-1¢ (B) and OS-1¢-B (C) derived from LPS of NTHi isolate 1209 showing the anomeric regions.
(A) Anomeric resonances that are characteristic for the Hep3-glycoforms are labelled. Also indicated is an ethylene proton signal from PCho at d
4.38. (C) Anomeric resonances that are characteristic for the Hep4-glycoforms are labelled.
618 M. Ma
˚
nsson et al. (Eur. J. Biochem. 270) Ó FEBS 2003
In OS-1¢-B, relatively large J
1,2
-values (about 7.7 Hz) of
the anomeric resonances observed at d 4.54, 4.52 (weak),
4.51, 4.51 and 4.46 indicated each of the corresponding
residues to have the b-anomeric configuration. The residues
with anomeric signals at d 4.96 (not resolved) and 4.96
(weak, J 4.0 Hz) were identified as having the a-anomeric
configuration. Further evidence for the anomeric configu-
rations was obtained from the occurrence of intraresidue
NOE between the respective H-1, H-3 and H-5 resonances
(b-configuration) or between H-1 and H-2 (a-configur-
ation). On the basis of the chemical shift data and the large
J
2,3
, J
3,4
and J
4,5
-values (9 Hz), the residues with anomeric
shifts of d 4.51 and 4.54 could be attributed to the 6-Glc
(GlcI) and 4-Glc (GlcII) identified by methylation analysis
(Table 5). On the basis of low J
3,4
and J
4,5
-values (< 4 Hz)
and chemical shift data, the residues with anomeric
resonances at d 4.51, 4.46, 4.96 (weak, J 4.0 Hz) and
4.52 were attributed to the t-Gal (GalI, GalII and GalIII)
and 4-Gal (GalII*) identified by linkage analysis. The
residue with anomeric signal at d 4.96 (not resolved) was
attributed to the 6–Hep (HepIV) identified in the methyla-
tion analysis, on the basis of the small J
1,2
-value and
chemical shift data.
Interresidue NOE were observed between the proton
pairs GalI H-1/HepIV H-6, HepIV H-1/GlcI H-6A, H-6B
and GlcI H-1/HepI H-4 and H-6 (Fig. 6) which established
the presence of the tetrasaccharide unit b-
D
-Galp-(1fi6)-
L
-
a-
D
–Hepp-(1fi6)-b-
D
-Glcp-(1fi4)-
L
-a-
D
–Hepp-(1fi.This
monosaccharide sequence was also confirmed by transgly-
cosidic correlations in an HMBC experiment, where corre-
lations were seen between GalI C-1/HepIV H-6, GalI H-1/
HepIV C-6 and HepIV H-1/GlcI C-6. The occurrence of
interresidue NOE connectivities between the proton pairs
GalII H-1/GlcII H-4 and GlcII H-1/HepIII H-1 and H-2
(Fig. 6) established the sequence of a disaccharide unit and
its attachment point to HepIII as b-
D
-Galp-(1fi4)-b-
D
-
Glcp-(1fi2)-
L
-a-
D
–Hepp-(1fi. The lactose element was
shown to be further chain extended by an a-
D
-Galp residue
as transglycosidic NOE between GalIII H-1/GalII* H-4
and GalII* H-1/GlcII H-4 were observed. Spin-systems for
Scheme 3. Structure proposed for a Hep3-glycoform (HexNAc1Hex4) of NTHi isolate 1209.
Fig. 6. Selected regions from the 600 MHz 2D NOESY spectrum (mixing time 200 ms) of OS-1¢-B derived from LPS of NTHi isolate 1209. Both
regions were plotted at the same contour levels. Cross-peaks that are characteristic for the Hep4-glycoforms are labelled.
Ó FEBS 2003
L
,
D
–Hep in the outer-core region of NTHi LPS (Eur. J. Biochem. 270) 619
the additional glycose residues shown by MS
n
(see
Scheme 2) could not be rationalized due to weak and
overlapping signals. The locations of the O-acetyl groups
were determined from NMR experiments on OS-1. Chemi-
cal shift values were found to be consistent with acetylation
at O-4 of GlcI and at O-3 of HepIII, as observed for the
Hep3-glycoforms (see above). From the combined data, the
structure in Scheme 4 is proposed for the Hex5 glycoform in
the Hep4-glycoform population of NTHi isolate 1209.
Characterization of LPS and OS from NTHi isolate 1207
NTHi isolates 1207 and 1209 were obtained from the same
patient on the same day (left and right ear isolates). Previous
investigations indicated the LPS from these isolates to
contain similar levels of Neu5Ac [26] as well as glycine [20].
From the results (data not shown) of sugar (of LPS) and
methylation (of LPS-OH) analysis, ESI-MS (of LPS-OH
and OS),
1
H NMR (of LPS-OH) and ESI-MS
n
(of
permethylated dephosphorylated OS) there was no indica-
tion of any structural difference between the LPS from these
two isolates. ESI-MS indicated a preponderance of higher
molecular mass glycoforms in 1207. Correspondingly, the
methylation analysis indicated significantly higher amounts
of 4-Gal and 3-Gal compared to that of OS-1 (data not
shown).
Characterization of LPS and OS from NTHi isolate 1233
An NTHi isolate obtained from another patient designated
1233 was found to have a similar LPS structural profile to
those from 1209/1207. ESI-MS indicated the OS from 1233
to have a similar pattern of glycoform compositions as
found in 1209, but with a distribution more shifted to
glycoforms of higher molecular mass. Ions could be found
corresponding to the compositions PCho•Hex
3)6
•Hep
3
•
PEtn
1
•AnKdo-ol (Hex4 major), PCho•HexNAc
1
•Hex
4
•
Hep
3
•PEtn
1
•AnKdo-ol, Hex
4)8
•Hep
4
•PEtn
1
•AnKdo-ol
(Hex6 major) and HexNAc
1)2
•Hex
6
•Hep
4
•PEtn
1
•
AnKdo-ol (data not shown). ESI-MS also showed minor
peaks corresponding to these compositions including an
additional glycine substituent, but notably, no peaks
corresponding to acetylated glycoforms could be seen.
In a previous investigation the structure of the major
Hep3-glycoform (composition: PCho•Hex
4
•Hep
3
•PEtn
1
•
AnKdo-ol) was determined by CE-ESI-MS/MS, which also
showed the location of the glycine substituent to HepIII
or HepI [20]. The level of Neu5Ac was found to be lower
than in 1209/1207 [26]. Sugar analysis of the OS indi-
cated Glc, Gal, GlcN, GalN and
L
,
D
–Hep in the ratio
19 : 58 : 1 : 1 : 21, while methylation analysis (Table 5)
showed identical sugar derivatives as for the OS fractions of
1209 with significantly increasing amounts of 4-Gal, 3-Gal
and 3,4–Hep. Molecular mass profiling of permethylated
dephosphorylated OS by ESI-MS (Fig. 2B) showed ions
corresponding to the compositions Hex
2)7
•Hep
3
•AnKdo-
ol, HexNAc
1
•Hex
4)7
•Hep
3
•AnKdo-ol, HexNAc
2
•Hex
6
•
Hep
3
•AnKdo-ol, Hex
1)8
•Hep
4
•AnKdo-ol, HexNAc
1
•
Hex
4)8
•Hep
4
•AnKdo-ol and HexNAc
2
•Hex
6
•Hep
4
•
AnKdo-ol (Tables 3 and 4). ESI-MS
n
revealed to a high
degree the same structural types as for 1209, but also
structures that were not detected in 1209. A close relation-
ship between the two isolates could be seen, as the structures
of the Hep3-glycoforms (17 found) and the Hep4-glyco-
forms (19 found) all can be represented by structures I-III in
Scheme 2, and the structural relationship was confirmed by
NMR spectroscopy.
Characterization of LPS and OS from
lpsA
mutant
of NTHi isolate 1233
It was recently shown that the lpsA gene is involved in
adding a b-
D
-Glcp residue in a 1,2-linkage to HepIII of
H. influenzae strain RM118 [7]. By construction of an lpsA
mutant of NTHi isolate 1233 it was therefore expected that
its LPS would not express any chain elongation at HepIII,
but otherwise be structurally identical to the LPS of the
clinical isolate, thereby facilitating analysis of the more
elongated Hep4-glycoforms.
Methylation analysis of a dephosphorylated portion of
the major OS fraction (OS-2) showed the same sugar
derivatives as for the clinical isolate, but with strongly
increasing amounts of t–Hep (relative proportion 21%) as
could be expected. Significantly decreasing amounts of
4-Gal and 4-Glc (relative proportions 9% and 1%,
respectively) were also indicated, which could be derived
from the lack of the globotetraose unit at HepIII. In the
ESI-MS spectrum, ions could be found corresponding to
the compositions PCho•Gly
0)1
•Hex
1)4
•Hep
3
•PEtn
1
•
AnKdo-ol (Hex1 major), Gly
0)1
•Hex
1)5
•Hep
4
•PEtn
1
•
AnKdo-ol (Hex3 major) and Gly
0)1
•HexNAc
1
•Hex
3
•
Hep
4
•PEtn
1
•AnKdo-ol (data not shown). ESI-MS
n
on
Scheme 4. Structure proposed for a Hep4-glycoform (Hex5) of NTHi isolate 1209.
620 M. Ma
˚
nsson et al. (Eur. J. Biochem. 270) Ó FEBS 2003
permethylated dephosphorylated OS-2 showed the glyco-
forms to have similar chain extensions at HepI as the clinical
isolate (data not shown), and also confirmed the lack of
chain extension at HepIII for all glycoforms. In order to
decrease the heterogeneity and thereby simplify NMR
elucidation, OS-2 was rechromatographed on a P-4 column
and two fractions were collected (OS-2-A and OS-2-B). OS-
2-A contained a high proportion (as shown by ESI-MS) of
glycoforms with the composition HexNAc
1
•Hex
3
•Hep
4
•
PEtn
1
•AnKdo-ol, for which the presence of the structural
element HexNAc-Hex-Hex–Hep-Hex–HepI was shown by
ESI-MS
n
(data not shown). OS-2-B contained a high
proportion of glycoforms with the composition Hex
3
•
Hep
4
•PEtn
1
•AnKdo-ol, where the structural element
Hex-Hex–Hep-Hex–HepI was shown by ESI-MS
n
(data
not shown). Both fractions contained different proportions
(as indicated by ESI-MS) of the Hep3-glycoforms men-
tioned above.
Characterization of OS fractions from
lpsA
mutant
of NTHi isolate 1233 by NMR
NMR data indicated the major Hep3-glycoform (Hex1) to
consist of a PCho-substituted (at O-6) b-
D
-Glcp residue
attached to O-4 of HepI of the usual PEtn-substituted
triheptosyl inner-core moiety (data not shown). Analysis of
intense transglycosidic NOE connectivities (data similar as
for 1209) also confirmed the sequence of this triheptosyl unit
in the Hep4-glycoform population (see above). Selected
chemical shift data obtained for the Hep4-glycoforms are
presented in Table 7. Relatively large J
1,2
-values (about
7.7 Hz) of the anomeric resonances observed at d 4.62
(weak in OS-2-B), 4.57, 4.51 and 4.50 (weak) indicated each
of the corresponding residues to have the b-anomeric
configuration. The residues with anomeric signals at d 4.96
(weak in OS-2-A, J 4.0 Hz), 4.95 (not resolved) and 4.92
(weakinOS-2-B,J 4.0 Hz) were identified as having the
a-anomeric configuration. The anomeric configurations
were also confirmed from intraresidue NOE as described
earlier (see above). The residues with anomeric shifts of d
4.51, 4.95 and 4.50 were attributed to a 6-Glc (GlcI), 6–Hep
(HepIV) and t-Gal (GalI) on the basis of chemical shift data
and coupling constants as described previously (see above).
On the basis of low J
3,4
and J
4,5
-values (< 4 Hz) and
chemical shift data, the residues with anomeric resonances at
d 4.57, 4.96, 4.92 and 4.62 were attributed to a 4-Gal (GalI*),
t-Gal (GalIV), 3-Gal (GalIV*) and t-GalNAc (GalNAc).
Interresidue NOE were observed between protons in GalI,
HepIV, GlcI and HepI as described previously (see above),
which established the tetrasaccharide unit b-
D
-Galp-(1fi6)-
L
-a-
D
–Hepp-(1fi6)-b-
D
-Glcp-(1fi4)-
L
-a-
D
–Hepp-(1fi.This
element was shown to be further chain extended by an a-
D
-
Galp residue as transglycosidic NOE between GalIV H-1/
GalI* H-4 and GalI* H-1/HepIV H-6 were observed.
Further chain elongation by a b-
D
-GalpNAc residue, finally,
was shown as transglycosidic NOE between GalNAc H-1/
GalIV* H-3 and GalIV* H-1/GalI* H-4 were observed.
Spin-systems for the additional glycose residues shown by
MS
n
(see above) could not be rationalized due to weak and
overlapping signals. From the combined results of the
investigation of NTHi isolate 1233 and its lpsA mutant the
structure in Scheme 5 is proposed for the fully extended
Hep4-glycoform (HexNAc2Hex6) of NTHi isolate 1233.
Characterization of LPS and OS from
lic1
mutant
of NTHi isolate 1209
For NTHi isolate 1209 (and isolate 1233) LPS it was thus
found that the O-6 position of GlcI could either be occupied
by PCho (Hep3-glycoforms) or
L
,
D
–Hep (Hep4-glyco-
forms). This could possibly indicate some form of compe-
tition between the gene products responsible for the
additions of PCho (Lic1) [29] and
L
,
D
–Hep (gene product
unknown) at O-6 of this glucose residue. To investigate this,
a lic1 mutant of NTHi isolate 1209 was constructed.
The ESI-MS spectrum of O-deacylated LPS showed
that all glycoform compositions comprised four heptoses.
Ions could be found corresponding to glycoforms with
the compositions Hex
4)8
•Hep
4
•PEtn
1)2
•P
1
•Kdo•Lipid
A-OH (Hex6 major), HexNAc
1
•Hex
5)8
•Hep
4
•PEtn
1)2
•
Table 7. Selected
1
H and
13
C NMR chemical shifts for Hep4-glycoforms of the OS preparations derived from LPS of NTHi strain 1233lpsA. Data
was recorded in D
2
Oat22°C. Signals corresponding to GalNAc methyl protons and carbons occurred at 2.05 and 22.8 p.p.m., respectively.
Residue Glycose unit H-1/C-1 H-2/C-2 H-3/C-3 H-4/C-4 H-5/C-5 H-6
A
/C-6 H-6
B
H-7
A
/C-7 H-7
B
GlcI fi6)-b-
D
-Glcp-(1fi 4.51 3.53 3.43 3.57 3.57 3.83 4.07
103.8 73.9 77.4 70.2 74.4 65.2
HepIV fi6)-
L
-a-
D
–Hepp-(1fi 4.95 4.09 3.78 4.03 –
a
4.20 3.76 3.91
100.1 70.4 – 66.4 – 79.3 63.0
GalI b-
D
-Galp-(1fi 4.50 3.63 3.69 3.94 3.74
b
––
104.8 71.7 73.0 69.1 75.5 –
GalI* fi4)-b-
D
-Galp-(1fi 4.57 3.67 3.76 4.05 3.81
b
––
105.0 71.5 72.6 77.6 75.8 –
GalIV a-
D
-Galp-(1fi 4.96 3.84 3.93 4.05 4.40 3.71 –
100.8 69.2 69.7 69.5 71.3 –
GalIV* fi3)-a-
D
-Galp-(1fi 4.92 3.90 3.98 4.27 4.43 3.69 –
101.0 68.2 79.5 69.4 70.7 –
GalNAc b-
D
-GalpNAc-(1fi 4.62 3.96 3.76 3.95 3.69
b
––
103.9 53.0 – 68.2 75.4 –
a
–, not obtained owing to the complexity of the spectrum.
b
Tentative assignment from NOE data.
Ó FEBS 2003
L
,
D
–Hep in the outer-core region of NTHi LPS (Eur. J. Biochem. 270) 621
P
1
•Kdo•Lipid A-OH (Hex6 major) and HexNAc
2
•Hex
6
•
Hep
4
•PEtn
1)2
•P
1
•Kdo•Lipid A-OH (data not shown).
Thus, the Hep4-glycoform population is comprised of
higher molecular mass species compared to the clinical
isolate, a glycoform distribution that was actually more
similar to the distribution found for the Hep4-glycoforms of
1233 (see above). ESI-MS
n
on permethylated dephosphor-
ylated OS showed the glycoforms to have identical struc-
tures as found for 1209 and 1233 (data not shown).
Methylation analysis of the dephosphorylated OS revealed
the same sugar derivatives as for the clinical isolate and the
relative proportions (data not shown) were consistent with
the assigned structure.
Discussion
In our investigation of LPS from a representative set of 24
NTHi clinical isolates we have found three isolates that
express LPS with unusual features but that are very similar
to each other. These are 1209 and 1207 obtained from the
same otitis media patient on the same day (left and right ear
isolates) and 1233 obtained from another patient on a
different date. The structural relationship is in agreement
with molecular epidemiological data following DNA
sequence analysis which showed that 1233 is identical to
1209 and 1207 except for one nucleotide change in one of
the housekeeping genes investigated (unpublished results).
All three isolates express
L
,
D
–Hep in the outer-core region
of the LPS, which has not been seen earlier in H. influenzae
LPS.
L
,
D
–Hep is a very common component of the inner-
core region of bacterial LPS, but has also in a few rare
occasions been found in the outer-core region [30,31]. The
L
,
D
–Hep residue was found to be located at O-6 of the b-
D
-
Glcp residue (labelled GlcI) linked to HepI, and in turn, is
substituted by a b-
D
-Galp residue at O-6 [i.e. b-
D
-Galp-
(1fi6)-
L
-a-
D
–Hepp-(1fi6)-b-
D
-Glcp-(1fi4)-
L
-a-
D
–Hepp-
(1fi] which, for the outer-core heptose, provides an unusual
substitution-pattern for a heptose residue [30,31]. Interest-
ingly, an LPS subpopulation lacking the outer-core
L
,
D
–
Hep residue was found, where the O-6 position of GlcI
instead was occupied by PCho. The gene products respon-
sible for the additions of PCho (Lic1) [29] and
L
,
D
–Hep
(gene product unknown) at O-6 of GlcI seem to be in some
form of competition as indicated by a lic1 mutant of isolate
1209 which was shown to exclusively express LPS glyco-
forms comprising the outer-core
L
,
D
–Hep residue. Compe-
tition between different glycosyl enzyme systems has been
observed before in NTHi strain 375 [32], where a lactose
moiety was found to be elongated by either Neu5Ac (lic3A
gene product [33]) or a-
D
-Galp (lgtC gene product [8]). To
date, a wide range of alternative substitution-patterns at
GlcI has been found. This investigation extends the
repertoire to include
L
,
D
–Hep at O-6 (1233) that can be
combined with an O-acetyl group at O-4 (1209/1207). The
LPS from an lpsA mutant of isolate 1233 as expected
showed a lack of chain extension from HepIII, confirming
the function of the lpsA gene product [7] and facilitating
determination of the OS chains attached to HepI. The pen-
tasaccharide unit b-
D
-GalpNAc-(1fi3)-a-
D
-Galp-(1fi4)-
b-
D
-Galp-(1fi6)-
L
-a-
D
–Hepp-(1fi6)-b-
D
-Glcp (or sequen-
tially truncated versions thereof) were shown to be attached
to HepI. There is strong reason to suspect that this unit is
identical to the HexNAc-Hex-Hex–Hep-Hex element
attached to HepI (as shown by ESI-MS
n
) in 1209/1207. In
both the Hep3- and the Hep4-glycoform population, the
globotetraose unit, b-
D
-GalpNAc-(1fi3)-a-
D
-Galp-(1fi4)-
b-
D
-Galp-(1fi4)-b-
D
-Glcp (or sequentially truncated ver-
sions thereof) were found to be attached to HepIII at O-2, as
previously found in strain RM118 [12]. Notably, the
terminal trisaccharide units of the globotetraose structure
and the pentasaccharide side chain attached to HepI are
identical.
The location of the acid-labile Neu5Ac residue could not
be determined by NMR due to low abundance of the
sialylated glycoforms. However, precursor ion monitoring
for loss of m/z 290 in CE-ESI-MS/MS experiments of 1209
and 1233 showed triply charged ions at m/z 965/1005
corresponding to the respective compositions Neu5Ac•
PCho•Hex
3
•Hep
3
•PEtn
1)2
•P
1
•Kdo•Lipid A-OH. This is
consistent with a sialyllactose structure at HepIII that
previously has been observed in a number of other
H. influenzae strains [15,17,32,33]. Recently, the presence
of sialyl-lacto-N-neotetraose, a-Neu5Ac-(2fi3)-b-
D
-Galp-
(1fi4)-b-
D
-GlcpNAc-(1fi3)-b-
D
-Galp-(1fi4)-b-
D
-Glcp was
describedinstrainRM118,whereitwassituatedatHepI
[19]. Notably, this structure was exclusively found as a
complete unit and no evidence for loss of any residues in
this structure was observed. The occurrence of a complete
Hex-HexNAc-Hex-Hex element attached to HepI in 1209/
1233 (see structure II in Scheme 2) and the presence of a
very low amount of Neu5Ac in neuraminidase-treated LPS-
OH samples of strain 1233lpsA (as detected by high-
performance anion-exchange chromatography), indicated
that an identical sialyl-lacto-N-neotetraose unit likely is
Scheme 5. Structure proposed for the fully extended Hex4-glycoform (HexNAc2Hex6) of NTHi isolate 1233.
622 M. Ma
˚
nsson et al. (Eur. J. Biochem. 270) Ó FEBS 2003
expressed in these isolates. In agreement with this, trace
amounts of 4-substituted GlcN was also detected in the
methylation analyses (Table 5).
ESI-MS
n
analysis of permethylated OS material has been
shown to be a powerful method for elucidating sequence,
branching and linkage information [27,28]. In the present
investigation, ESI-MS
n
on permethylated dephosphorylated
OS samples proved to be a most valuable tool for profiling
theextensivedegreeofLPSheterogeneityintheH. influ-
enzae strains. The extreme variability observed in the OS
structures is likely to have important implications for the
biology and virulence of these isolates. The 38 variant OS
structures found in 1233 exemplifies the combinatorial
power of multiple phase variable biosynthesis genes in
maximizing the number of potential LPS antigens expressed
by a bacterial population. This heterogeneity is perceived to
be an advantage to the organisms, allowing them to better
confront the different compartments and the myriad of
microenvironments encountered within the host. This
present study also serves to demonstrate that genes encoding
further uncharacterized transferase functions, such as that
for the transfer of
L
,
D
–Hep to GlcI, exist and remain to be
determined.
Acknowledgements
The authors wish to thank Juhani Eskola and the Finnish Otitis Media
Study Group for the provision of strains used in this study. The
Swedish NMR centre (Go
¨
teborg, Sweden) is acknowledged for
providing access to their 600 MHz facilities. Mary Deadman, Shannon
Walsh and Gaynor Randle are acknowledged for culturing of
H. influenzae strains. Dr Jianjun Li is acknowledged for CE-ESI-MS/
MS experiments and Dr James C. Richards is acknowledged for kind
criticism of the manuscript.
References
1. Murphy, T.F. & Apicella, M.A. (1987) Nontypeable Haemo-
philus influenzae: a review of clinical aspects, surface antigens,
and the human immune response to infection. Rev. Infect. Dis. 9,
1–15.
2. Kimura, A. & Hansen, E.J. (1986) Antigenic and phenotypic
variations of Haemophilus influenzae type b lipopolysaccharide
and their relationship to virulence. Infect. Immun. 51, 69–79.
3. Mandrell, R.E., Griffiss, J.M. & Macher, B.A. (1988) Lipo-
oligosaccharides (LOS) of Neisseria gonorrhoeae and Neisseria
meningitidis have components that are immunochemically similar
to precursors of human blood group antigens. Carbohydrate
sequence specificity of the mouse monoclonal antibodies that
recognize crossreacting antigens on LOS and human erythro-
cytes. J. Exp. Med. 168, 107–126.
4. Mandrell, R.E., McLaughlin, R., Kwaik, Y.A., Lesse, A.,
Yamasaki, R., Gibson, B., Spinola, S.M. & Apicella, M.A.
(1992) Lipooligosaccharides (LOS) of some Haemophilus species
mimic human glycosphingolipids, and some LOS are sialylated.
Infect. Immun. 60, 1322–1328.
5. Weiser, J.N. & Pan, N. (1998) Adaption of Haemophilus influ-
enzae to acquired and innate humoral immunity based on phase
variation of lipopolysaccharide. Mol. Microbiol. 30, 767–775.
6. Fleischmann,R.D.,Adams,M.D.,White,O.,Clayton,R.A.,
Kirkness, E.F., Kerlavage, A.R., Bult, C.J., Tomb, J F.,
Dougherty, B.A., Merrick, J.M., McKenney, K., Sutton, G.,
FitzHugh, W., Fields, C., Gocayne, J.D., Scott, J., Shirley, R.,
Liu, L I., Glodek, A., Kelley, J.M., Weidman, J.F., Phillips,
C.A.,Spriggs,T.,Hedblom,E.,Cotton,M.D.,Utterback,T.R.,
Hanna, M.C., Nguyen, D.T., Saudek, D.M., Brandon, R.C.,
Fine, L.D., Fritchman, J.L., Fuhrmann, J.L., Geoghagen,
N.S.M., Gnehm, C.L., McDonald, L.A., Small, K.V., Fraser,
C.M., Smith, H.O. & Venter, J.C. (1995) Whole-genome random
sequencing and assembly of Haemophilus influenzae Rd. Science
269, 496–512.
7. Hood, D.W., Cox, A.D., Wakarchuk, W.W., Schur, M., Sch-
weda, E.K.H., Walsh, S., Deadman, M.E., Martin, A., Moxon,
E.R. & Richards, J.C. (2001) Genetic basis for expression of
the major globotetraose-containing lipopolysaccharide from
H. influenzae strain Rd (RM118). Glycobiology 11, 957–967.
8. Hood, D.W., Deadman, M.E., Allen, T., Masoud, H., Martin,
A., Brisson, J.R., Fleischmann, R., Venter, J.C., Richards, J.C. &
Moxon, E.R. (1996) Use of the complete genome sequence
information of Haemophilus influenzae strain Rd to investigate
lipopolysaccharide biosynthesis. Mol. Microbiol. 22, 951–965.
9. Phillips, N.J., Apicella, M.A., Griffiss, J.M. & Gibson, B.W.
(1992) Structural characterization of the cell surface lipooligo-
saccharides from a nontypable strain of Haemophilus influenzae.
Biochemistry 31, 4515–4526.
10. Schweda, E.K.H., Hegedus, O.E., Borrelli, S., Lindberg, A.A.,
Weiser, J.N., Maskell, D.J. & Moxon, E.R. (1993) Structural
studies of the saccharide part of the cell envelope lipopoly-
saccharide from Haemophilus influenzae strain AH1-3 (lic3+).
Carbohydr. Res. 246, 319–330.
11. Masoud, H., Moxon, E.R., Martin, A., Krajcarski, D. &
Richards, J.C. (1997) Structure of the variable and conserved
lipopolysaccharide oligosaccharide epitopes expressed by
Haemophilus influenzae serotype b strain Eagan. Biochemistry
36, 2091–2103.
12. Risberg, A., Masoud, H., Martin, A., Richards, J.C., Moxon,
E.R. & Schweda, E.K.H. (1999) Structural analysis of the lipo-
polysaccharide oligosaccharide epitopes expressed by a capsule-
deficient strain of Haemophilus influenzae Rd. Eur. J. Biochem.
261, 171–180.
13. Rahman, M.M., Gu, X X., Tsai, C M., Kolli, V.S.K. & Carl-
son, R.W. (1999) The structural heterogeneity of the lipooligo-
saccharide (LOS) expressed by pathogenic non-typeable
Haemophilus influenzae strain NTHi 9274. Glycobiology 9, 1371–
1380.
14. Schweda, E.K.H., Brisson, J R., Alvelius, G., Martin, A.,
Weiser, J.N., Hood, D.W., Moxon, E.R. & Richards, J.C. (2000)
Characterization of the phosphocholine substituted oligosac-
charide in lipopolysaccharides of type b Haemophilus influenzae.
Eur. J. Biochem. 267, 1–12.
15. Ma
˚
nsson, M., Bauer, S.H.J., Hood, D.W., Richards, J.C.,
Moxon, E.R. & Schweda, E.K.H. (2001) A new structural type
for Haemophilus influenzae lipopolysaccharide. Structural ana-
lysis of the lipopolysaccharide from nontypeable Haemophilus
influenzae strain 486. Eur. J. Biochem. 268, 2148–2159.
16. Cox, A.D., Masoud, H., Thibault, P., Brisson, J R., van der
Zwan, M., Perry, M.B. & Richards, J.C. (2001) Structural ana-
lysis of the lipopolysaccharide from the nontypable Haemophilus
influenzae strain SB 33. Eur. J. Biochem. 268, 5278–5286.
17. Ma
˚
nsson, M., Hood, D.W., Li, J., Richards, J.C., Moxon, E.R.
& Schweda, E.K.H. (2002) Structural analysis of the lipopoly-
saccharide from nontypeable Haemophilus influenzae strain 1003.
Eur. J. Biochem. 269, 808–818.
18. Schweda, E.K.H., Li, J., Moxon, E.R. & Richards, J.C. (2002)
Structural analysis of lipopolysaccharide oligosaccharide epi-
topes expressed by non-typeable Haemophilus influenzae strain
176. Carbohydr. Res. 337, 409–420.
19. Cox, A.D., Hood, D.W., Martin, A., Makepeace, K.M.,
Deadman, M.E., Li, J., Brisson, J R., Moxon, E.R. & Richards,
J.C. (2002) Identification and structural characterization of a
Ó FEBS 2003
L
,
D
–Hep in the outer-core region of NTHi LPS (Eur. J. Biochem. 270) 623
sialylated lacto-N-neotetraose structure in the lipopolysaccharide
of Haemophilus influenzae. Eur. J. Biochem. 269, 4009–4019.
20. Li, J., Bauer, S.H.J., Ma
˚
nsson, M., Moxon, E.R., Richards, J.C.
& Schweda, E.K.H. (2001) Glycine is a common substituent of
the inner-core in Haemophilus influenzae lipopolysaccharide.
Glycobiology 11, 1009–1015.
20a. Cody,A.J.,Field,D.,Feil,E.J.,Stringer,S.,Deadman,M.E.,
Tsolaki,A.G.,Gratz,B.,Bouchet,V.,Goldstein,R.,Hood,
D.W. & Moxon, E.R. (2003) High rates of recombination in
otitis media isolates of non-typeable Haemophilus influenzae.
Infection, Genetics and Evolution in press.
21. Galanos, C., Lu
¨
deritz, O. & Westphal, O. (1969) A new method
for the extraction of R lipopolysaccharides. Eur. J. Biochem. 9,
245–249.
22. Holst, O., Brade, L., Kosma, P. & Brade, H. (1991) Structure,
serological specificity, and synthesis of artificial glycoconjugates
representing the genus-specific lipopolysaccharide epitope of
Chlamydia spp. J. Bacteriol. 173, 1862–1866.
23. Sawardeker,J.S.,Sloneker,J.H.&Jeanes,A.(1965)Quantitative
determination of monosaccharides as their alditol acetates by gas
liquid chromatography. Anal. Chem. 37, 1602–1604.
24. Gerwig, G.J., Kamerling, J.P. & Vliegenthart, J.F.G.
(1979) Determination of the absolute configuration of mono-
saccharides in complex carbohydrates by capillary G.L.C.
Carbohydr. Res. 77, 1–7.
25. Helander, I.M., Lindner, B., Brade, H., Altmann, K., Lindberg,
A.A.,Rietschel,E.T.&Za
¨
hringer, U. (1988) Chemical structure
of the lipopolysaccharide of Haemophilus influenzae strain I-69
Rd
–
/b
+
. Eur. J. Biochem. 177, 483–492.
26. Bauer, S.H.J., Ma
˚
nsson, M., Hood, D.W., Richards, J.C.,
Moxon, E.R. & Schweda, E.K.H. (2001) A rapid and sensitive
procedure for determination of 5-N-acetyl neuraminic acid in
lipopolysaccharides of Haemophilus influenzae: a survey of 24
non-typeable H. influenzae strains. Carbohydr. Res. 335, 251–260.
27. Reinhold, V.N., Reinhold, B.B. & Costello, C.E. (1995) Carbo-
hydrate molecular weight profiling, sequence, linkage, and
branching data: ES-MS and CID. Anal. Chem. 67, 1772–1784.
28. Mu
¨
hlecker, W., Gulati, S., McQuilien, D.P., Ram, S., Rice, P.A.
& Reinhold, V.N. (1999) An essential saccharide binding domain
for the mAb 2C7 established for Neisseria gonorrhoeae LOS by
ES-MS and MS
n
. Glycobiology 9, 157–171.
29. Weiser, J.N., Shchepetov, M. & Chong, S.T.H. (1997) Decor-
ation of lipopolysaccharide with phosphorylcholine: a phase-
variable characteristic of Haemophilus influenzae. Infect. Immun.
65, 943–950.
30. Holst, O. (1999) Chemical structure of the core region of lipo-
polysaccharides. In Endotoxin in Health and Disease (Brade, H.,
Opal, S.M., Vogel, S.N. & Morrison, D.C., eds), pp. 115–154.
Marcel Dekker Inc., New York.
31. Holst, O. (2002) Chemical structure of the core region of lipo-
polysaccharides-an update. Trends Glycosci. Glyc. 14, 87–103.
32. Hood, D.W., Makepeace, K., Deadman, M.E., Rest, R.F.,
Thibault, P., Martin, A., Richards, J.C. & Moxon, E.R. (1999)
Sialic acid in the lipopolysaccharide of Haemophilus influenzae:
strain distribution, influence on serum resistance and structural
characterization. Mol. Microbiol. 33, 679–692.
33. Hood, D.W., Cox, A.D., Gilbert, M., Makepeace, K., Walsh, S.,
Deadman,M.E.,Cody,A.,Martin,A.,Ma
˚
nsson, M., Schweda,
E.K.H.,Brisson,J R.,Richards,J.C.,Moxon,E.R.&Wakar-
chuk, W.W. (2001) Identification of a lipopolysaccharide a-2,3-
sialyltransferase from Haemophilus influenzae. Mol. Microbiol.
39, 341–350.
624 M. Ma
˚
nsson et al. (Eur. J. Biochem. 270) Ó FEBS 2003