EDUITY VALUATION USING MULTIPLES: AN EMPIRICAL STUDY ON PLANTATION SECTOR doc
Bạn đang xem bản rút gọn của tài liệu. Xem và tải ngay bản đầy đủ của tài liệu tại đây (746.61 KB, 37 trang )
Graduate School
Master of Science in Finance
Master Degree Project No. 2011:158
Supervisor: Stefan Sjögren
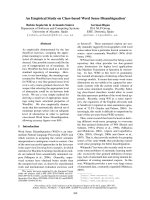
Equity Valuation Using Multiples: An Empirical Study on
Plantation Sector
Goh Chin Fei
i
EQUITY VALUATION USING MULTIPLES: AN EMPIRICAL
STUDY ON PLANTATION SECTOR
Goh Chin Fei May 2011
ABSTRACT
Despite the fact the multiple valuation method is widely use in practice, surprisingly
there is few empirical research available. To my knowledge, this study is probably the
first empirical investigation on valuation performance of multiples in plantation sector
and emerging market in Asia. I found that when selecting comparable firms either
using plantation sector membership or adopting return of equity as control factor in
plantation sector, price-to-earnings multiple leads to best valuation performance. In
contrast, price-to-sales multiple yields the worst valuation performance in both
selection methods. Moreover, the method using return of equity as control factor in
plantation sector outperforms the selection method based on plantation sector
membership.
JEL Classification: G19, M19
Key words: Corporate Valuation; Multiple; Relative Valuation; Plantation
ii
To my family
for their patience and support in this and all my endeavours
iii
ACKNOWLEDGEMENT
I am very grateful to my advisor Stefan Sjögren for his continuous support in this
thesis. In particular, I am heavily indebted to his many constructive criticisms and
suggestions that put me on the right track at the beginning phase of the project. I
couldn‟t have completed this thesis without his great help in supervising my thesis
work.
This thesis is final project on two-year master programme in finance at Graduate
School, School of Business, Economics and Law. At here, I would like to take the
opportunity to say thank you to Professor Martin Holmen, who is the programme
coordinator, for his kind support, which making my master study memorable and
pleasant.
May 2011
iv
TABLE OF CONTENT
LISTS OF TABLE V
LISTS OF FIGURE VI
1.0 INTRODUCTION 1
1.1 RELATIVE VALUATION 1
1.2 MOTIVATION 1
1.3 RESEARCH QUESTIONS 3
1.4 STUDY OBJECTIVES AND REPORT STRUCTURE 4
2.0 LITERATURE REVIEW 4
3.0 METHODOLOGY 7
3.1 METHODOLOGY REVIEW 7
3.1.1 VARIOUS METHODS OF SELECTING BENCHMARK MULTIPLE 7
3.1.2 CHOOSING STATISTICAL ESTIMATOR FOR BENCHMARK MULTIPLE 9
3.2 RESEARCH DESIGN 11
3.2.1 VALUATION ERRORS OF MULTIPLES 11
3.2.2 STATISTICAL ESTIMATOR AND MEASURE OF VALUATION ERRORS 12
3.2.3 SELECTION RULE FOR COMPARABLE FIRMS 13
3.2.4 SCOPE OF MULTIPLES 13
4.0 PLANTATION SECTOR IN MALAYSIA 14
5.0 DATASET 15
6.0 EMPIRICAL RESULTS 17
6.1 VALUATION ERRORS WHEN COMPARABLE FIRMS ARE BASED ON
PLANTATION SECTOR IN THE WHOLE SAMPLE PERIOD 17
6.2 VALUATION ERRORS WHEN COMPARABLE FIRMS ARE BASED ON ROE IN
PLATATION SECTOR IN THE WHOLE SAMPLE PERIOD 19
6.3 VALUATION ERRORS WHEN COMPARABLE FIRMS ARE BASED ON
PLANTATION SECTOR 20
6.4 VALUATION ERRORS WHEN COMPARABLE FIRMS ARE BASED ON ROE IN
PLANTATION SECTOR 22
6.5 FURTHER ANALYSIS AND DISCUSSION 23
6.6 CAVEAT OF THE STUDY 25
7.0 CONCLUSIONS AND SUGGESTION FOR FUTURE RESEARCH 26
REFERENCE 28
APPENDIXES 30
v
LISTS OF TABLE
TABLE 1: DESCRIPTIVE STATISTICS OF MULTIPLES AND ROE 17
TABLE 2: PERFORMANCE MEASURE AND WILCOXON RANK SUM TEST RESULT WHEN COMPARABLE FIRMS
ARE BASED ON PLANTATION SECTOR 18
TABLE 3: PERFORMANCE MEASURE AND WILCOXON RANK SUM TEST RESULT WHEN ROE IS USED AS
CONTROL FACTOR TO SELECT COMPARABLE FIRMS FROM PLANTATION SECTOR 19
TABLE 4: PERFORMANCE MEASURE OF VALUATION ERRORS THAT COMPARABLE FIRMS ARE BASED ON
PLANTATION SECTOR FROM 2003 TO 2009 21
TABLE 5: PERFORMANCE MEASURE OF VALUATION ERRORS THAT COMPARABLE FIRMS ARE BASED ON
ROE CONTROL FACTOR IN PLANTATION SECTOR FROM 2003 TO 2009 22
TABLE 6: DIFFERENCE OF MEDIAN ABSOLUTE ERROR FOR MULTIPLES AFTER ROE IS USED AS CONTROL
FACTOR IN PLANTATION INDUSTRY IN THE WHOLE SAMPLE PERIOD 24
TABLE 7: DIFFERENCE OF MEDIAN ABSOLUTE ERROR FOR MULTIPLE METHODS WHEN ROE IS USED AS
CONTROL FACTOR IN PLANTATION INDUSTRY FROM 2003 TO 2009 25
vi
LISTS OF FIGURE
FIGURE 1: MEDIAN ABSOLUTE ERROR WHEN COMPARABLE FIRMS ARE SELECTED ON THE BASIS OF
PLANTATION SECTOR 21
FIGURE 2: MEDIAN ABSOLUTE ERROR WHEN COMPARABLE FIRMS ARE SELECTED ON THE BASIS OF ROE
IN THE PLANTATION SECTOR 23
1
1.0 INTRODUCTION
1.1 RELATIVE VALUATION
In general, academicians are seemed to favor Discount Cash Flow model (DCF),
which based on the intrinsic value concept, over the multiples (or relative valuation)
in corporate valuation. Having said that, multiples still has distinct advantages since it
can be used to reflect market perception, to identify over-price or under-price
securities and; require less information and make fewer assumptions than DCF model.
Damodaran (2006) explained that in Discounted Cash Flow (DCF) model, the
intrinsic value of an asset is estimated from future expected cash flows and it is based
upon our faith in making perfect analysis on the asset‟s fundamentals. Nevertheless,
the actual stock (or enterprise) price may not reflect the intrinsic value persistently if
the market continues to be miss-pricing certain group of assets. He explained relative
valuation, on the other hand, is based upon the assumption that the market is correct
on average although some firms may over (under)-value. His survey showed that
relative valuation is a very popular tool in equity and enterprise valuation. Besides
that, multiples is a more widely accepted approach compared to Discounted Cash
Flow (DCF) model in valuing IPOs for young firms in U.S. since the future expected
cash flows is difficult to be estimated correctly (Kim & Ritter 1999). Park and Lee
(2003) also said that Japan analysts generally prefer relative valuation model than
Discounted Cash Flow (DCF) model because it is easy to use.
It is true that multiple methods do not require comprehensive valuation as discounted
cash flow model; however, multiples still relies on same principles and captures the
effect of future cash flow and risk (Liu, Nissim & Thomas 2001). As a matter of fact,
relative valuation renders almost sufficient valuation performance. One research
indicated that the prediction accuracy of multiples based upon two selection methods
for comparable firm (i.e. industry membership or similar transaction across industry)
is almost as good as compressed adjusted present value method (DCF model) in 51
samples of highly leveraged transactions from 1983 to 1989 (Kaplan & Ruback 1995).
1.2 MOTIVATION
Although multiple valuation method is widely adopted in practice, some researchers
think that multiples are difficult to be implemented correctly. Damodaran (2002, p. 20)
2
explained that using multiples for valuation is easy but practitioners tend to misuse it
because analysts have to make subjective decision to select comparable firms. The
issue becomes more problematic when the analyzed firm is unique in terms of
business and; it has few revenue or negative earnings. Schreiner (2007, p. 4) also
argued that using multiples in corporate valuation is difficult in practice because many
practitioners do not have good knowledge about the key driver of multiples and they
do not know which methodology is effective in choosing comparable firms. He
further argued that many practitioners lack of understanding about the defectiveness
of traditional multiple valuations model; and, even if they know it but they tend to
ignore it.
It is surprising that few empirical studies are available and most of the literatures fail
to provide comprehensive framework that can guide practitioners to use multiples
effectively (Kim & Ritter 1999; Bhojraj & Lee 2001; Liu, Nissim & Thomas 2001;
Lie & Lie 2002; Hermann & Richter 2003; Dittman & Weiner 2005); Schreiner &
Spremann 2007). Lie and Lie (2002) also pointed out that previous research fail to
reach a consensus on choosing suitable multiples benchmark. Given the importance of
relative valuation in corporate valuation, I believe that it is an important gap to be
addressed.
Nevertheless, there is an increasing trend on empirical research on studying the
effectiveness of multiples with different methodologies. Most of the research,
however, are concentrated in US and developed countries in Europe and Asia. That is,
most of the empirical studies in this decade are devoted into US data (Cheng &
McNamara 2000; Lie, Erik & Lie, Heidi J. 2002), equity markets in European
developed countries (Herrmann & Richter 2003; Dittmann & Weiner 2005; Schreiner
& Spremann 2007; Fidanza 2010) and Japanese stock market across industries (Park
& Lee 2003). There is also similar research on developing country in Europe, which is
Bucharest stock market (Mînjina 2009). Schreiner and Spremann (2007)
recommended that future study on multiples can be extended to emerging markets to
provide more empirical evidences to formulate a more comprehensive framework for
multiples. As far as I know, it is likely that there is no similar research for emerging
markets in Asia and plantation sector. In this thesis, I try to address this knowledge
gap by empirically examining the valuation performance of multiples in plantation
sector in Malaysia, which is one of the emerging markets in Asia.
3
1.3 RESEARCH QUESTIONS
Schreiner and Spremann (2007) explained that multiple is a ratio of market price
variable to its value driver. The value driver
1
of equity multiple (i.e. the denominator)
is regarded as significant factor that affects equity price (i.e. the numerator). In this
context, each value driver affects the market price differently and it may be reflected
in valuation errors of the multiples. That is to say we can rank the valuation
performance of multiples based on valuation errors and the result can be used as a
guideline in selecting appropriate multiples in an industry. For example, if the
valuation errors of P/E are found to be greater than the one of P/S, it can be justified
by the fact that the book value of equity is a more significant value driver of stock
price. Hence, it is advisable to choose the multiple that has smallest valuation errors in
the industry. The related result about value drivers may also be used as a reference for
analysts to verify their justified fundamentals in Discount Cash Flow (DCF) model.
According to before-mentioned arguments, research question 1 is established.
“When plantation industry membership (traditional approach) is used as selection method for
comparable firms, which multiple (i.e. P/S, P/E, P/B, P/CF and P/TA) yields smallest
valuation errors? In other words, which value driver has most significant impact on market
equity value?”
One known difficulty of relative valuation in practice is that analysts have to make
subjective judgment to select comparable firms, e.g. based on industry membership
(Damodaran 2006). Researchers argued that using industry membership as control
groups to represent fundamentals such as risk, growth rates and payout ratios across
the firms is a viable method (Park & Lee 2003). Having said that, the impact that stem
from shortcoming of traditional approach in selecting comparable firms should not be
neglected due to the fact that firms have different profitability growth. In this context,
return on equity (ROE) plays important role since the increased of ROE leads to
higher growth rate and vice versa (Damodaran 2006, p. 132). That is, the expected
growth rate in earnings is perceived as the product of return on equity and retention
ratio. Therefore, it is perfectly possible that ROE is an effective control factor and this
leads to next research question.
1
The value driver concept should not be confused with the fundamental driver for the market price
(i.e. equity or entity value) that stated in discounted cash flow model.
4
“Will the selection method of comparable firms that based on combination of industry
membership and ROE yields lower valuation errors for multiples than the one on the
basis on traditional approach (i.e. industry membership)?”
Using ROE as control factor in selecting comparable firms in same industry may
improve the valuation performance of multiples from theoretical perspective.
However, it is still unclear that how this approach will contribute positive effect on
each multiple. The research question 3 is established based on this concern.
“When combination of plantation industry membership and ROE is used as control factor for
comparable firms, which multiple (i.e. P/S, P/E, P/B, P/CF and P/TA) yields smallest
valuation errors? In other words, which value driver has most significant impact on market
equity value?”
1.4 STUDY OBJECTIVES AND REPORT STRUCTURE
This thesis evaluates the valuation accuracy of five multiples (i.e. P/E, P/B, P/CF, P/S
and P/TA) in the plantation sector in Malaysia from 2003 to 2009. This study renders
significant insights into methodology framework of multiple valuation method.
Moreover, this study aims to help investors to identify suitable multiples in plantation
sector based on empirical evidence rather than hypothesized concepts. There are three
research objectives in this thesis. First, this study uses median absolute errors and
non-parametric test to examine the valuation accuracy for multiples based on the two
types of comparable firms, which are industry membership and; combination of
industry membership and ROE. Second, this study identifies the relative performance
on valuation accuracy of these multiples in each type of comparable firms. Finally, the
study evaluates which type of comparable firms yields better valuation accuracy in
multiples.
The thesis is organized as follows: in the second section, the literature review is
presented; following this, the details of methodologies and the research design are
expounded; subsequently, the chosen plantation sector and dataset will be explained;
and in the nextpart, it is devoted into empirical findings and discussion; at last,
appropriate conclusions and future suggestions are presented.
2.0 LITERATURE REVIEW
The traditional approach in relative valuation uses industry membership as the basis
on selecting comparable firms. Park and Lee (2003) investigated how to utilise four
5
multiples (i.e. P/E, P/B, P/S and P/CF) in the Japanese stock market based on
traditional approach. They studied the valuation accuracy of four multiples in
predicting the actual stock prices. It is found that price-to-book (P/B) multiple was the
most accurate one in the studied period. On top of that, they simulated a test by
constructing two portfolios (i.e. undervalued and overvalued) with zero-net
investment strategy to identify which multiple can generate best returns. It turned out
the price-to-sales multiple generated highest return in the whole sample period while
price-to-earnings multiple only performed relatively well in bear market period.
However, researchers often encounter great difficulty in selecting the closest
comparable firms by using traditional approach in relative valuation. Many
researchers opted to have control factors in selecting comparable firm which it seems
more effective than traditional approach (i.e. industry membership) from theoretical
perspective. This argument is supported by empirical results from Hermann and
Richter (2003), which they discovered that selecting comparable firms with traditional
industry approach (i.e. SIC industry code as industry proxy) in US and Europe yield
lower valuation accuracy compared to the method using control factors.
Alford (1992) also investigated various selection methods of comparable firms (i.e.
market, industry, risk, ROE and combination of methods) for P/E multiple based on
U.S. data in 1978, 1982 and 1986. It is found that using industry membership (i.e. up
to 3-digit in SIC codes) and; combination of risk and earnings growth as the basis of
selecting comparable firms perform better than other selection methods. Furthermore,
the research showed that the valuation accuracy of P/E multiple improve when firm
size increased. At last, it is found that selecting firms with similar risk or earnings
growth rate (i.e. ROE as proxy) only slightly improve the valuation accuracy of P/E
multiple.
Similarly, Cheng and McNamara (2000) assessed the valuation accuracy of multiples
for P/E, P/B and a special multiple (i.e. P/E-P/B), which is a combination of P/E and
P/B. They used the market, industry membership, size, ROE; combination of industry
and size; and combination of industry and ROE as the basis to select benchmark
multiples. The research showed that using combination of industry membership and
ROE (IND-ROE) as benchmark yields best estimation for P/E and P/B multiples
while P/E-P/B multiple performs the best when industry membership is used as the
6
basis to select benchmark to evaluate unknown firm value. Lastly, the research found
that the performance of P/E outdo P/B multiple which leads to conclusion that
earnings is a more significant value driver for stock price.
Furthermore, Liu, Nissim and Thomas (2001) investigated the pricing accuracy of
several multiples across industries to identify value driver that can affect market value
of each multiple. They ranked the performance of multiples from best to worst in
following order which are: trailing P/E, forward-looking P/E, P/CF, P/B and P/S.
This result is very antithesis of general idea that arguing each industry has its own
best multiples.
Another research from Lie and Lie (2002) showed the valuation accuracy of multiples
changes in relation to factors such as firm size, profitability and level of intangible
assets. It is found that multiples produce more accurate valuation for large firms.
Moreover, the research indicated that asset multiple (i.e. Market Value-to-Book Value
Asset) is a more accurate and less biased compared to sales and earnings multiples. At
last, the valuation accuracy of EBITDA multiple is found better than EBIT multiple.
Dittman and Weiner (2005) also looked into five selection methods (i.e. market,
industry, ROA, TA; and ROA and TA) to choose comparable firms for EV/EBIT
multiple from three study groups which are from same country, same region and
OECD members. The research showed that using return on assets as control factor in
selecting comparable firms produces most accurate forecasts compared to methods
using industry membership and total assets. On the other hand, the research found no
obvious trend for the valuation errors in the sample period.
One recent investigation (Schreiner and Spremann 2007) on the valuation accuracy of
multiples has been devoted into comprehensive European data. The research
discovered several important findings in European equity markets as follows: first,
equity value multiples perform better than entity value multiples; second, knowledge-
related multiple outperform conventional multiples; third, the forward-looking
multiples especially the two-year forward P/E multiples are more accurate than
trailing multiples. Schreiner and Spremann (2007) claimed that the statistical findings
in the research are robust, significant in magnitude and constant over the sample
period from 1996 to 2005.
7
Most of the previous research mainly focuses on developed markets in US and Europe
and the lack of empirical evidence from emerging markets started to catch researchers‟
attention. Mînjina (2009) conducted first comprehensive empirical study on valuation
accuracy of multiples in the emerging market from Europe. He studied the valuation
performance of seven multiples (i.e. P/E, P/B, P/CF, P/S, P/TA, EV/EBIT and
EV/EBITDA) in Bucharest Stock Exchange. The research results showed that when
using industry membership to select comparable firms, the P/CF multiple yields most
accurate valuation compared to other multiples. Furthermore, the research indicated
that if multiple valuation method adopts ROE as control factor to select comparable
firms, P/E, P/B, P/CF and P/TA multiples will produce higher level of valuation
accuracy compared to traditional approach (i.e. industry membership). In contrast, P/S
multiple yields least accurate valuation when industry membership or ROE are used
as the basis of selecting comparable firms.
3.0 METHODOLOGY
3.1 METHODOLOGY REVIEW
In general, using multiples valuation method involves two important processes. First,
multiples have to be standardized to control size difference (i.e. price per share)
before making comparison to its peers (Damodaran 2006, p.236). Second, analyst
requires to select (or obtain) desired benchmark multiple prior to analysis. Arguably,
selecting correct statistical estimator for benchmark multiples is very important to
increase the reliability of valuation results. In the following part, I will present a
review of selecting benchmark multiple and statistical estimators before developing
the research design.
3.1.1 VARIOUS METHODS OF SELECTING BENCHMARK MULTIPLE
One popular approach in relative valuation is to associate the multiples with
fundamental variables in DCF model such as risk, expected growth and cash flow
generating capacity (Damodaran 2006). For example, analyst can combine Gordon
Growth Model (GGM) and Dividend Discount Model (DDM) to estimate the market
value of equity (i.e. Stock Price = Expected Dividend / (Discount Rate - Growth
Rate) ). Afterwards, analyst integrates estimated stock price with actual value of
denominator (i.e. book value for P/E) to generate his own „justified multiple‟. Then,
8
analyst compared the „justified multiple‟ with actual multiple to identify whether the
current stock price is over- or undervalued. That is to say the „justified multiple‟
becomes the benchmark multiple in relative valuation. However, this approach is
exposed to similar weakness that existed in DCF model – which sensitive to
assumptions (Damodaran 2006; Schreiner & Spremann 2007). Schreiner and
Spremann (2007) also argued that using GGM to estimate the „justified multiple‟ is a
flaw approach since we explicitly assume „justified multiple‟ is linearly proportional
to the value driver (or denominator). For example, the „justified P/E multiple‟ that
based on Gordon Growth Model can be re-arranged to have linear relationship with M
as follows:
Multiple linear regression technique is another plausible approach to estimate
benchmark multiples. This technique examines relationship between the market
variable of multiple (dependent variable) and fundamental based variables
(independent variables) such as growth, payout ratio and risk (Bhojraj & Lee 2001;
Damodaran 2006). The key advantage of regression is it examines the cross-sectional
effect of fundamental variables; and it is based upon actual data. Having said that,
Damodaran (2006) found that regression approach fails to produce reliable and
accurate benchmark multiples since the intercept, coefficient of variables and R-
square (i.e. explanatory power) in regression model fluctuated widely over time. He
argued the noisy benchmark multiples may be attributed to the change of business
cycle and regression shortcomings such as multi-collinearity issue and non-normally
distributed samples. Similar empirical result is also discovered by Hermann and
Richter (2003). They studied the effectiveness of various selection methods by using
linear and non-linear regression models in which fundamental factors such as growth
and ROE are used as independent variables. It turned out those valuation errors using
benchmark multiples from regression technique is bigger than median absolute error
(i.e. statistical estimator).
The third approach of selecting the benchmark multiple relies on theoretical concepts
of multiples which assumes comparable firms have identical fundamentals such as
9
risk, growth and cash flow generating capacity; and hence same size of multiple is
produced (Damodaran 2006; Schreiner & Spremann 2007) within certain period
(Schreiner & Spremann 2007). Traditionally, analysts use subjective judgments to
choose and calculate the average of multiples from the comparable firms. Then,
analysts compare the average value of multiple with actual multiples of firm.
I agree that assumptions of comparable firms that have identical fundamentals are
unlikely to be true in practice. However, I think the cross-sectional effect of
fundamentals in a set of comparable firms will become closer if the selection method
of comparable firms is improved. For instance, if comparable firms based on method
„A‟ have closer fundamentals, on aggregate, compared to industry, we can say the
average of multiple based on method „A‟ is better reflecting the cross-sectional effect
of fundamentals than industry multiples.
3.1.2 CHOOSING STATISTICAL ESTIMATOR FOR BENCHMARK
MULTIPLE
In general, researchers favor two statistical estimators to calculate the benchmark (or
synthetic) multiple, which are median and harmonic mean. Arithmetic mean is ruled
out because it may lead to overestimated value if multiple distributions are
asymmetric or skewed (Hermann &Richter 2003).
Some researchers (Alford 1992; Cheng & McNamara 2000; Lie & Lie 2002; Park &
Lee 2003; Schreiner & Spremann 2007) favored median as statistical estimator for
synthetic multiple. Alford (1992) argued the key advantage of using median is it helps
to mitigate outlier effect that ascribe to extreme multiples. Research from Lie and Lie
(2002) support this argument. They found that medians do not produce biased
estimation for all samples while arithmetic means is affected by extreme outlier effect
in valuation performance of multiples.
Harmonic means is also a preferable statistical estimator to calculate the synthetic
multiple of comparable firms since previous empirical research (Baker & Ruback,
1999; Liu, Nissim & Thomas 2001) showed that harmonic mean produces best
performance valuation for multiples. One similarity in previous research is that the
outlier effect of multiples is mitigated in the study. This motivates researcher (Mînjina
2009) to remove the extreme multiples‟ value that below 1 percentile or greater 99
10
percentile of the multiple distributions in studying the valuation performance of
multiples. However, this exclusion of extreme multiples signifies the newly improved
data may cause a bias in the study and pose a threat to reliability and credibility of the
result.
Indeed, Liu, Nissim and Thomas (2001) also found that valuation errors are smaller
when using harmonic mean for multiples compared to arithmetic mean and median.
However, they explained that valuation errors in their study are skewed to the left;
thereby the arithmetic mean is smaller than median. Based on this observation, I argue
that harmonic means is probably a better statistical estimator for synthetic multiple in
left-skewed valuation error distribution. Furthermore, some studies found no evidence
that harmonic means is the best statistical estimator for synthetic multiple. For
example, Hermann and Richter (2003), who investigated selection methods of
comparable firms, found that harmonic mean is the worst estimator while median is
the most accurate estimator in heterogeneous samples. In the study, they did not
eliminate the outlier effect. In short, I believe that the harmonic mean is likely a better
statistical estimator for synthetic multiple when following conditions are fulfilled: (1)
distribution of valuation error is left-skewed and (2) the outlier effect of multiples
distribution is mitigated.
Furthermore, I think there is a possibility that harmonic mean is happened to be a
superior statistical estimator by chance even though the outlier effect of multiple
distribution is not eliminated. The rationale is that the statistical estimator may
produce best valuation accuracy due to the shape of sample distribution. Imagine that
if the sample distribution is skewed to the left; hence, "mean < median < mode". It
means that "harmonic mean ≤ mean < median < mode" since harmonic mean is
always never larger than arithmetic mean. In contrast, if the distribution is skewed to
the right; hence, "mean > median > mode” and arguably it denotes that "mean >
median > mode" and "mean ≥ harmonic mean". In this scenario, median and
harmonic mean is closer to each in right skewed distribution compared to left skewed
sample distribution. Therefore, it is perfectly possible that harmonic mean and
median will perform very close to each other in investigating on multiples‟ valuation
accuracy.
11
In short, there are no consistent empirical evidences and theoretical framework
suggest that using harmonic mean as statistical estimator for synthetic multiple will
perform better in multiple valuation method; hence, I will choose median as statistical
estimator for synthetic multiples in this thesis.
3.2 RESEARCH DESIGN
3.2.1 VALUATION ERRORS OF MULTIPLES
Researchers have reached a consensus to estimate predicted stock price based on
synthetic multiple
2
from comparable firms based on theoretical concept of multiples
(Alford 1992; Cheng & McNamara 2000; Liu, Nissim & Thomas 2001; Lie & Lie
2002; Schreiner & Spremann 2007; Mînjina 2009). That is, the predicted stock price
is a product of value driver of a firm (i.e. the denominator of multiple) and synthetic
multiple as show at equation (1). The key advantage of this approach it requires fewer
assumptions than regression approach (Alford 1992).
(1)
Predicted stock (or firm) price and denominator of multiple are represented by
at year “t” (or the whole period “t”). The synthetic multiple
for firm “i” is indicated as
.
Since linear relationship is likely invalid between actual- and predicted price,
valuation errors will existed as shown in equation (2) (Liu, Nissim & Thomas 2001;
Schreiner & Spremann 2007). The
represents the valuation errors of firm „i‟ at year
„t‟ or period „t‟ and
is the actual price. Since we are only interested in magnitude of
valuation errors, the valuation errors can be re-arranged as shown in equation (3).
(2a)
(2b)
(3)
(4)
2
Previous research used different terminologies for synthetic multiple. In this thesis, synthetic
multiple is used. It is also equivalent to benchmark multiple or comparable multiple.
12
The last step in this approach is to scale predicted and actual price to control the size
effects (Cheng & McNamara 2000). The purpose of scaling is to standardize valuation
errors so that the valuation errors can be compared in percentage terms rather than
magnitude. Previous research fails to reach consensus in choosing the scaling factor.
Some researchers (Mînjina 2009; Schreiner & Spremann 2007; Liu, Nissim & Tomas
2001) chose the actual price as scaling factor since it is consistent with prior research
(Alford 1992). On the other hand, some researchers (Park & Lee 2003; Cheng &
McNamara 2000) adopted predicted price as scale factor since they believed it renders
consistency in valuation errors. For example, if the under-predicted price and over-
predicted price have equivalent distance from benchmark price, scaling by non-
benchmark price (i.e. actual price) will make scaled absolute valuation error differs in
magnitude. In contrast, scaling by predicted price will eliminate this problem. In this
thesis, the predicted price is adopted as scaling factor. Scaled valuation errors that
shown in equation (4) is denoted as |
.
3.2.2 STATISTICAL ESTIMATOR AND MEASURE OF VALUATION
ERRORS
In investigating the valuation accuracy of multiples, statistical estimator and statistical
measures are important to indentify which multiple is more superior (Hermann &
Richter 2003). In this thesis, the valuation performance of multiples is measured from
distributions of valuation errors which are unlikely to be normally distributed.
Therefore, median is a more robust statistical estimator to highly skewed data which
is less sensitive to extreme outliers (Norman & Streiner 2008, p. 27). Nevertheless,
the mean will be used as statistical estimator if the distribution of valuation errors is
found to be almost normally distributed.
To increase the reliability of performance measure, the Wilcoxon Rank Sum test is
used to assess the valuation errors of multiples on the basis of statistically superiority
3
.
Wilcoxon rank sum test is similar to the two sample t-test except it is a non-
parametric test and it does not assume population of the data is normally distributed.
The only assumption required is that two independent samples have same shape of
distribution. This is the null hypothesis in Wilcoxon rank sum test (Russo 2003, p.174)
3
The Wilcoxon Rank Sum test statistical is suggested by Herrmann and Richter (2003) and Mînjina
(2009) to assess the statistical superiority of valuation errors of paired multiples.
13
which is to indentify if two comparable groups have same central tendencies (i.e.
normally median is the index of central tendency). If null hypothesis is not true, it
signifies two comparable groups have different central tendency and Wilcoxon rank
sum test will generate the additional result to tell which group of data is
systematically larger (or statistically superior) than others (Moore & McCabe 2005).
In this study, the value, the sign of test statistic and the p-value of Wilcoxon rank sum
test are obtained from Stata software. Note that this test is also known as the Mann-
Whitney two-sample statistic in Stata software.
3.2.3 SELECTION RULE FOR COMPARABLE FIRMS
In the study, two selection methods are adopted in choosing comparable firms. First,
the traditional approach – the industry membership is used to select the comparable
firm. Second, the comparable firms are selected on the basis of ROE in same industry.
Hitherto, there isn‟t any previous research available in guiding us to choose optimal
number of comparable firms (Dittman & Weiner 2005); therefore, I will classify firms
into four group which are: first group, the average ROE of firm is less than 5%; the
second group, firms‟ average ROE is greater than 5% but less than 10%; the third
group, firms‟ average ROE is more than 10% but less than 15%; the last group, the
firms‟ average ROE is greater than 15%. I believe this classification will produce
better comparable firms according to profitability growth rate.
3.2.4 SCOPE OF MULTIPLES
In this thesis, I decided to focus on equity multiples and exclude the entity multiples.
The reason is that the enterprise value for entity multiple is not publicly available.
Previous research assumed enterprise value is equivalent to the sum of market value
of equity and book value of debt less cash and cash equivalent (Lie & Lie 2002). That
is, the calculation of enterprise value is based on the assumption that cash and cash
equivalent can be paid out to shareholders without affecting business operation.
Unfortunately, the calculation fails to reflect actual firm‟s market debt value since it
varies over time due to the changes of business cycle, financial liquidity in market and
interest rate (Lie & Lie 2002). Few empirical studies showed that entity multiples
yield very high valuation errors compared to equity multiples using aforementioned
assumptions (Schreiner & Spremann 2007; Mînjina 2009). Therefore, I think that the
entity multiple is less reliable than equity multiple. It is also inappropriate to compare
14
the performance of valuation errors between entity- and equity multiples since equity
multiples do not make additional assumption.
In this study, I include five equity multiples which are P/S, P/E, P/B, P/CF and P/TA.
Note that P/TA and P/S violate the consistency criteria which require the economic
means for numerator and denominator of multiple should be matched (Damodaran
2006, p. 239). The rationale is that if numerator is market equity value then the
denominator should also be a measure for equity value. However, multiples are
included since they are widely used in previous research and in practice.
4.0 PLANTATION SECTOR IN MALAYSIA
The palm oil and rubber industries are known as main pillars of the plantation sector
in Malaysia. According to Malaysian Rubber Export Promotion Council, Malaysia is
ranked as third largest producer of natural rubber in 2009 in the world. On the other
hand, Malaysian Palm Oil Council (MPOC) reported that Malaysia is the second
largest producer and exporter of palm oil in the world in 2009. In 2006, MPOC further
reported that there is about 570,000 people are directly employed in Palm Oil industry.
Palm oil plantation industry in Malaysia is primarily owned by large plantation
companies. The majority of ownership of these companies is private- and
government-linked companies (Pemandu 2010, p.282). In 2009, there is about 4.7
million hectares of oil palm plantations in Malaysia (Pemandu 2010, p.282).
Smallholders owned 28% while independent smallholders owned 12% of total
plantation land of palm oil plantation. The growth determinants of palm oil plantation
industry (Pemandu 2010, p.283) are: (1) productivity gains which vary across large,
medium and small plantations, smallholders and mills; (2) new plantation expansion;
and (3) the investment of companies into downstream activities likes processed food,
biodiesel, second generation bio-fuel and others.
Turning attention to rubber plantation industry in Malaysia, there was about 6.6
million hectares of rubber plantations in 2009 (Pemandu 2010, p.310). Independent
and organized smallholders owned 94% of total plantation land of rubber industry.
The growth prospect of rubber plantation industry relies on (1) the productivity gains
for rubber which varies across the plantation companies and smallholders and (2)
downstream products (i.e. rubber goods).
15
Recently, plantation sector is getting more attention from the local and foreign
investors since it is believed that bull market of commodity cycle is underway. The
increasing price trend becomes new growth driver of plantation sector in Malaysia.
Since the beginning of this decade, the price of natural rubber and palm oil has
increased dramatically. For example, the price of the Palm Oil was about USD 180
per tonne in 2000. It hit more than USD 1,100 per tonne in June 2008 and was around
USD 1,200 per tonne in December 2010 after the financial crisis. On the other hand,
the price of SMR CV (Standard Malaysia Rubber) natural rubber, which is very high
quality and lean latex grades rubber, was about USD 0.88/KG in January 2000. The
price rose to USD 2.70/KG in January 2008 and remained at around USD 5.00/KG in
December of 2010. Overall, the price of Palm Oil has increased more than six times
while price of natural rubble already increased about threefold.
I believe that the chosen plantation sector makes this study unique from previous
research. This is because plantation firms generally employing simple and
homogenous business model which differ from other industries such as information
technology, manufacturing and finance industries. Furthermore, plantation firms are
affected by same external factors (i.e. commodity price trend, demand and supply) in
business profitability. Therefore, investigating the valuation accuracy of multiples (or
value driver) in such industry renders empirical evidence to assist investors in
choosing multiples in plantation sector and similar kind of industries (i.e. business
model is homogenous and simple) to predict stock price effectively.
5.0 DATASET
In this thesis, the “Plantation Index” in Bursa Malaysia (also called Malaysia Stock
Exchange) is used as the basis of identifying the firms in plantation sector. There are
total 41 firms listed in “Plantation Index”. The dataset is primary the multiples for
firms over seven annual periods from 2003 to 2009. To construct the multiple dataset
requires the price of common stock and other financial data. The price of common
stocks is collected from Yahoo! Finance website whereas the financial data is
obtained from the annual reports that published in official website of Bursa Malaysia.
The reason to choose the study period from 2003 to 2009 is that stock price for many
firms listed in “Plantation Index” are not available before 2003 in Yahoo! Finance. In
16
total, there are 260 firm-year observations after excluding the annual report that
unavailable in the website of Bursa Malaysia.
In this study, some multiple samples are removed for the practical reasons. First, the
study only adopts multiple samples with positive P/E and P/CF multiples since
negative earnings and cash flow make multiples meaningless. Besides that, I do not
remove any multiples from the dataset.
The variables of multiples are calculated as following ways. First, the value of equity
is based on market capitalization which is a product of number of share and share
price. The data about outstanding shares of firms are extracted from the annual reports.
The price of equity is taken from the last closing price of trading day in the last month
of financial calendar. The rationale of this approach is that it is more precise to match
the share price and number of shares at certain point of day and it is not affected by
stock split. Second, I choose the proxy of cash flow that is consistent with previous
study (Park & Lee 2003). That is, I assume cash flow is net income plus depreciation
and amortization. At last, other variables such as total revenue, earnings, book value
of equity and asset are obtained from financial statements in firms‟ annual reports.
Damodaran (2006, p. 240) suggested that „Descriptional Tests‟ such as average,
median, standard deviation, standard error, minimum and maximum are necessary in
relative valuation. This will render us the characteristics of multiple distributions
before making comparison. However, I think that it is more appropriate to present the
dataset with inter-quartile range since I believe analysts are more interested in middle
concentration of distributions, which is less affected by outlier effect. Furthermore,
the standard deviation and standard error are based on the belief the data is normally
distributed which is unrealistic in practice.
Table 1 shows the means, median and inter-quartile of multiples and ROE for
multiple dataset. Note that for all multiple distributions are skewed to the right since
the mean is greater than median. The distribution of ROE is also skewed to the right
in 2003 but the distributions of ROE are skewed to the left from 2004 to 2009. Inter-
quartile range (IQR) in Table 1 represents the dispersion of data from the median with
the boundary between first and third quartile. It can be seen that dispersion of P/E and
P/CF multiples varies more significantly compared to others over the year. In total,
there are to 1,506 observations for 5 multiples and ROE.
17
Table 1: Descriptive Statistics of Multiples and ROE
This table shows mean, median and inter-quartile range (IQR) of multiples in dataset.
For multiples, the financial data (i.e. denominator) is derived from annual reports and
the share price (i.e. numerator) is taken from closing prices on last trading day of
firm‟s financial year. Note that the cash flow here is the sum of net income and cash
and cash equivalent. ROE is return on equity.
Multiple
Descriptive
Statistics
Year
2003
2004
2005
2006
2007
2008
2009
Mean
12.48
11.76
14.21
17.69
20.94
6.73
17.98
P/E
Median
10.54
9.62
11.00
13.53
10.82
6.03
10.98
IQR
7.48
6.83
8.72
7.12
3.66
3.98
5.25
Number of samples
29
30
28
33
38
37
35
Mean
0.83
0.82
0.74
1.06
1.55
1.15
1.23
P/B
Median
0.67
0.71
0.68
0.77
1.24
0.73
0.90
IQR
0.65
0.47
0.51
0.60
0.82
0.67
0.69
Number of samples
34
34
33
37
40
40
41
Mean
11.88
9.05
12.06
12.23
13.35
8.63
31.39
P/CF
Median
8.49
7.55
8.63
10.65
8.88
5.61
8.94
IQR
8.12
6.67
5.03
6.68
3.70
3.19
7.45
Number of samples
31
31
29
35
39
38
37
Mean
9.13
9.98
8.06
3.95
4.69
2.60
4.43
P/S
Median
2.18
1.72
1.70
2.49
3.23
1.31
2.38
IQR
3.31
3.39
3.83
3.01
3.07
2.36
3.98
Number of samples
35
35
34
37
39
39
40
Mean
0.64
0.63
0.57
0.71
1.08
0.78
0.85
P/TA
Median
0.47
0.51
0.47
0.62
0.91
0.58
0.62
IQR
0.57
0.42
0.50
0.52
0.75
0.50
0.65
Number of samples
34
34
33
37
40
40
41
Mean
7.11%
7.34%
4.40%
0.80%
6.77%
5.66%
7.62%
ROE
Median
6.53%
7.59%
5.35%
5.12%
13.29%
12.10%
7.93%
IQR
6.27%
5.76%
5.76%
7.02%
9.16%
11.16%
5.06%
No. of samples
34
34
33
37
40
40
41
6.0 EMPIRICAL RESULTS
6.1 VALUATION ERRORS WHEN COMPARABLE FIRMS ARE BASED
ON PLANTATION SECTOR IN THE WHOLE SAMPLE PERIOD
Table 2 summarizes the performance measure of valuation errors and Wilcoxon rank
sum statistical test results for multiples when comparable firms are selected on the
basis of plantation sector. It is found that the distribution of valuation errors for all
multiples is heavily skewed to the right and; therefore, median absolute error (MeAE)
18
is appropriate performance measure. On the other hand, the magnitude of Wilcoxon
value and p-value from Wilcoxon rank sum test demonstrates that most paired
valuation errors of multiples are statistically different at 5% significance level.
Table 2: Performance measure and Wilcoxon rank sum test result when
comparable firms are based on plantation sector
Wilcoxon value less than 1.96 and p-value > 0.05 suggests the distribution of
valuation errors is statistically indistinguishable at 95% significance level. If the two
data distributions are statistically different, the negative (positive) Wilcoxon value
indicates the value of valuation errors based on method in row (column) is
systematically larger (less) than the one in column (row). Stated differently, the
negative (positive) Wilcoxon value means the method in column (row) is statistically
superior to method in row (column) in terms of valuation accuracy.
Multiple
P/E
P/B
P/CF
P/S
P/TA
Performance Measure
Mean Absolute Error (MAE)
0.66
0.60
0.72
2.76
0.60
Median Absolute Error (MeAE)
0.31
0.38
0.36
0.62
0.44
1st Quartile
0.11
0.22
0.15
0.30
0.21
3rd Quartile
0.59
0.62
0.58
1.20
0.71
Inter-Quartile Range
0.48
0.39
0.43
0.90
0.50
Wilcoxon value (p-value)
P/B
-2.60 (0.01)
P/CF
-1.28 (0.20)
1.23 (0.22)
P/S
-7.47 (0.00)
-5.86 (0.00)
-6.46 (0.00)
P/TA
-3.47 (0.00)
-1.19 (0.23)
-2.16 (0.03)
4.73 (0.00)
The median absolute error (MeAE) indicates that P/E multiple yields a lowest
valuation errors followed by P/CF, P/B, P/TA and P/S. Furthermore, the distribution
of valuation errors for P/E multiple is systematically lower compared to the rest of
multiples according to Wilcoxon value with the exception of P/CF. Turning attention
to P/CF method, it produces slightly smaller median absolute error than P/B.
Furthermore, Wilcoxon ranksum test result reveals the valuation errors between P/B
and P/CF are statistically indistinguishable. However, the valuation errors of P/B are
less dispersed in inter-quartile range compared to P/CF method.
It is interesting to note that P/S is the least accurate among all multiple methods and it
produces 18% more valuation errors than P/TA method. Furthermore, valuation errors
of P/S multiple has biggest dispersion in inter-quartile range. The Wilcoxon rank sum