Báo cáo khoa học: "Generating Spatio-Temporal Descriptions in Pollen Forecasts" pptx
Bạn đang xem bản rút gọn của tài liệu. Xem và tải ngay bản đầy đủ của tài liệu tại đây (81.52 KB, 4 trang )
Generating Spatio-Temporal Descriptions in Pollen Forecasts
Ross Turner, Somayajulu Sripada and Ehud Reiter
Dept of Computing Science,
University of Aberdeen, UK
{rturner,ssripada,ereiter}@csd.abdn.ac.uk
Ian P Davy
Aerospace and Marine International,
Banchory, Aberdeenshire, UK
Abstract
We describe our initial investigations into
generating textual summaries of spatio-
temporal data with the help of a prototype
Natural Language Generation (NLG) system
that produces pollen forecasts for Scotland.
1 Introduction
New monitoring devices such as remote sensing sys-
tems are generating vast amounts of spatio-temporal
data. These devices, coupled with the wider accessi-
bility of the data, have spurred large amounts of re-
search into how it can best be analysed. There has been
less research however, into how the results of the data
analysis can be effectively communicated. As part of
a wider research project aiming to produce textual re-
ports of complex spatio-temporal data, we have devel-
oped a prototype NLG system which produces textual
pollen forecasts for the general public.
Pollen forecast texts describe predicted pollen con-
centration values for different regions of a country.
Their production involves two subtasks; predicting
pollen concentration values for different regions of a
country, and describing these numerical values textu-
ally.In our work, we focus on the later subtask, tex-
tual description of spatio-temporally distributed pollen
concentration values. The subtask of predicting pollen
concentrations is carried out by our industrial collab-
orator, Aerospace and Marine International (UK) Ltd
(AMI).
A fairly substantial amount of work already exists
on weather forecast generation. A number of systems
have been developed and are currently in commercial
use with two of the most notable being FOG (Goldberg
et al., 1994) and MultiMeteo (Coch, 1998).
2 Knowledge Acquisition
Our knowledge acquisition activities consisted of cor-
pus studies and discussions with experts. We have
collected a parallel corpus (69 data-text pairs) of
pollen concentration data and their corresponding hu-
man written pollen reports which our industrial collab-
orator has provided for a local commercial television
station. The forecasts were written by two expert mete-
orologists, one of whom provided insight into how the
forecasts were written. An example of a pollen fore-
cast text is shown in Figure 1, its corresponding data is
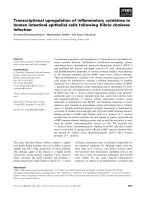
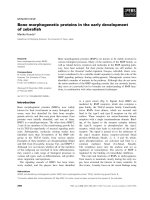
shown in table 1. A pollen forecast in the map form is
shown in Figure 2.
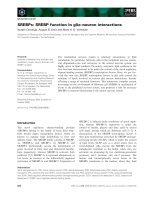
‘Monday looks set to bring another day of
relatively high pollen counts, with values up
to a very high eight in the Central Belt. Fur-
ther North, levels will be a little better at a
moderate to high five to six. However, even
at these lower levels it will probably be un-
comfortable for Hay fever sufferers.’
Figure 1: Human written pollen forecast text for the
pollen data shown in table 1
Figure 2: Pollen forecast map for the pollen data shown
in table 1
Analysis of a parallel corpus (texts and their under-
lying data) can be performed in two stages:
• In the first stage, traditional corpus analysis pro-
cedure outlined in (Reiter and Dale, 2000) and
(Geldof, 2003) can be used to analyse the pollen
forecast texts (the textual component of the paral-
lel corpus). This stage will identify the different
message types and uncover the sub language of
the pollen forecasts.
• In the second stage the more recent analysis meth-
ods developed in the SumTime project (Reiter et
163
ValidDate AreaID Value
27/06/2005 1 (North) 6
27/06/2005 2 (North West) 5
27/06/2005 3 (Central) 5
27/06/2005 4 (North East) 6
27/06/2005 5 (South West) 8
27/06/2005 6 (South East) 8
Table 1: Pollen Concentration Data for Scotland - Input
data for Figures 1 and 2
al., 2003) which exploit the availability of the un-
derlying pollen data corresponding to the forecast
texts can be used to map messages to input data
and also map parts of the sub language such as
words to the input data. Due to the fact that we
are modeling the task of automatically producing
pollen forecast texts from predicted pollen con-
centration values, knowledge of how to map in-
put data to messages and words/phrases is abso-
lutely necessary. Studies connecting language to
data are useful for understanding the semantics of
language in a more novel way than the traditional
logic-based formalisms (Roy and Reiter, 2005).
We have performed the first stage of the corpus anal-
ysis and part of the second stage so far. In the first
stage, we abstracted out the different message types
from the forecast texts (Reiter and Dale, 2000). These
are shown in Table 2. The main two message types
are forecast messages and trend messages. The for-
mer communicate the actual pollen forecast data (the
communicative goal) and the latter describe patterns in
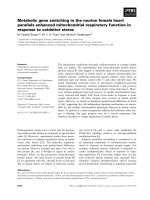
pollen levels over time as shown in Figure 3
‘Grass pollen counts continue to ease from
the recent high levels’
Figure 3: A trend message describing a fall in pollen
levels
Table 2 also shows three other identified message
types. We have ignored both the forecast explanation
and general message types in our system development
because they cannot be generated from pollen data
alone. For example, the explanation type messages ex-
plain the weather conditions responsible for the pollen
predictions. Hayfever messages in our system are rep-
resented as canned text. Examples of a forecast ex-
planation message and hayfever message are shown in
Figure 4 and Figure 5 respectively.
From our corpus analysis we have also been able to
learn the text structure for pollen forecasts. The fore-
casts normally start with a trend message and then in-
clude a number of forecast messages. Where hayfever
messages are present, they normally occur at the end of
the forecast.
Due to the fact that the input to our pollen text gen-
‘Windier and wetter weather over last 24
hours has dampened down the grass pollen
count’
Figure 4: An example forecast explanation message
‘Even though values are mostly low, those
sensitive to pollen may still be affected’
Figure 5: An example hayfever message
erator is the pollen data in numerical form, as part of
the second stage of the corpus analysis we need to map
the input data to the messages. In earlier ‘numbers
to text’ NLG systems such as SumTime (Sripada et
al., 2003) and TREND (Boyd, 1998), well known data
analysis techniques such as segmentation and wavelet
analysis were employed for this task. Since pollen data
is spatio-temporal we need to employ spatio-temporal
data analysis techniques to achieve this mapping. We
describe our method in the next section.
Our corpus analysis revealed that forecast texts con-
tain a rich variety of spatial descriptions for a location.
For example, the same region could be referred to by
it’s proper name e.g. ‘Suthlerland and Caithness’ or
by its’ relation to a well known geographical landmark
e.g. ‘North of the Great Glen’ or simply by its’ geo-
graphical location on the map e.g. ‘the far North and
Northwest’. In the context of pollen forecasts which
describe spatio-temporal data, studying the semantics
of phrases or words used for describing locations or re-
gions is a challenge. We are currently analysing the
forecast texts along with the underlying data to under-
stand how spatial descriptions map to the underlying
data using the methods applied in the SumTime project
(Sripada et al., 2003).
As part of this analysis, in a seperate study, we asked
twenty four further education students in the Glasgow
area of Scotland a Geography question. The question
asked how many out of four major place names in Scot-
land did they consider to be in the south west of the
country. The answers we got back were very mixed
with a sizeable number of respondents deciding that
the only place we considered definitely not to be in the
south west of Scotland was in fact there.
3 Spatio-temporal Data Analysis
We have followed the pipeline architecture for text gen-
eration outlined in (Reiter and Dale, 2000). The mi-
croplanning and surface realisation modules from the
Sumtime project (Sripada et al., 2003) have largely
been reused. We have developed new data analysis
and document planning modules for the system and de-
scribe the data analysis module in the rest of this sec-
tion. The data analysis module performs segmentation
and trend detection on the data before providing the re-
sults as input to the Natural Language Generation Sys-
164
Message Type Data Dependency Corpus Coverage
Forecast Pollen data for day of forecast 100%
Trend Past/Future pollen forecasts 54%
Forecast Explanation Weather forecast for day of forecast 35%
Hayfever Pollen levels affect hay fever 23%
General General Domain Knowledge 17%
Table 2: Message Categorisation of the Pollen Corpus
tem. An example of the input data to our system is
shown in Table 1. Our data analysis is based on three
steps:-
1. segmentation of the geographic regions by their
non-spatial attributes (pollen values)
2. further segmentation of the segmented geographic
regions by their spatial attributes (geographic
proximity)
3. detection of trends in the generalised pollen level
for the whole region over time
3.1 Segmentation
The task of segmentation consists of two major sub-
tasks, clustering and classification (Miller and Han,
2001). Spatial clustering involves grouping objects into
similar subclasses, whereas spatial classification in-
volves finding a description for those subclasses which
differentiates the clustered objects from each other (Es-
ter et al., 1998).
Pollen values are measured on a scale of 1 to 10(low
to very high). We defined 4 initial categories for seg-
mentation, these are:-
1. VeryHigh - {8,9,10}
2. High - {6,7}
3. Moderate - {4,5}
4. Low - {1,2,3}
These categories proved rather rigid for our pur-
poses. This was due to the fact that human forecasters
take a flexible approach to classifying pollen values.
For example, in the corpus the pollen value of 4 could
be referred to as both a moderate level of pollen and a
low-to-moderate level of pollen. This lead us to define
3 further categories which are derived from our 4 initial
categories:-
5. LowModerate - {3,4}
6. ModerateHigh - {5,6}
7. HighVeryhigh - {7,8}
Thus, the initial segmentation of data carried out by
our system is a two stage process. Firstly regions are
clustered into the initial four categories by pollen value.
The second stage involves merging adjacent categories
that only contain regions with adjacent values. For ex-
ample if we take the input data from Table 1, after the
first stage we have the sets:-
• {{AreaID=2,Value=5},{AreaID=3,Value=5}}
• {{AreaID=1,Value=6},{AreaID=4,Value=6}}
• {{AreaID=5,Value=8},{AreaID=6,Value=8}}
In stage two we create the union of the moderate and
high sets to give:-
• {{AreaID=1,Value=6},{AreaID=2,Value=5},
{AreaID=3,Value=5},{AreaID=4,Value=6}}
• {{AreaID=5,Value=8},{AreaID=6,Value=8}}
Although this initial segmentation could be accom-
plished all in one step, completing it in two steps pro-
vided a more simple software engineering solution.
We can now carry out further segmentation of these
sets according to their spatial attributes. In our set of
regions with ModerateHigh pollen levels we can see
that AreaIDs 1,2,3,4 are in fact all spatial neighbours.
The north, north east and north west regions can be
described spatially as the northern part of the country.
Therefore we can now say that ‘Pollen levels are at a
moderate to high 5 or 6 in the northern and central
parts of the country’ . Similarly, as the two members of
our set containing regions with VeryHigh pollen levels
are also spatial neighbours we can also say that ‘Pollen
levels are at a very high level 8 in the south of the coun-
try’. This process now yields the following two sets:-
• {{AreaID=1234,Value=[5,6]}}
• {{AreaID=56,Value=[8]}}
Our two sets we have now created can now be passed
to the Document Planner were they will be encapsu-
lated as individual Forecast messages.
3.2 Trend Detection
Trend detection in our system works by generalising
over all sets created by segmentation. From our two
sets we can say that generally pollen levels are high
over the whole of Scotland. Looking at the previous
days forecast we can detect a trend by comparing the
two generalisations. If the previous days forecast was
also high we can say ‘pollen levels remain at the high
165
levels of yesterday’. By looking further back, and if
those previous days were also high, we can say ‘pollen
levels remain at the high levels of recent days’. If the
previous days forecast was low, we can say ‘pollen lev-
els have increased from yesterdays low levels’. Our
data analysis module then conveys the information that
there is a relation between the general pollen level
of today and the general pollen level of some recent
timescale to the Document Planner, which then encap-
sulates the information as a Trend message.
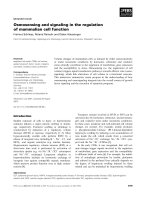
After the results of data analysis have been input into
the NLG pipeline the output in Figure 6 is produced.
‘Grass pollen levels for Monday remain at
the moderate to high levels of recent days
with values of around 5 to 6 across most parts
of the country. However, in southern areas,
pollen levels will be very high with values of
8.’
Figure 6: The output text from our system for the input
data in Table 1
4 Evaluation
A demo of the pollen forecasting system can be found
on the internet at
1
. The evaluation of the system is be-
ing carried out in two stages. The first stage has used
this demo to obtain feedback from expert meteorolo-
gists at AMI. We found the feedback on the system to
be very positive and hope to deploy the system for the
next pollen season. Two main areas identified for im-
provement of the generated texts:-
• Use of a more varied amount of referring expres-
sions for geographic locations.
• An ability to vary the length of the text dependent
on the context it was being used, i.e in a newspa-
per or being read aloud.
These issues will be dealt with subsequent releases
of the software. The second and more thorough evalu-
ation will be carried out when the system is deployed.
5 Further Research
The current work on pollen forecasts is carried out as
part of RoadSafe
2
a collaborative research project be-
tween University of Aberdeen and Aerospace and Ma-
rine International (UK) Ltd. The main objective of
the project is to automatically generate road mainte-
nance instructions to ensure efficient and correct ap-
plication of salt and grit to the roads during the win-
ter. The core requirement of this project is to describe
spatio-temporal data of detailed weather and road sur-
face temperature predictions textually. In a previous
1
www.csd.abdn.ac.uk/∼rturner/cgi
bin/pollen.html
2
www.csd.abdn.ac.uk/∼rturner/RoadSafe/
research project SumTime (Sripada et al., 2003) we
have developed techniques for producing textual sum-
maries of time series data. In RoadSafe we plan to ex-
tend these techniques to generate textual descriptions
of spatio-temporal data. Because the spatio-temporal
weather prediction data used in road maintenance ap-
plications is normally of the order of a megabyte, we
initially studied pollen forecasts which are based on
smaller spatio-temporal data sets. We will apply the
various techniques we have learnt from the study of
pollen forecasts to the spatio-temporal data from the
road maintenance application.
6 Summary
Automatically generating spatio-temporal descriptions
involves two main subtasks. The first subtask focuses
on the spatio-temporal analysis of the input data to
extract information required by the different message
types identified in the corpus analysis. The second sub-
task is to find appropriate linguistic form for the spatial
location or region information.
References
S. Boyd. 1998. Trend: a system for generating in-
telligent descriptions of time-series data. In IEEE
International Conference on Intelligent Processing
Systems (ICIPS1998).
J. Coch. 1998. Multimeteo: multilingual production
of weather forecasts. ELRA Newsletter, 3(2).
M. Ester, A. Frommelt, H. Kriegel, and J. Sander.
1998. Algorithms for characterization and trend de-
tection in spatial databases. In KDD, pages 44–50.
S. Geldof. 2003. Corpus analysis for nlg. cite-
seer.ist.psu.edu/583403.html.
E. Goldberg, N. Driedger, and R. Kittredge. 1994. Us-
ing natural-language processing to produce weather
forecasts. IEEE Expert, 9(2):45–53.
H. J. Miller and J. Han. 2001. Geographic Data Min-
ing and Knowledge Discovery. Taylor and Francis.
E. Reiter and R. Dale. 2000. Building Natural Lan-
guage Generation Systems. Cambridge University
Press.
E. Reiter, S. Sripada, and R. Robertson. 2003. Ac-
quiring correct knowledge for natural language gen-
eration. Journal of Artificial Intelligence Research,
18:491–516.
D. Roy and E. Reiter. 2005. Connecting language to
the world. Artificial Intelligence, 167:1–12.
S. Sripada, E. Reiter, and I. Davy. 2003. Sumtime-
mousam: Configurable marine weather forecast gen-
erator. Expert Update, 6:4–10.
166