Báo cáo Y học: Kinetic analysis of hydroxylation of saturated fatty acids by recombinant P450foxy produced by an Escherichia coli expression system docx
Bạn đang xem bản rút gọn của tài liệu. Xem và tải ngay bản đầy đủ của tài liệu tại đây (356.45 KB, 8 trang )
Kinetic analysis of hydroxylation of saturated fatty acids
by recombinant P450foxy produced by an
Escherichia coli
expression
system
7
Tatsuya
7
Kitazume
1
, Akinori Tanaka
1
, Naoki Takaya
1
, Akira Nakamura
1
, Shigeru Matsuyama
1
,
Takahisa Suzuki
1
and Hirofumi Shoun
2
1
Institute of Applied Biochemistry, University of Tsukuba, Tsukuba, Ibaraki, Japan;
2
Department of Biotechnology, Graduate School
of Agricultural and Life Sciences, The University of Tokyo, Japan
Cytochrome P450foxy (P450foxy, CYP505) is a fused pro-
tein of cytochrome P450 (P450) and its reductase isolated
from the fungus Fusarium oxysporum, which catalyzes the
subterminal (x-1x-3) hydroxylation of fatty acids. Here,
we produced, purified and characterized a fused recombin-
ant protein (rP450foxy) using the Escherichia coli expression
system. Purified rP450foxy was catalytically and spectrally
indistinguishable from the native protein, but most of the
rP450foxy was recovered in the soluble fraction of E. coli
cells unlike the membrane-bound native protein. The results
are consistent with our notion that the native protein is
targeted to the membrane by a post-translational modifica-
tion mechanism. We also discovered that P450foxy could use
shorter saturated fatty acid chains
1
(C9 and C10) as a sub-
strate. The regiospecificity (x-1x-3) of hydroxylation due
to the enzymatic reaction for the short substrates (decanoate,
C10; undecanoate, C11) was the same as that for longer
substrates. Steady state kinetic studies showed that the k
cat
values for all substrates tested (C9-C16) were of the same
magnitude (1200–1800 min
)1
), whereas the catalytic effi-
ciency (k
cat
/K
m
) was higher for longer fatty acids. Substrate
inhibition was observed with fatty acid substrates longer
than C13, and the degree of inhibition increased with
increasing chain length. This substrate inhibition was not
apparent with P450BM3, a bacterial counterpart of
P450foxy, which was the first obvious difference in their
catalytic properties to be identified. Kinetic data were
consistent with the inhibition due to binding of the second
substrate. We discuss the inhibition mechanism based on
differences between P450foxy and P450BM3 in key amino
acid residues for substrate binding.
Keywords: fatty acid hydroxylase; cytochrome P450;
P450foxy; dodecanoic acid; Fusarium oxysporum.
Cytochrome P450 (P450) is a group of heme proteins that
are widespread in nature [1–3]. It is generally accepted that
all P450s originated from the same, ancient gene (P450
superfamily), which has acquired unparalleled molecular
and functional diversity during evolution [1,4]. Most of the
P450 enzymes function as monooxygenases that act on
various lipophilic compounds, whereas others catalyze a
variety of reactions [2]. P450s can be classified into several
classes according to their redox partners [5,6]. Bacterial and
mitochondrial P450 systems are of class I; they receive
electrons from NAD(P)H via ferredoxin reductase and
ferredoxin coupling. Eukaryotic microsomal P450 systems
are of class II; they receive electrons from P450 reductase,
which contains both FAD and FMN. These two classes
comprise typical, multicomponent P450 monooxygenase
systems, whereas the functions of P450 are most diversified
in other classes. Class III P450s are not monooxygenases
but catalyze isomerization [7] or dehydration [8], and
require neither external redox equivalents nor any redox
partners. P450nor is the only class IV P450, and catalyzes
the reduction of nitric oxide (NO) to nitrous oxide (N
2
O)
using NAD(P)H as the direct electron donor [9]. The class
III and IV P450s are self-sufficient, meaning that they can
complete their functions without other proteinaceous
components.
This laboratory has isolated two unique P450s from the
fungus Fusarium oxysporum. One is P450nor (CYP55) as
described above [9–12], and the other is P450foxy (CYP505)
[13,14], both of which are self-sufficient. P450foxy is of the
class II type, but its self-sufficiency depends on fusion of the
P450 and the reductase domains on one gene and is thus
produced as a single polypeptide [14]. It catalyzes the
subterminal (x-1x-3) hydroxylation of fatty acids [13,15].
P450foxy closely resembles in some aspects, P450BM3
(CYP102) from Bacillus megaterium. The identity of the
predicted amino-acid sequence of P450foxy is closest to that
of P450BM3 in both the P450 and reductase domains. We
therefore concluded that P450foxy is the eukaryotic coun-
terpart of P450BM3. This conclusion raises the evolutio-
nary question of why phylogenetically distant organisms,
such as eukaryotes (F. oxysporum) and prokaryotes
(B. megaterium), share such closely related P450s. The only
obvious difference between P450foxy and P450BM3 iden-
tified so far is that of their intracellular localization.
P450foxy is exclusively recovered in the membrane fraction
Correspondence to H. Shoun, Department of Biotechnology,
Graduate School of Agricultural and Life Sciences, The University of
Tokyo, Bunkyo-ku, Tokyo 113-8657, Japan. Fax: + 81 35841 5148,
Tel.: + 81 35841 5148, E-mail:
Abbreviations: GC, gas chromatography; GC-EIMS, gas chromato-
graphy-electron impact mass chromatography; P450, cytochrome
P450, rP450foxy, recombinant P450foxy.
(Received 19 November 2001, revised 22 February 2002, accepted 25
February 2002)
Eur. J. Biochem. 269, 2075–2082 (2002) Ó FEBS 2002 doi:10.1046/j.1432-1033.2002.02855.x
like other eukaryotic P450s [14], whereas P450BM3 is a
soluble protein like other bacterial P450s.
Several P450 functions are of interest with respect to
potential industrial applications [16–18] and for basic studies.
The most inconvenient properties of the P450 system when
considering industrial applications would be the complexity
of its electron transport. In vitro P450 function can only be
exhibited in a reconstituted mixture of many components,
yet the activity is usually very low under such conditions. One
way to overcome this obstacle would be to use a fused
protein consisting of P450 and its reductase. Okawa et al.
originally constructed an artificial fused protein using the
yeast expression system and applied the system to the
bioconversion of fine chemicals [19]. Thereafter, P450BM3
[20] and P450foxy [13,14] were identified as naturally fused
proteins. The catalytic turnover of both P450s is exception-
ally high, possibly because they are catalytically self-
sufficient due to the fusion of two domains. The naturally
fused protein would be more useful for such applications and
attempts have made using P450BM3 [21,22].
We have produced recombinant P450foxy (rP450foxy) in
the host-vector system of Saccharomyces cerevisiae [14].
However, a more efficient production system is required for
advancing both basic and application studies of P450foxy.
Here, we describe the expression of P450foxy cDNA in
Escherichia coli, which resulted in the large-scale production
of rP450foxy. We also characterized the substrate specificity
and other catalytic properties.
MATERIALS AND METHODS
Strain, culture and media
Plasmids were constructed and rP450foxy was produced
using E. coli strains JM109 and DH5a, respectively. E. coli
strains were cultivated in Luria–Bertani broth (1% tryp-
tone, 0.5% yeast extract, 0.5% NaCl) and Terrific Broth
(1.2% tryptone, 2.4% yeast extract, 0.4% glycerol, 0.23%
KH
2
PO
4
, 0.125% K
2
HPO
4
) containing 50 lgÆmL
)1
amp-
icillin (LBA and TBA, respectively).
Construction of the expression plasmid
Plasmid pCWfoxy was constructed to produce recombinant
P450foxy in E. coli as follows. The cDNA of P450foxy [14]
was prepared by PCR using the respective 5¢ and 3¢ PCR
oligonucleotide primers:
5¢-CATATGGCTGAATCTGT
TCCGATTCCGGAAC
C
GCCGGGTTATCCGCTT-3¢ and 5¢-TGTTTGCTTG
ATCTCCAAAGCGTAGTT-3¢ (mutated residues are
underlined), which have homology to the nucleotide
sequences of the 5¢ and the 3¢ ends of the P450foxy
cDNA, respectively [14]. PCR products were purified,
digested by NdeIandBamHI, then ligated to the plasmid
vector pCWori+ [23] that had been digested with the same
restriction enzymes. The resulting plasmid was designated
pCWfoxy. Standard DNA techniques proceeded according
to Sambrook et al. [24].
Preparation of recombinant P450foxy
E. coli DH5a was transformed with pCWfoxy, cultured
in LBA overnight, transferred to 2 L of TBA in a 5-L
volume flask, and rotated at 120 r.p.m.
2
at 30 °C.
When D
600
¼ 0.5, 1 m
M
isopropyl thio-b-
D
-galactoside,
0.5 m
M
5-aminolevulinic acid and 1 lgÆmL
)1
chloram-
phenicol (final concentration) were added to the medium
and the flask was further incubated for 48 h under the
same conditions. The cells were then harvested by
centrifugation, suspended in 50 mL of buffer A (50 m
M
Mops/KOH, 10% glycerol, 1.0 m
M
dithiothreitol, 0.1 m
M
EDTA, pH 7.4) and disrupted using a French Pressure
Cell Press (Sim-Aminco, New York, USA)
3
at 20 000 psi.
The homogenate was centrifuged at 1800 g for 15 min to
remove cellular debris and unbroken cells. The resulting
cell free extract was centrifuged at 100 000 g for 60 min to
separate the supernatant (soluble) and pellet (membrane)
fractions. The soluble fraction was applied to a DEAE-
cellulose column (Whatman DE52) equilibrated with
buffer A. The column was washed, then proteins were
eluted with a 0–0.3
M
KCl gradient in buffer A. The
fraction containing heme was collected, dialyzed against
buffer A, and applied to a 2¢-,5¢-ADP Sepharose column
(Amersham Pharmacia Biotech) equilibrated with the
same buffer. A dark brown fraction that was eluted with
3m
M
NADPH in the same buffer was directly passed
through a Superdex 200 HR 10/30 column (Amersham
Pharmacia Biotech) equilibrated with buffer A. The sam-
ple after this elution step was used as purified rP450foxy.
Spectroscopy
Optical and fluorescence spectra were measured using a
Beckman DU 7500 spectrophotometer and a Hitachi
F-3010 fluorescence spectrophotometer, respectively. Heme
was identified and determined by the pyridine ferrohemo-
chromogen method using the molar absorption coefficient
(e) of the chromogen of the protoheme as 34.4 m
M
)1
Æcm
)1
at 557 nm [25]. FAD and FMN were identified and
quantified as described by Faeder & Siegel [26] using e at
450 nm ¼ 11.5 m
M
)1
Æcm
)1
. The P450 content was deter-
mined using an extinction coefficient of 91 m
M
)1
Æcm
)1
for
the difference in the carbon monoxide (CO) difference
spectrum between 450 nm and 490 nm [13]. The ratio in the
high/low spin states in the bound heme of P450 was
calculated as reported previously [27].
Enzyme assays
Fatty acid hydroxylase was assayed as described previously
[13]. The reaction mixture contained 50 m
M
Mes (pH 6.5),
1 l
M
FAD, 1 l
M
FMN, 10% glycerol, 125 l
M
NADPH,
and 125 l
M
fatty acid (final concentration). The reaction
was initiated by adding rP450foxy, then the A
340
was
followed at 30 °C using a Beckman DU-7500 spectropho-
tometer. NADPH-cytochrome c reductase was assayed as
described previously [13] in the same buffer containing
125 l
M
NADPH and 50 l
M
horse heart cytochrome c
(Sigma). Protein conxentration was determined using the
Bio-Rad protein assay reagent (Bio-Rad Laboratories Inc.,
CA, USA).
Data analysis
Steady state kinetic analyses for P450foxy were examined
with varying concentrations of fatty acid and a saturating
2076 T. Kitazume et al. (Eur. J. Biochem. 269) Ó FEBS 2002
concentration of the second substrate (NADPH, 125 l
M
).
Substrate inhibition was observed for longer fatty acid
substrates. Assuming that the inhibition depended on the
second binding of fatty acid substrate at its higher concen-
trations, the data were fitted to Eqn (1) using
ORIGIN
Software, in which v, e, and [S] represent the experimentally
determined initial velocity, and the enzyme and the substrate
(fatty acid) concentrations, respectively. K
s
represents the
dissociation constant for the second binding of S.
v=e ¼ k
cat
½S=fK
m
þ½Sð1 þ½S=K
S
Þg ð1Þ
Determination of the reaction products
The structures of the reaction products (hydroxyl fatty
acids) of rP450foxy were determined fundamentally as
described previously [15] by gas chromatography (GC) and
GC-electron impact-mass spectrometry (GC-EIMS). Prior
to analysis, the carboxyl group of the products was blocked
by methylation with diazomethane and the hydroxyl group
was trimethyl-silylated (TMSlated) with TMSI-H (GL
Science Ltd, Tokyo, Japan)
4
.
RESULTS
Production of recombinant P450foxy
A cDNA of P450foxy was expressed in E. coli DH5a cells
under the control of the lac promoter resident in the
pCWori+ vector. To improve production, the nucleotide
sequence on the 5¢ end was mutated without changing the
encoding amino-acid sequence so as to become more A/T
rich, with the exception of proline codons that were mutated
to CCG, the most frequently used proline codon in E. coli
genes. The expression and production of the recombinant
protein was confirmed by the presence of the characteristic
chromophore in the cell free extract of the transformants,
which gave a specific content of 0.021 nmol P450 Æ(mg
protein)
)1
and a yield of 10 mg P450Æ(g wet cells)
)1
.This
yield was much higher than that attained using the yeast
system [0.2 mg P450Æ(g wet cells)
)1
] [14]. Most P450
(>88%) was recovered in the soluble fraction like the
recombinant protein produced by the yeast system [14] but
in contrast to native P450foxy, which is cofractionated with
themembranefractionofF. oxysporum [13]. The produc-
tion of rP450foxy in the E. coli system was further
confirmed by Western blotting that gave a specific signal
with the predicted M
r
of 118 000 (data not shown) and
dodecanoic acid-dependent NADPH oxidase activity. None
of these properties characteristic of P450foxy were detected
in the extract of E. coli cells that harbored only the vector.
The fraction containing P450 was purified to homogeneity
from the soluble fraction at a yield of 26%. The M
r
estimated by SDS/PAGE and gel filtration
5
was 118 000 and
132 000, respectively, indicating that rP450foxy exists as a
monomer-like native protein and rP450foxy produced by
yeast [14].
Spectral properties
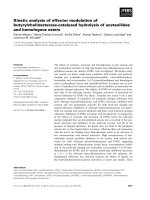
The absorption spectra of purified rP450foxy (Fig. 1) in
its resting oxidized, dithionite-reduced ferrous, and car-
bon monoxide (CO)-ligated forms are identical to the
corresponding spectra of native P450foxy purified from
F. oxysporum [13]. The CO-difference spectrum with a
peak at 448 nm and a trough at 407 nm (Fig. 1, inset)
was also identical. The calculated heme content was
0.4 mol of protoheme per mol of protein. In contrast to
these spectral characteristics due to the bound heme, the
absorbance around 450 nm (characteristic of flavin) was
not prominent, with resting rP450foxy similar to the
native protein, possibly because of a low flavin content.
However, the presence of flavin in rP450foxy was
confirmed by the characteristic fluorescence that accom-
panied the emission (excited at 450 nm) peak at 528 nm.
The calculated specific contents of FAD and FMN were
0.15 and 0.65 molÆ(mol protein)
)1
, respectively. Native
P450foxy also has a low content of these cofactors (heme
and flavins) [13]. These results indicate that rP450foxy is
correctly folded in heterologous bacterial cells.
Catalytic activities
Because of the low flavin content, the activity of purified
rP450foxy was low. A prior incubation with free FAD and
FMN remarkably accelerated the specific activity of
rP450foxy as observed with the native enzyme [28]. Dodec-
anoic acid hydroxylase and NADPH-cytochrome c reduc-
tase were assayed for rP450foxy and compared with the
findings obtained using the native [13] and recombinant
protein produced in the yeast host [14] (Table 1). We found
that the NADPH-cytochrome c reductase activities of
P450foxy are enhanced in the presence of the substrate
(fatty acid) to be hydroxylated [13]. We also found the same
phenomenon with rP450foxy (dodecanoic acid) (Table 1).
The specific activities of rP450foxy with respect to fatty acid
hydroxylase and cytochrome c reductase were similar to
those for the recombinant protein produced in the yeast or
the native fungal protein [13,14]. These results demonstrated
that rP450foxy produced by E. coli is kinetically and
spectrally (above results) indistinguishable from the native
protein.
Fig. 1. Absorption spectra of rP450foxy. Solid line, resting (oxidized);
dotted line, dithionite-reduced; dashed line, dithionite-reduced + CO.
Inset, CO-difference spectrum (CO-bound minus dithionite-reduced);
7.2 l
M
purified rP450foxy in 100 m
M
sodium phosphate buffer
(pH 7.3), 10% glycerol, at room temperature.
Ó FEBS 2002 Fungal P450foxy catalyzing fatty acid hydroxylation (Eur. J. Biochem. 269) 2077
We determined the substrate specificity of rP450foxy
against saturated fatty acids. Figure 2 shows that rP450foxy
was active against fatty acids with a chain length of C9 (nine
carbon atoms, nonanoic acid) to C18 (18 carbon atoms,
octadecanoic acid), with the activity on tridecanoic acid
(C13) being the highest. These results are similar to those
obtained using the native protein [13], but rP450foxy can
also efficiently use the shorter substrate, nonanoic acid (C9).
Stoichiometry between the consumption of NADPH and
O
2
was 1.3 : 1 with all of the enzymatic reactions on
substrates with chains of C10 to C15 in length (data not
shown), consistent with the theoretical value for 2 electron
reduction coupling to monooxygenation of the substrates.
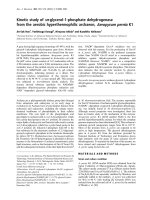
Interaction of the resting rP450foxy with the substrate
fatty acids
Spectral changes were observed upon mixing the resting
rP450foxy with saturated fatty acids with chain length from
C8 to C18. They were typical of type I spectral change that
is generally observed upon binding to P450 of the substrate
to be hydroxylated [29]. That is, the ratio in the high-spin
state heme with a Soret peak at around 388 nm increased
and the low-spin state heme with a peak at around 418 nm
decreased (Fig. 3). The extent of the fatty-acid-chain length
that could afford the spectral change (C8-C18) almost
completely agreed with the substrate specificity determined
with respect to the overall activity above (C9-C18). The K
d
value of the enzyme–substrate complex (Table 2) and the
maximal absorbance change can be obtained by the
spectrophotometric titration using this spectral change. As
observed in Fig. 3, addition of the substrate did not cause a
complete exchange from low to high spin states. The ratio of
high-spin state heme was obtained for each rP450foxy–
fatty-acid complex from the maximal absorbance change
(Table 2) [27]. The ratio of high spin was higher for the
complexwithalongerfattyaciduptoC15.Wecouldnot
determine this ratio with the longer fatty acids (C16-C18)
because of the extremely low water-solubility of these fatty
acids. The spectral change with octanoic acid linearly
increaseduptoasubstrateconcentrationof3m
M
,whichis
the determination limit defined by the solubility of the fatty
acid, indicating that the K
d
for octanoate would be over
3m
M
. These results showed that the heme in rP450foxy is in
equilibrium between high and low spin states when a fatty
acid substrate binds and that the chain length of the
substrate affects the equilibrium.
Steady-state kinetics
Apparent K
m
and k
cat
values for fatty acid substrates were
determined (Table 2). The K
m
value was in a similar range
(8–36 l
M
) between the substrates from C12 to C16, and
each value approximately agreed with the respective K
d
value for the same substrate. In contrast, the K
m
value
increased with decreasing chain length of the substrate
Table 1. Catalytic activities of native and recombinant P450foxy. Data are mean values of three experiments.
Enzyme
Activity (nmol NADPHÆmin
)1
Ænmol P450
)1
)
Dodecanoic acid
hydroxylase
Cytochrome c
reductase
Cytochrome c reductase
(with 150 l
M
dodecanoic acid)
rP450foxy (E. coli) 1460 ± 100 1400 ± 190 3300 ± 710
rP450foxy (Yeast)
a
1210 ± 110 890 ± 50 1590 ± 140
P450foxy (Fusarium)
b
1200 900 2,000
a
Kitazume et al. [14].
b
Nakayama et al. [13].
Fig. 2. Apparent substrate specificity of rP450foxy for saturated fatty
acids. Enzymatic activity was assayed at a fixed concentration (125 l
M
)
of fatty acid (C9-C18). C means control reaction without fatty acid.
Data are mean values of three experiments.
Fig. 3. Spectral perturbation in rP450foxy caused by pentadecanoic
acid. (A) Absorption spectra of rP450foxy [6 l
M
in 50 m
M
Mes
(pH 6.5), 1 l
M
FAD, 1 l
M
FMN, 10% glycerol, at 30 °C] in the
presence of 0, 2.5, 5, 7.5, 10, 15, 20, 30, 40, 50 l
M
pentadecanoic acid,
respectively (lines 1–10). (B) Difference spectra. Each difference spec-
trum was obtained by subtracting line 1 from each of lines 2–10 in A.
2078 T. Kitazume et al. (Eur. J. Biochem. 269) Ó FEBS 2002
below C12 (dodecanoic acid), and became larger than the
K
d
value for the same substrate. The kinetic constants for
fatty acids over C16 could not be obtained because of the
substrate inhibition. The k
cat
value was of the same
magnitude for all substrates tested (1200–1800 min
)1
).
Substrate inhibition occurred for fatty acids with a chain
length of C13 or longer (Fig. 4). The inhibition was
apparent at higher substrate concentration and was eluci-
dated by the mechanism described in Eqn (1), in which a
second substrate binds to form an abortive enzyme-
substrate complex. Such inhibition was not evident when
the chain length of the fatty acids was shorter than C13 (C9
to C12). The data fit closely with the respective curves
calculated on the basis of Eqn (1) with the K
s
for
tetradecanoic, pentadecanoic and hexadecanoic acids being
1100, 770, and 70 l
M
, respectively (Table 2). These results
indicate that the substrate inhibition is stronger for longer
fatty acid substrates. The substrate inhibition can elucidate
well the apparent discrepancy that the apparent activity
decreased for substrates longer than C13 (Fig. 2) although
the catalytic efficiency (k
cat
/K
m
) paradoxically increased
(Table 2). Such substrate inhibition with P450BM3 has not
been reported.
We also conducted assays to determine the kinetic
constants for the electron donors, NADPH and NADH,
using a saturated concentration (150 l
M
) of dodecanoic
acid as the substrate. The K
m
for NADPH was too low to be
determined, and may have been in the order of 10
)6
M
or
lower. The K
m
for NADH was 74 l
M
. These results are
same as those obtained with the native enzyme [13].
Determination of the reaction products
We identified the metabolites (reaction products) of fatty
acids due to the enzymatic reaction of rP450foxy by GC-
EIMS. The results using dodecanoic acid (C12) are shown in
Fig. 5. The derivatives of products were separated into three
peaks on GC (Fig. 5A), each of which gave a fragment
pattern typical of TMSlated alcohol on electron impact mass
chromatography (EIMS)
6
(Fig. 5B–D). The mass number of
each fragment identified these metabolites as x-1, x-2 and
x-3 hydroxy derivatives of dodecanoic acid, respectively.
The ratio of these metabolites was estimated from the signal
intensity on GC (Fig. 6). These results using a C12 fatty acid
are similar to those we obtained using cell-free extracts of
F. oxysporum [15]. However, the present study is the first to
identify the reaction products of purified P450foxy. We also
confirmed that the time-dependent decrease of the substrate
during the enzymatic reaction approximately agreed with
the accompanying increase in the sum of the products (data
not shown). The same sets of experiments were replicated
for, decanoic and undecanoic acids as substrates, and the
ratio of the three products is shown in Fig. 6.
DISCUSSION
We produced rP450foxy using an E. coli expression system
in a yield that was 50-fold higher than that obtained using
the yeast system [14]. The recombinant protein was
produced as a soluble protein unlike native fungal P450foxy
that is membrane-bound. However, the known catalytic
and spectral properties of rP450foxy are indistinguishable
from those of the native protein, supporting our previous
conclusion that native P450foxy is targeted to the mem-
brane by post (or co) translational modification in fungal
cells. We also showed that the enzymatic reaction of
P450foxy exhibits a similar regiospecificity (x-1x-3)ofthe
reaction products for fatty acids with shorter chains (C10,
C11) to that for longer fatty acids [15]. We generated far
more purified P450foxy using this system than the original
fungal cells [13] or the yeast host-vector system [14]. Thus,
this unique P450 can be more extensively studied.
Table 2. Kinetic constants of rP450foxy for various saturated fatty acids. Data are mean values for more than five experiments. Standard errors are
below 20%. ND, not determined.
Substrate
a
K
d
(l
M
)
K
m
(l
M
)
K
s
(l
M
)
k
cat
(min
)1
)
k
cat
/K
m
(min
)1
Æl
M
)1
)
Spin state
high spin(%)
Nonanoic acid 170.0 3200 > 2000 1500 0.5 25
Decanoic acid 8.7 260 > 2000 1200 4.6 23
Undecanoic acid 14.0 160 > 2000 1900 11.5 30
Dodecanoic acid 9.4 30 > 2000 1500 49.1 33
Tridecanoic acid 9.0 36 > 2000 1800 62.7 46
Tetradecanoic acid 2.8 19 1100 1300 68.4 43
Pentadecanoic acid 8.4 8 770 1300 163 74
Hexadecanoic acid ND 10 70 1800 180 ND
a
Kinetic constants could not be determined using octanoic, heptadecanoic and octadecanoic acids as substrates.
Fig. 4. Steady state kinetics of long-chain fatty acids. Substrates are
tridecanoic acid (j), tetradecanoic acid (d), pentadecanoic acid (s),
and hexadecanoic acid (h).
Ó FEBS 2002 Fungal P450foxy catalyzing fatty acid hydroxylation (Eur. J. Biochem. 269) 2079
Analyses by steady state kinetics revealed a novel feature
of P450foxy with respect to substrate specificity. We
examined substrates shorter than C10 (C8, C9), and found
that the C9 fatty acid can be a significant substrate although
the K
m
value was very large (Table 2). The present and
previous results [13] showed that P450foxy has activity for
C9-C18 fatty acids, although fatty acids longer than C18
have not been examined. Regardless, the substrate specif-
icity of P450foxy is distributed among saturated fatty acids
with a rather shorter chain length than those for P450BM3
(C12-C20). The apparent activity at a fixed substrate
concentration was highest against a C13 fatty acid (Fig. 2)
whereas the catalytic efficiency (k
cat
/K
m
) was higher against
longer substrates (Table 2). This discrepancy can be
explained by the inhibition that increased with longer
substrates. Both K
m
and K
d
values were similar for longer
fatty acids whereas K
m
became much larger than K
d
for
fatty acids shorter than C12. As K
m
¼ (k
cat
+ k
off
)/k
on
and K
d
¼ k
off
/k
on
,wherek
on
and k
off
are, respectively, the
rate constants for association and dissociation of the
substrate, and k
cat
is almost constant for all substrates
tested (Table 2), the results mean that both k
on
and k
off
values became much smaller when the chain length of the
fatty acid decreased. In other words, rapid equilibrium
cannot be assumed for the enzymatic reaction with short
chain substrates.
Here, we discovered a prominent difference in the
catalytic properties of P450foxy and P450BM3, namely,
substrate inhibition with P450foxy. This could be explained
by the binding of the second substrate (Eqn 1). At present,
the structural basis of the substrate-binding site of P450foxy
is not known, but alignment of the amino-acid sequences
between P450foxy and P450BM3 implies similarities with
the interaction of P450foxy with fatty acid substrates.
Crystallographic and mutational studies have shown that
several amino-acid residues are critical for the binding of
substrate to P450BM3. Arg47 and Tyr51 are located at the
entrance of the substrate-accessing channel, and their
guanidinium and hydroxyl groups, respectively, play crucial
roles in the binding of the substrate by interacting with the
carboxyl group of the substrate fatty acids [30–32]. Phe42 is
located close to the entrance and its aromatic residue may be
a lid that excludes solvent water to strengthen the electro-
static interaction of Arg47 and the substrates [30–32]. The
corresponding amino-acid residues to those in P450foxy are
Leu43, Lys48, and Phe52, respectively [14]. Inside the
entrance, the hydrophobic residues, Leu75, Phe87, Leu181,
Ile263, and Leu437, form a hydrophobic stretch in
P450BM3 that allow access to the aliphatic chains of fatty
acids. All of these residues are conserved in P450foxy.
These alignments indicate that all of the key amino-acid
residues at the entrance of the active site pocket of
P450BM3 (Phe42, Arg47, and Tyr51) are replaced by
others (Leu43, Lys48, and Phe52) in P450foxy although all
of other key residues inside the pocket are conserved. The
positive charge essential for fixing the carboxylate of fatty
acids is maintained by replacing Arg with Lys. However,
hydrophobicity at the entrance to P450foxy should be
significantly increased as the result of the substitutions from
Phe to Leu and from Tyr to Phe. Why substrate inhibition is
observed only with P450foxy may be explained by these
substitutions. The first interaction of P450BM3 with fatty
acids may occur between the carboxylate anion of the
Fig. 5. Gas chromatographic separation (A)
and EIMS-spectra of TMSlated and methyla-
ted derivatives of the reaction products (B–D)
from dodecanoic acid. Mass spectra of deriva-
tives 1–3 (A) are shown in B–D, respectively.
Relative abundance of ions in panel D was
expanded by threefold for fragments with high
m/z-values (indicated by horizontal arrow).
Fig. 6. Regio-specificity of reaction products determined with the
substrates, decanoic (C10), undecanoic (C11), and dodecanoic (C12)
acids. Relative amount of each product was determined by the extent
to which corresponding peaks separated on GC. Closed, open,
and striped bars represent x-1, x-2, and x-3 hydroxy fatty acids,
respectively.
2080 T. Kitazume et al. (Eur. J. Biochem. 269) Ó FEBS 2002
substrates and Arg47 and Tyr51 residues of the protein [30–
32]. The aliphatic head of fatty acids would then turn and
penetrate the access channel. The more hydrophobic
environment around the entrance of P450foxy would permit
another fatty acid molecule to partially penetrate the
channel from its aliphatic head even after the first molecule
has already occupied the channel. The stronger substrate
inhibition by longer fatty acids suggests a larger contribu-
tion of the aliphatic chain of fatty acids to their binding, as
compared with P450BM3. In other words, the interaction of
P450foxy with the carboxylate anion of fatty acids at the
entrance is relatively weaker than that of P450BM3. This
notion is supported by the fact that Phe52 in P450foxy
replaces Tyr51 in P450BM3, which makes it impossible to
have the hydrogen bonding that supports the electrostatic
interaction of the positive charge (Lys48 in case of
P450foxy) with the carboxylate. The effectiveness of shorter
fatty acids as substrates for P450foxy also agrees with this
replacement, as the interaction at the entrance must be more
flexible for the aliphatic head with a shorter chain to reach
the active site near heme. The fact that such important
amino-acid residues are not conserved between P450foxy
and P450BM3 is notable. These results demonstrate that
P450foxy and P450BM3 would be an interesting basis for
protein engineering studies from both basic and application
aspects.
ACKNOWLEDGEMENTS
This study was supported by PROBRAIN (Program for Promotion of
Basic Research Activities for Innovative Biosciences), SBPB (Structural
Biology Sakabe Project) of FAIS (Foundation for Advancement of
International Science), and Grant-in-Aid for Scientific Research from
Ministry of Education, Science, Culture and Sports of Japan.
REFERENCES
1. Omura, T. (1999) Forty years of cytochrome P450. Biochem.
Biophys. Res. Commun. 266, 690–698.
2. Sono, M., Roach, M.P., Coulter, E.D. & Dawson, J.H. (1996)
Heme-containing oxygenases. Chem. Rev. 96, 2841–2887.
3. Nelson, D.R., Koymans, L., Kamataki, T., Stegeman, J.J.,
Feyereisen, R., Waxman, D.J., Waterman, M.R., Gotoh, O.,
Coon, M.J., Estabrook, R.W. et al. (1996) P450 superfamily:
update on new sequences, gene mapping, accession numbers and
nomenclature. Pharmacogenetics 6, 1–42.
4. Nelson, D.R. (1999) Cytochrome P450 and the individuality of
species. Arch. Biochem. Biophys. 369, 1–10.
5. Boddupalli, S.S., Hasemann, A.C., Ravichandran, G.K., Lu, Y.J.,
Goldsmith, J.E., Deisenhofer, J. & Peterson, A.J. (1992) Crystal-
lization and preliminary X-ray diffraction analysis of P450terp and
the hemoprotein domain of P450BM-3, enzymes belonging to two
distinct classes of the cytochrome P450 superfamily. Proc. Natl
Acad.Sci.USA89, 5567–5571.
6. Shimizu, H., Park, Y.S., Lee, S.D., Shoun, H. & Shiro, Y. (2000)
Crystal structures of cytochrome P450nor and its mutants
(Ser286 fi Val, Thr) in the ferric resting state at cryogenic tem-
perature: a comparative analysis with monooxygenase cyto-
chrome P450s. J. Inorgan. Biochem. 81, 191–205.
7. Haurand, M. & Ullrich, V. (1985) Isolation and characterization
of thromboxane synthase from human platelets as a cytochrome
P-450 enzyme. J. Biol. Chem. 260, 15059–15067.
8. Song, W.C. & Brash, A.R. (1991) Purification of an allene oxide
synthase and identification of the enzyme as a cytochrome P-450.
Science 253, 781–784.
9. Nakahara, K., Tanimoto, T., Hatano, K., Usuda, K. & Shoun, H.
(1993) Cytochrome P-450 55A1 (P-450dNIR) acts as nitric oxide
reductase employing NADH as the direct electron donor. J. Biol.
Chem. 268, 8350–8355.
10. Kizawa, H., Tomura, D., Oda, M., Fukamizu, A., Hoshino, T.,
Gotoh, O., Yasui, T. & Shoun, H. (1991) Nucleotide sequence of
the unique nitrate/nitrite-inducible cytochrome P-450 cDNA from
Fusarium oxysporum. J. Biol. Chem. 266, 10632–10637.
11. Park, S.Y., Shimizu, H., Adachi, S., Nakagawa, A., Tanaka, I.,
Nakahara, K. & Shoun, H. (1997) Crystal structure of nitric oxide
reductase from denitrifying fungus Fusarium oxysporum. Nat.
Struct. Biol. 10, 827–832.
12. Kudo, T., Tomura, D., Liu, D., Dai, X. & Shoun, H. (1996) Two
isozymes of P450nor of Cylindrocarpon tonkinense:molecular
cloning of the cDNAs and genes, expressions in the yeast, and the
putative NAD(P) H-binding site. Biochimie 78, 792–799.
13. Nakayama, N., Takemae, A. & Shoun, H. (1996) Cytochrome
P450foxy, a catalytically self-sufficient fatty acid hydroxylase of
the fungus Fusarium oxysporum. J. Biochem. 119, 435–440.
14. Kitazume, T., Takaya, N., Nakayama, N. & Shoun, H. (2000)
Fusarium oxysporum fatty-acid subterminal hydroxylase
(CYP505) is a membrane-bound eukaryotic counterpart of
Bacillus megaterium cytochrome P450BM3. J. Biol. Chem. 275,
39734–39740.
15. Shoun, H., Sudo, Y. & Beppu, T. (1985) Subterminal hydro-
xylation of fatty acids by a cytochrome P-450-dependent enzyme
system from a fungus, Fusarium oxysporum. J. Biochem. 97, 755–
763.
16. Tsujita,Y.,Ikeda,T.,Serizawa,N.,Hishimura,A.&Komai,T.
(1997) Pravastatin sodium: new clinical aspects and recent pro-
gress. Ann. Report Sankyo Res. Lab. 49, 1–61.
17. Shiota, N., Nagasawa, A., Sakaki, T., Yabusaki, Y. & Ohkawa,
H. (1994) Herbicide-resistant tobacco plants expressing the fused
enzyme between rat cytochrome P4501A1 (CYP1A1) and yeast
NADPH-cytochrome P450 oxidoreductase. Plant Physiol. 106,
17–23.
18. Carmichael, A.B. & Wong, L.L. (2001) Protein engineering of
Bacillus megaterium CYP102. The oxidation of polycyclic aro-
matic hydrocarbons. Eur. J. Biochem. 268, 3117–3125.
19. Murakami, H., Yabusaki, Y., Sakaki, T., Shibata, M. & Ohkawa,
H. (1987) A genetically engineered P450 monooxygenase: con-
struction of the functional fused enzyme between rat cytochrome
P450c and NADPH-cytochrome P450 reductase. DNA 6, 189–
197.
20. Narhi, L.O. & Fulco, A.J. (1986) Characterization of a catalyti-
cally self-sufficient 119,000-dalton cytochrome P-450 mono-
oxygenase induced by barbiturates in Bacillus megaterium. J. Biol.
Chem. 261, 7160–7169.
21. Schneider, S., Wubbolts, M.G., Sanglard, D. & Witholt, B. (1998)
Biocatalyst engineering by assembly of fatty acid transport and
oxidation activities for In vivo application of cytochrome
P-450BM-3 monooxygenase. Appl. Environ. Microbiol. 64, 3784–
3790.
22. Schneider, S., Wubbolts, M.G., Oesterhelt, G., Sanglard, D. &
Witholt, B. (1999) Controlled regioselectivity of fatty acid oxida-
tion by whole cells producing cytochrome P450BM-3 mono-
oxygenase under varied dissolved oxygen concentrations.
Biotechnol. Bioeng. 64, 333–341.
23. Muchmore, D.C., McIntosh, L.P., Russell, C.B., Anderson, D.E.
& Dahlquist, F.W. (1989) Expression and nitrogen-15 labeling of
proteins for proton and nitrogen-15 nuclear magnetic resonance.
Methods Enzymol. 177, 44–73.
24. Sambrook, J., Fritsch, E.F. & Maniatis, T. (1989) Molecular
Cloning: a Laboratory Manual, 2nd edn. Cold Spring Harbor
Laboratory, Cold Spring Harbor Press, New York.
25. Falk, J.E. (1964) Porphyrins and Metalloporphyrins.Elsevier,
Amsterdam.
Ó FEBS 2002 Fungal P450foxy catalyzing fatty acid hydroxylation (Eur. J. Biochem. 269) 2081
26. Faeder, E.J. & Siegel, L.M. (1973) A rapid micromethod for
determination of FMN and FAD in mixtures. Anal. Biochem. 53,
332–336.
27. Okamoto, N., Imai, Y., Shoun, H. & Shiro, Y. (1998) Site-directed
mutagenesis of the conserved Threonine (Thr243) of the distal
helix of fungal cytochrome P450nor. Biochemistry 37, 8839–8847.
28. Nakayama, N. & Shoun, H. (1994) Fatty acid hydroxylase of the
fungus Fusarium oxysporum is possibly a fused protein of cyto-
chrome P-450 and its reductase. Biochem. Biophys. Res. Commun.
202, 586–590.
29. Truan, G. & Peterson, A.J. (1998) Thr268 in substrate binding and
catalysis in P450BM-3. Arch. Biochem. Biophys. 349, 53–64.
30. Li, H Y. & Poulos, T.L. (1997) The structure of the cytochrome
p450BM-3 haem domain complexed with the fatty acid substrate,
palmitoleic acid. Nat. Struct. Biol. 4, 140–146.
31. Oliver, C.F., Modi, S., Primrose, W.U., Lian, L Y. & Roberts,
G.C.K. (1997) Engineering the substrate specificity of Bacillus
megaterium cytochrome P-450 BM3: hydroxylation of alkyl
trimethylammonium compounds. Biochem. J. 327, 537–544.
32. Noble, M.A., Miles, C.S., Chapman, S.K., Lysek, D.A., MacKay,
A.C.,Reid,G.A.,Hanzlik,R.P.&Munro,A.W.(1999)Rolesof
key active-site residues in flavocytochrome P450 BM3. Biochem.
J. 339, 371–379.
2082 T. Kitazume et al. (Eur. J. Biochem. 269) Ó FEBS 2002