tiểu luận kinh tế lượng factors affecting the capital structure of food companies listed on ho chi minh stock exchange
Bạn đang xem bản rút gọn của tài liệu. Xem và tải ngay bản đầy đủ của tài liệu tại đây (331.75 KB, 41 trang )
FOREIGN TRADE UNIVERSITY
FACULTY OF INTERNATIONAL ECONOMICS
----------------------------------------------------------GROUP ASSIGNMENT – FINANCIAL ECONOMETRICS
FACTORS AFFECTING THE CAPITAL STRUCTURE OF FOOD
COMPANIES LISTED ON HO CHI MINH STOCK EXCHANGE
Class: KTEE310.1
Lecturer: Ms. Nguyen Thuy Quynh
Members: Vũ Ngọc Quỳnh - 1813340057
Phạm Mai Dương - 1813340015
Phạm Thị Vân Anh - 1613340005
Hanoi 12/2019
1
LUAN VAN CHAT LUONG download : add
TABLE OF CONTENTS
ABSTRACT...................................................................................................................... 4
INTRODUCTION............................................................................................................5
1.
Rationale for the study......................................................................................................5
2.
Research questions and objectives...................................................................................6
3.
Research subject and scope...............................................................................................7
4.
Research methodology.......................................................................................................7
5.
The structure of report......................................................................................................7
SECTION 1: OVERVIEW OF THE TOPIC.................................................................9
1.1 Overview about the capital structure................................................................................9
1.1.1 Definition of capital structure...................................................................................................9
1.1.2 The roles of capital structure....................................................................................................9
1.2
The capital structure theories.....................................................................................10
1.2.1 Modigliani and Miller (M&M) theory....................................................................................10
1.2.2 Agency cost theory...................................................................................................................10
1.2.3 Trade-off theory.....................................................................................................................11
1.2.4 Pecking-order theories............................................................................................................12
1.3
Determinants of capital structures.............................................................................13
1.3.1 Firm size..............................................................................................................................13
1.3.2 Growth opportunities...........................................................................................................14
1.3.3 Profitability..........................................................................................................................15
1.3.4 Tangible fixed assets...........................................................................................................15
1.3.5 Tax rate...................................................................................................................................16
1.3.6 Industry characteristics...........................................................................................................16
SECTION 2: MODEL SPECIFICATION...................................................................17
2.1 Data collection....................................................................................................................17
2.2 Data analysis.......................................................................................................................17
2.2.1 The dependent variables..........................................................................................................17
2.2.2 The independent variables......................................................................................................17
3.3 Building the research model.............................................................................................21
3.4 Describe the data................................................................................................................22
3.4.1 Descriptive statistics................................................................................................................22
3.4.2 Correlation matrix...................................................................................................................25
SECTION 3: FINDINGS AND RESULTS..................................................................27
3.1 Estimated models...............................................................................................................27
3.1.1 OLS regression.......................................................................................................................27
2
LUAN VAN CHAT LUONG download : add
3.1.2 REM and FEM regression.....................................................................................................27
3.2 Testing the model’s defect.................................................................................................30
3.2.1 Heteroskedasticity test.............................................................................................................30
3.2.2 VIF Test...................................................................................................................................30
3.3 Discussion on the estimated model...................................................................................31
3.3.1 Profitability.............................................................................................................................31
3.3.2 Firm size..................................................................................................................................32
3.3.3 Tangible fixed assets...............................................................................................................32
3.3.4 Growth opportunities...............................................................................................................33
3.3.5 Corporate tax rate...................................................................................................................34
3.3.6 Firm characteristics................................................................................................................35
3.4 Recommendations..............................................................................................................35
3.4.1 Recommendations for the companies.....................................................................................35
3.4.2 Recommendations for the Government..................................................................................37
REFERENCES...............................................................................................................39
INDIVIDUAL ASSESSMENT......................................................................................41
3
LUAN VAN CHAT LUONG download : add
ABSTRACT
Capital structure is a financial concept that reflects the ratio between the loan and
the equity that the firm uses. Determining an optimal capital structure is important in
business operations. Since the optimal capital structure will help businesses minimize
their weighted average cost of capital (WACC), thereby it can maximize the value of
their assets. In addition, the capital structure affects the profitability and business risk that
the business may face. Therefore, choosing a capital structure between the loan and
equity plays a crucial role in financial management. In fact, the capital structure will vary
depending on the characteristics of each business enterprise, the sector in which it
operates, and the effects of macroeconomic fluctuations, cultural factors and religion.
Rather than finding out what percentage of equity is optimal, financial researchers are
often interested in finding out what factors influence the decision to use the loan or
financial leverage of the firm. It is from the correlation between these factors and the
capital structure that we can evaluate whether the decision to use the loan or the equity of
the business is reasonable or unreasonable. Regardingly, the purpose of this paper is to
examine the factors affecting the capital structure of the food companies listed on Ho Chi
Minh stock exchange. Accordingly, data collection is conducted among 10 firms listed on
HOSE. The research findings revealed that the factors influencing on capital structure on
these firms include tangible fixed assets, firm size, profitability, growth opportunity and
liquidity. In specific, tangible fixed assets have the strongest impact and firm size has the
weakest impact. Based on that, the paper also proposes some recommendation and
suggestion to enhance the capital structure of these firms.
4
LUAN VAN CHAT LUONG download : add
INTRODUCTION
1. Rationale for the study
Firms make their decisions to get the most out of the proportion they are using of
their capital. How to structure capital is the very first question that financial managers ask
themselves before getting into any financial activity. Capital structure is not only
concerned with discovering the right class of finance, but it is more than that; it focuses
on the optimal mix that should be created to maximize the shareholder’s wealth. In
addition, capital structure affects the profitability and business risks that businesses
themselves may encounter (Frank and Goyal, 2009). Therefore, choosing a capital
structure between debt and equity plays an important role in financial management.
In fact, the variance of capital structure depending on the characteristics of each
firm, the sector in which it operates, as well as the effects of macro and micro-economic
factors. Hence, instead of determining an optimal capital structure, the financial managers
often consider finding the influential factors to it, or in other words, the firms’ use of
financial leverage. From the correlation between these factors and capital structure, we
can assess whether the decision to use the loan or equity of the enterprise is reasonable or
unreasonable, the shortcomings and risks arising from it, and based on that, to propose
solutions to improve the efficiency of financial leverage and maximize asset value for
businesses.
Currently, there haven’t still not many studies related to the capital structure in
equitized enterprises in Vietnam. The key reason is that the problem of financial
management in many businesses has not been respected. Besides, a large number of
corporations have been equitized from state-owned enterprises, so they have also
inherited the obligations and rights of the old company, and not considering about the
efficiency of capital structuring. However, in the context of Vietnam’s economic
integration, enhancing the efficiency of capital structure needs to be more concerned by
businesses than ever.
5
LUAN VAN CHAT LUONG download : add
Food processing is one of Vietnam’s key economic sectors, contributing a large part
to the country’s GDP and economic growth. According to the report of the VNCPA
(2018), the business performance of food enterprises listed on the Ho Chi Minh Stock
Exchange is not really effective. Specifically, the average ROE of 10 listed companies in
2018 is 10.33%, ROA is 5.76%. One of the main reasons for this situation is that the
capital structure of enterprises is unreasonable and does not use capital effectively. This
causes a lot of trouble for food businesses in particular and other joint stock businesses in
general, especially in the context of volatile business environment during the recent
years.
Therefore, it is significantly necessary to make the studies on the factors affecting
the capital structure and proposes the recommendations to enhance the efficiency of
capital structure in these food companies. This is the rationale for the author to choose the
research topic: Factors affecting the capital structure of food companies listed on Ho
Chi Minh stock exchange. The author also expects that the research can contribute a part
into the financial management of enterprises in the industry, to help enterprises have a
more general view on the policies of mobilizing capital as well as provide appropriate
solutions for enterprises, thereby contributing to raise efficiency of production and
business activities.
2. Research questions and objectives
The main objective of this study is to investigate the determinants of capital
structure (DER) as well as its impact food companies listed on Ho Chi Minh stock
exchange. And based on that, it also aims to propose suggestions and recommendation to
improve the capital structure in these firms and enhance their firm performance. In order
to fulfil the above objective, the study will answer the research questions as followings:
What are the factors affecting on the capital structure of food companies listed on
HOSE?
How these factors impact on the capital structure of the food firms listed on
HOSE?
6
LUAN VAN CHAT LUONG download : add
What are the recommendations suggested for the food companies listed on HOSE?
3. Research subject and scope
Research subject: the factors influencing on capital structure of food companies
listed on HOSE.
Research scope: In terms of space, the scope includes the food processing firms
which are currently listed on Ho Chi Minh Stock Exchange. Accordingly, there are total
16 firms selected in the research (HOSE, 2018). In terms of time, the researcher collected
data in the period of 10 recent years from 2008-2018.
4. Research methodology
In order to conduct the study, the author used statistical, comparative and regression
methods from the quarterly financial data of food processing firms in the period of 20082018. Accordingly, the method applied mainly is the regression analysis that runs the
econometric model to examine and investigate the correlation between the independent
variables and dependent variable. In specific, a multivariate regression model using fix
random effect was employed to test the factors and its impacts on the capital structure of
the above companies.
5. The structure of report
The structure of study is organized into three main section as followings:
Section 1: Overview of the topic
The first section aims to provide literature reviews related to the research topics,
including definitions, classifications, economic theories, scholars and research hypothesis
used in this study.
Section 2: Model specification
In this section, the author presents research methodologies to collect and analyze
data. Furthermore, theoretical model specification and descriptive statistic of data is also
provided in this part.
7
LUAN VAN CHAT LUONG download : add
Section 3: Findings and Results
The final part is to demonstrate the results of estimated model, tests for model’s
possible problems and correct them. And based on findings and results, some
recommendations are also proposed.
8
LUAN VAN CHAT LUONG download : add
SECTION 1: OVERVIEW OF THE TOPIC
1.1 Overview about the capital structure
1.1.1 Definition of capital structure
Capital is one of the most important factors that can help businesses survive and
develop. This source of capital is mobilized by enterprises in two main methods are loans
and equity. The capital structure of an enterprise is the ratio of total debt (including shortterm and long-term debt) to equity, in other words, capital structure relates to the
deciding sources to finance companies’ businesses. Ordinarily, at the start-up of a firm,
equity is used to run the business, since equity charges no fixed cost on the firm; on the
other hand, as the firm grows, debt becomes a preferred choice of a firm’s capital, and in
the remainder of their life cycle, debt is preferred (Ross, 2002). The use of debt can come
from the issuance of bonds or bills of exchange, while equity is divided into three types:
retained earnings, preferred shares and common stock. Each enterprise has its own
structure depending on the decision of the corporate executives and this has a significant
impact on the cost of the enterprise. In addition, the capital structure of an enterprise also
affects the return on equity (ROE) and the financial risks of the business.
1.1.2 The roles of capital structure
All business activities of the enterprise cannot operate normally if the enterprise
does not have the financial ability or the financial situation of the business has problems.
The capital structure of an enterprise is the ratio between the use of equity and equity in
an efficient way to improve the business results of an enterprise. In order to determine
this proportion appropriately, managers must consider and consider on a number of
factors in order to maximize the benefits for shareholders. The use of equity or debt is for
the purpose of financing the business of the business. However, each component has its
own advantages and disadvantages when used. Thus, analyzing the business activity of an
enterprise in order to provide an optimal capital structure in specific circumstances is an
urgent issue for financial managers.
9
LUAN VAN CHAT LUONG download : add
1.2 The capital structure theories
1.2.1 Modigliani and Miller (M&M) theory
Modigliani and Miller are the pioneers that conducted scientific study on capital
structure area in 1958 and developed MM theorem (Hossain and Ali, 2012). According to
Modigliani and Miller (1958) under prefect market where there are no taxes, transaction
cost, bankruptcy and agency cost; the firm’s decision and capital structure is independent
from firm’s market value and cost of capital. The scholars affirm that the firms should be
unconcerned choosing between debt and equity financing in perfect capital market
(Modigliani and Miller, 1958). There are three proposition states by Modigliani and
Miller in MM theory. The first proposition is the firm’s capital structure does not affect
the market value and average cost of capital (Abdul Jamal et al, 2013). The second
proposition is the firm’s leverage does not affect weighted cost of capital (Abdul Jamal et
al, 2013). The third proposition is the firm’s value does not affect by its dividend policy
(Abdul Jamal et al, 2013). In year 1963, Modigliani and Miller modify MM theory by
reflected on the cooperation tax and state that the firm can go for fully debt finance
because debt is tax deductible and debt can increase the firm value (Akbar and Ahmad
Bhutto, 2012). Modigliani and Miller (1963) emphasis that debt finance will increase
corporate value because interest of debt is tax deductable while equity cost not tax
deductable.
1.2.2 Agency cost theory
Jensen and Meckling are the pioneers developed agency cost theory and according
to them, an optimal capital structure can be determined by minimizing the agency cost
(Moosa, Li and Naughton, 2011). Jensen and Meckling (1976) define agency cost as sum
of principle’s monitoring expenditure, agents bonding expenditure and the residual loss.
Agency cost arises because of conflict of interest between shareholders and managers and
also due to separation management of firm and ownership (Abdul Jamal et al, 2013).
There two types of conflicts: conflict between shareholders and manager and conflict
between shareholders and bondholders (Jensen and Meckling, 1976). Since the managers
10
LUAN VAN CHAT LUONG download : add
and shareholders try to take action in their own interest, managers might behave make
financial decision that gives benefits to the managers but not maximize shareholders
wealth (Abdul Jamal et al, 2013). According to Qiu and La (2010), the managers might
act in a different way under different capital structure. The debt finance with interest
payments can reduce conflict between manager and shareholder (Buferna, 2005 cited in
Abdul Jamal et al, 2013). The managers will try to operate the firms as efficient as
possible to meet the interest payment and try to maximize shareholders wealth because
they worried about losing their job (Abdul Jamal et al, 2013). The second way to reduce
conflict of interest between shareholders and managers is by increasing the equity holds
by the managers (Niu, 2008). Conflict between bondholders and shareholders arise
because the shareholders decision to transfers the wealth from bondholders to
shareholders (Niu, 2008). Convertible debt finance can reduce conflict between
bondholders and shareholders because it has low agency costs compare to debt (Jensen
and Meckling, 1976). According to Jensen and Meckeling (1976) optimal combination of
equity and outsource debt will decrease the agency costs.
1.2.3 Trade-off theory
Trade off theory state that the firm’s optimal capital structure determined by tradeoff the benefit of debt finance with debt’s disadvantage (Hussain et al, 2015). Benefits of
debt include tax shield, the reduction free cash flow, conflict between managers and
shareholders and the disadvantages includes finance distress, cost associated
underinvestment and assets substitution problem (Cotei, Farhat, and Abugri, 2011).The
trade-off theory implies the firms to choose debt finance rather than equity until the point
at which the bankrupt probability equal to advantage of using debt (Hossain and Ali,
2012). Trade off theory suggest high risk organization should go for less debt compare to
low risk organization (Abdul Janal et al, 2013). The theory also states that firms that use
more tangible asset to operate should go for more debt finance because tangible asset can
use as collateral organization (Abdul Janal et al, 2013). Myers developed static trade-off
in 1984 and this theory state that higher profitability firms should have higher target debt
11
LUAN VAN CHAT LUONG download : add
ratio and the firms should able to gain more debt without risking financial distress.
Higher profitability firms required to have higher target debt ratio to ensure high tax
saving from debt, profitability of bankruptcy is low and higher over- investment (Abdul
Jamal et al, 2013). While, firms with high growth opportunity should use less debt
finance because more debt will cause loss value in financial distress (Niu, 2008).
Fisher et al developed trade-off theory dynamic version in 1989 and this theory
suggest that companies inactively accumulate profits and losses, allowing their debt ratio
move away from the target only if the cost of adjusting the debt ratio go over the cost of
having a sub optimal capital structure (Hovkimian and Tehranian, 2004). The dynamic
trade off theory implies that firms gained high profitability in past are probable under
levered while firms gained losses are probable over levered. This theory predicts that
negative relationship between profitability and observed debt ratios but gives positive
result on the profitability of debt versus equity and the negative relationship arise not
because of profitability affect target leverage but it’s have an effect on deviation from the
target (Hovakimian, Hovakimian and Tehranian, 2004). Therefore, the negative
relationship would not arise for firms that offset the deviations from the target by
resetting their capital structure (Hovakimian and Tehranian, 2004).
1.2.4 Pecking-order theories
Myers and Majluf (1984) are the pioneers that explain financial behavior by
included the private information known by the managers into capital structure model
(Kjellman and Hansen, 1995). Pecking order theory and this theory assumes that financial
resources preference ranking created by using information asymmetric between managers
and shareholders (Leary and Roberts, 2010). The ranking begins with internal funding or
retained earnings, followed by debt finance and then equity finance (Leary and Roberts,
2010). Pecking order theory claims that the firms not necessary to follow target amount
leverage and the firms should choose its leverage ratio based on its financing needs
(Hossain and Ali, 2012). If the investors and lender are not well-known compare to the
mangers about the firm’s asset values and future prospect, mispricing debt and equity
12
LUAN VAN CHAT LUONG download : add
might occur in the market (Kjellman and Hansen, 1995). If the firms are necessary issue
equity to fund new investment project, Kjellman and Hansen (1995) state that underpricing may be so severe that new investors might capture more than the net present
value of that project. Thus, existing shareholders will earn net loss (Kjellman and
Hansen, 1995). The under investment can be prevented if the firms follows pecking order
theory’s finance sources sequences (Kjellman and Hansen, 1995).
Pecking order theory suggests that firms should increase their ability to retain
profits over their life-cycle and reduce in depending on borrowing to fund investment
opportunities (Serrasqueiro and Nunes, 2012). Internal funding or retained have no
adverse choice, debt have minor adverse choice problem and equity have major diverse
choice problem (Frank and Goyal, 2003). This theory emphasis firms to use internal
funding because internal funding are less risky, less sensitive to mispricing and valuation
errors (Abdul Jamal et al, 2013). According to Niu (2008), internal funding or retained
earnings does not have flotation costs and no additional disclosure financial information
required such as information on firms’ investments opportunities and their potential
profit. If the firms going for external finance, the preference should follows this
sequences: debt, convertible securities, preferred stock and common stock (Niu, 2008).
Even though, both debt and equity have adverse selection risk premiere but equity have
larger adverse selection risk compare to debt (Frank and Goyal, 2003). Since equity is
more risky compare to debt, outside investors will demand for higher rate of return on
equity (Frank and Goyal, 2003). Myers (1984) state that firms prefers to fund real
investment by using less risky securities or bonds rather than equity.
1.3 Determinants of capital structures
1.3.1 Firm size
Many authors have suggested that the leverage ratio may be related to firm size.
However, there are conflicting results on the relationship between firm’s size and
leverage. The trade-off theory predicts that larger firms tend to be more diversified, less
risky and less prone to bankruptcy. Firms may prefer debt rather than equity financing for
13
LUAN VAN CHAT LUONG download : add
control. Control considerations support positive correlation between size and leverage.
Thus, large firms should be more highly leveraged. Some of the studies consisted with
the view of trade-off theory (Fischer et al., 1989; Chang and Rhee, 1990; Chen et al.,
1998; Banerjee et al., 2000; Bevan and Danbolt, 2001; Fattouh et al., 2002; Padron et al.,
2005; Gaud et al., 2005; Tomak, 2013). However, Titman and Wessels (1988), Ooi
(1999), Chen (2003), Yolanda and Soekarno (2012) and Wahap and Ramli (2014) report
a contrary negative relationship between debt ratios and firm size. Kale et al. (1991),
Wanzenried (2002) and Ghazouani (2013) find no significant effect of size on capital
structure. In the literature, the natural logarithm of net sales or total assets, average value
of total assets, total assets at book value and the market value of the firm were used as
measure firm size (Sayilgan et al., 2006).
1.3.2 Growth opportunities
Jensen and Meckling (1976), Myers and Majluf (1984), and Fama and French
(2000) argue that firms with high future growth opportunities should use more equity
financing, because a higher leveraged company is more likely to pass up profitable
investment opportunities. The trade-off model predicts that firms with more investment
opportunities have less leverage because they have stronger incentives to avoid
underinvestment and asset substitution that can arise from stockholder-bondholder
agency conflicts. The trade-off theory predicts a negative relationship between leverage
and investment opportunities. Pecking order theory suggests also that a firm's growth is
negatively related to its capital structure. Growth opportunities may be considered assets
that add value to a firm, but cannot be collateralized and are not subject to taxable
income. The agency problem suggests a negative relationship between capital structure
and a firm's growth. As a result, firms with high growth opportunities may not issue debt
in the first place, and leverage is expected to be negatively related to growth
opportunities (Rajan and Zingales, 1995; De Miguel and Pindado, 2001; Chen and Jiang,
2001; Bevan and Danbolt, 2001; Drobetz and Fix, 2003; Nguyen and Neelakantan, 2006).
Some empirical studies confirm the theoretical prediction, such as (Kim and Sorensen,
14
LUAN VAN CHAT LUONG download : add
1986; Titman and Wessels, 1988; Rajan and Zingales, 1995) report. However, some
studies demonstrate a positive relation between growth opportunities and leverage
(Titman and Wessels, 1988; Chang and Rhee, 1990; Banerjee et al., 2000; Fattouh et al.,
2002; Schargrodsky, 2002).
1.3.3 Profitability
From the point of view of the trade-off theory, more profitable companies should
have higher leverage because they have more income to shield from taxes. The free cashflow theory would suggest that more profitable companies should use more debt in order
to discipline managers, to induce them to pay out cash instead of spending money on
inefficient projects. However, from the point of view of the pecking-order theory, firms
prefer internal financing to external. So more profitable companies have a lower need for
external financing and therefore should have lower leverage. Most empirical studies
observe a negative relationship between leverage and profitability, for example (Rajan –
Zingales, 1995), (Huang – Song, 2002), (Booth et al., 2001), (Titman – Wessels, 1988),
(Friend – Lang, 1988) and (Kester, 1986). In this study, profitability is proxied by return
on assets (defined as earnings before interest and taxes divided by total assets).
1.3.4 Tangible fixed assets
Most capital structure theories argue that the type of assets owned by a firm in some
way affects its capital structure choice. Titman and Wessels (1988) predict that the assets
include the ratio of intangible assets to total assets and the ratio of inventory plus gross
plant and equipment to total assets. There is a positive relationship between tangibility
and leverage and a negative relationship between intangibility and leverage. The trade-off
theory predicts a positive relationship between leverage and tangible assets. Tangible
assets normally provide high collateral value relative to intangible assets, which implies
that these assets can support more debt. Tangible assets reduce the cost of financial
distress. Most empirical studies observe a positive relationship between leverage and
tangibility (Jensen and Meckling, 1976; Titman and Wessels, 1988; Jensen et al., 1992;
Rajan and Zingales, 1995; Chen and Jiang, 2001; Bevan and Danbolt, 2001). On the other
15
LUAN VAN CHAT LUONG download : add
hand, agency theory predicts a negative relationship between tangibility of assets and
leverage.
1.3.5 Tax rate
Taxes and the costs of financial distress were the first major frictions considered in
determining optimal capital ratios (Berger et al, 1995). They also contend that since
interest payments are tax-deductible, but dividends are not, substituting debt for equity
enables firms to pass greater returns to investors by reducing payments to the
government. The trade-off theory predicts a positive relationship between firm leverage
and effective tax rate. As such, high tax rates increase the interest tax benefits of debt.
The trade-off theory predicts that to take advantage of higher interest tax shields, firms
will issue more debt when tax rates are higher (Frank and Goyal, 2009).
Debt is
advantageous for tax reasons. The net tax advantage of debt is the difference between the
corporate tax advantage of debt and the personal tax disadvantage of debt (Dangl and
Zechner, 2004).
In contrast, from the pecking order theory vantage point, a negative relationship is
expected to subsist between firm-leverage and the effective tax rate. All things being
equal, a higher effective tax rate also reduces the internal funds of profitable firms and
subsequently increase its cost of capital (Rasiah and Kim, 2011).
As a result, an
expectation for the negative relationship between the effective tax rate and leverage ratio
is created within the framework of the pecking order model.
1.3.6 Industry characteristics
Capital structure varies greatly among industries. Kester (1986) found that the
higher the profitability sectors, the more likely it is to use less loans. Some other
empirical studies also identify a statistically significant relationship between industry
classification and leverage, such as (Bradley et al., 1984), (Long – Malitz, 1985), and
(Kester, 1986). It is shown that the leverage ratio in capital structure correlates negatively
with the frequency of bankruptcy in the industry. Enterprises that generate stable cash
16
LUAN VAN CHAT LUONG download : add
flows through the business cycle tend to have a higher financial leverage ratio. In general,
firms tend to focus closely on the sector’s debt ratio, which may reflect the fact that most
of the business risk a business faces is set by the industry. For example, as Harris and
Raviv (1991) claim, based on a survey of empirical studies: “Drugs, Instruments,
Electronics, and Food have consistently low leverage while Paper, Textile Mill Products,
Steel, Airlines, and Cement have consistently large leverage.” The industry
characteristics are often expressed as the ratio of cost of goods sold and net revenue (Tran
Hung Son, 2008).
SECTION 2: MODEL SPECIFICATION
2.1 Data collection
As mentioned in above, this study considers food processing companies listed on
Ho Chi Minh stock market, during the period 10 years 2008 - 2018. Although all of the
stock companies are considered, the author only chooses the companies with full
information in some certain years. In specific, there are 10 listed food companies on
HOSE. The total observations in a pool data collected are 106.
2.2 Data analysis
2.2.1 The dependent variables
The debt ratio is calculated by:
DER = (total debt) / (total capital)
This indicator shows how many copper coins are formed from the debt collection.
The higher the ratio, the more likely it is for a business to use more debt.
2.2.2 The independent variables
In studies of corporate capital structure in some countries with similar economic
and political characteristics as Vietnam: Hossain and Ali (2008); Mutalib (2011);
Quayyum (2013); Samuel G.H. Huang and Frank M. Song (2006) and PhD studies in
Vietnam such as Le Dat Chi (2013), Doan Phi Ngoc Anh (2010); Vu Thi Ngoc Lan
17
LUAN VAN CHAT LUONG download : add
(2014), Tran Hung Son (2008), the authors find the variables of profitability, firm size,
tangible fixed assets, tax rate and growth opportunities were used by researchers in
empirical models of factors affecting capital structure, so the authors used these five
variables in the regression model. In addition, since the food industry is characterized by
rapid growth rate and large working capital needs, so the author also chooses firm
characteristics in the research model that affect the food industry.
2.2.2.1 Profitability (ROA)
Based on the pecking-order theory, businesses with high profitability will prefer
internal financial sources rather than external ones. Specifically, the internal source of
retained earnings will be used first, followed by new bonds issued. Finally, new shares
will be issued as the last preferred source, if necessary. Profitability is net income before
tax divided by net premium. The perceived relationship between profitability and
leverage is inversely proportionate. This suggests that there exists a negative relationship
between profitability and capital structure. This view is supported by many empirical
studies conducted in different countries, including Hossain and Ali (2008); Mutalib
(2011); Quayyum (2013); Le Dat Chi (2013)
The variable for profitability is ROA:
ROA = (Profit before tax and interest (EBIT)) / (Total assets)
Accordingly, hypothesis H1 is given as follows:
H1: There is a negative relationship between capital structure and profitability
ratio.
2.2.2.2 Firm size (SIZE)
According to the tradeoff theory of capital structure, large-scale firms are generally
able to get more loans than small scale enterprises. Specifically, in order to obtain
external capital, small businesses bear higher costs than big ones due to asymmetric
information. Hence, big businesses have an advantage over small businesses when
accessing capital markets, which indicates that there exists a positive relationship
18
LUAN VAN CHAT LUONG download : add
between capital structure and company size. This view is supported by many empirical
studies conducted in different countries, including Huang and Song (2006), Doan Phi
Ngoc Anh (2010); Vu Thi Ngoc Lan (2014).
The variable for firm size is the SIZE:
SIZE = Net revenue
Accordingly, hypothesis H2 is given as follows:
H2: There is a positive relationship between capital structure and firm size
2.2.2.3 Tangible fixed assets (TANG)
Tangible fixed assets are considered as one of the important factors affecting the
structure of corporate capital because it acts as an assurance asset of the business to
creditors when borrowing. Since the debtors cannot calculate the risks in the project, they
should always need the property guaranteed by the business. Thus, firms with a high
proportion of tangible fixed assets are more likely to take out loans, especially when the
current bad debt situation plays a decisive role in the ability debt financing of the
business.
The study by Wiwattanakantang in 1999 demonstrated that tangible fixed assets
have a positive impact on debt ratios. The experiments of I. Chakraborty (2010) have not
yet come to a clear conclusion about the positive or negative impacts of tangible fixed
assets on the debt ratio. In Vietnam, there are some authors who have studied this
variable such as Hossain and Ali (2008); Quayyum (2013); Huang and Song (2006);
Shah & Khan (2007) and Vu Thi Ngoc Lan (2014)
TANG = (Fixed assets) / (Total assets)
Accordingly, hypothesis H3 is given as follows:
H3: There is a positive relationship between capital structure and tangible
fixed assets
19
LUAN VAN CHAT LUONG download : add
2.2.2.4 Growth opportunities (GROWTH)
Growth opportunities here are understood as the growth of total assets of the
business quarter after quarter. According to the tradeoff theory, growth opportunities will
lead the capital of the business to gradually shift to the use of debt because they need to
reduce the problem of representation. According to classification theory, enterprises will
prioritize the use of internal capital as retained earnings before using external capital. In
other words, the higher your growth potential, the less debt and equity you have. Previous
research has concluded that growth opportunities are inversely proportional to financial
leverage, such as Huang and Song (2006); Mutalib (2011). However, some studies show
a positive correlation between growth opportunities and leverage, such as Vu Thi Ngoc
Lan (2014). Business growth opportunities are measured by:
GROWTH = (Expenditure for Fixed Assets Investment) / (Total Assets)
Accordingly, hypothesis H4 is given as follows:
H4: There is a negative relationship between capital structure and growth rate
2.2.2.5 Corporate tax rate (TAX)
Firms with high rates of pay are more likely to use more leveraged capital to make
full use of the tax shield. However, excessive use of debt can sometimes lead to high
interest expenses and an increase in financial costs. Some previous studies have
mentioned the actual tax rates, such as Huang & Song (2006), Hossain & Ali (2008) and
Le Dat Chi (2013) in Viet Nam. Actual tax rates are measured by the ratio of the amount
of corporate income tax payable on pre-tax profit (EBT)
TAX = (Taxable) / EBT
Accordingly, hypothesis H5 is given as follows:
H5: There is a positive relationship between capital structure and corporate
tax rates
20
LUAN VAN CHAT LUONG download : add
2.2.2.6 Firm characteristics (UNI)
This indicator can be measured by the ratio of cost of goods sold to total net sales
or the ratio of R & D (cost of investment and product development) to total sales (Tran
Hung Son, 2008). Businesses with unique products often have lower financial leverage
than other normal businesses because if the business goes bankrupt, the secondary market
for inventory and manufacturing equipment. Therefore, this indicator has the opposite
effect on financial leverage. Due to limitations in R&D data, the writer uses only the cost
of goods sold on net sales to measure this indicator.
UNI = (Cost of goods sold) / (Total net revenue)
Accordingly, hypothesis H6 is given as follows:
H6: There is a negative relationship between capital structure and firm
characteristics
3.3 Building the research model
Based on the theory of capital structure mentioned in the previous chapter,
combined with some previous researches on capital structure, the writer uses the
multivariate regression model using the small-squared estimation method. Most OLS is to
test the factors that affect the capital structure of the business. The model for structuring
corporate capital has the following general form:
Y ❑=β 0 + β i X i +ui
With Y: Debt ratio, short-term debt ratio
X i : Factors affecting Capital Structure
β i: Parameter of the model
β 0: Constant (expressing the effect of factors other than X i )
ui : Random or error component of the model
21
LUAN VAN CHAT LUONG download : add
In this study, the data set includes 10 companies delisted on the HOSE in the
period from 2008 to 2018. For 10 companies, collected data consists of balance sheets
and income statements. However, some data were missing due to the fact that some
enterprises did not fully disclose their quarterly financial statements. Therefore, data
collection was only 106 observations.
3.4 Describe the data
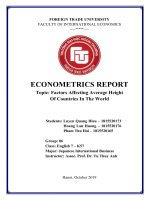
3.4.1 Descriptive statistics
The following table shows the characteristics of data range including mean,
standard deviation and the highest and lowest values of the independent variables and the
dependent variables.
As stated in Table 3.1, DER ranges from 0.07 to 0.73, with average value of 0.338
and a standard deviation of 0.14. It means that the total liabilities accounted for 33.8% of
total assets of the food companies listed on HOSE in the period of 2008- 2018.
GROW ranges from -3.62 to 9.14, with average value of 0.046 and a standard
deviation of 1.05. Hence, the value of standard deviation is much greater than average
value. These figures show that the growth rate of these enterprises has a relatively high
fluctuation range, reflecting the difference between enterprises clearly. The average
growth rate of food industry reached 0.046 during the period of 2008-2018, reflecting an
average increase of 4.6% per year.
ROA ranges from -0.04 to 0.27 with average value of 0.11 and a standard deviation
of 0.27. It can be seen that there are some firms which have negative profit and losses in
the period 2008-2018. The industry average ROA is 0.11, respectively to about 11%/year.
SIZE ranges from 11.32 to 12.66 with mean value equal to 11.95 and a low standard
deviation of 0.31. It demonstrates that food processiong companies listed on HOSE are
almost equivalent in firm size. In the 2008-2018 period, the average size of these
enterprises is 11.95.
22
LUAN VAN CHAT LUONG download : add
TAX ranges from 0.0165 to 0.5503 with an average value of 0.123 and a standard
deviation of 0.0776, which reflects that tax payable accounts for 12.3%.
TANG ranges from -0.04 to 0.31 with mean value equal to 0.013 and a standard
deviation of 0.0479. This result reflects that some foof enterprises experienced a decrease
in fixed assets between the following year and the previous year. The average value of
the proportion of fixed assets is 0.013, equivalent to the average growth rate of fixed
assets of the whole industry reached 1.3% per year.
UNI ranges from -0.8 to 0.44 with average value of -0.6 and an standard deviation
of 0.098. It shows that the cost of goods sold accounts for about 60% of net revenue of
food processing companies listed on HOSE.
23
LUAN VAN CHAT LUONG download : add
Table 3.1 Results of descriptive statistic
Mean
Median
Maximum
Minimum
Std. Dev.
Skewness
Kurtosis
JarqueBera
Probability
Sum
Sum Sq.
Dev.
Observatio
ns
GROW DER
ROA
SIZE
TANG TAX
UNI
0.0465 0.3388 0.1042 11.948 0.0133 0.1230
37
68
82
57
96
14 0.60049
6
0.0000 0.3050 0.1115 11.934 0.0000 0.1003
00
00
00
69
00
85 0.57522
1
9.1397 0.7300 0.2743 12.659 0.3100 0.5503
35
00
00
82
00
30 0.44134
2
- 0.0700
- 11.319
- 0.0165
3.62193
00 0.03770
69 0.04000
15 0.79802
9
0
0
3
1.0463 0.1408 0.0589 0.3068 0.0479 0.0776 0.0984
43
63
62
44
26
59
87
5.8937 0.7261
- 0.1533 4.0262 2.2813
68
58 0.13608
76
73
64 0.42544
3
7
56.528 2.8615 3.0085 2.8128 20.299 11.775 2.0622
79
54
07
69
24
65
53
13268.
89
0.0000
00
4.9329
27
9.4003
83
0.0090
94
35.920
00
0.3274
83
0.8489
62
11.053
90
0.5702
57
0.7519
18
1266.5
48
1608.1
41
0.0000
00
1.4200
00
432.08
47
0.0000
00
13.039
52
114.95
75
106
2.0834
64
106
0.3650
30
106
9.8861
21
106
0.2411
77
106
0.6332
39
106
7.0816
44
0.0289
89
63.6525
4
1.0184
74
106
24
LUAN VAN CHAT LUONG download : add
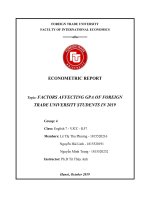
3.4.2 Correlation matrix
Table 3.2 Results of correlation matrix
GROW
GRO
W
1.0
00000
DER
0.0
74700
ROA
0.0
95576
SIZE
-
DER
ROA
0.0
74700
1.0
00000
-
0.0
95576
-
0.0
0.044743 24980
TAX
0.0
60844
UNI
0.0
12452
0.2
52648
-
TANG
-
-
1.0
0.3
44126
0.3
1.0
00000
-
0.1
0.095550 21952
-
0.0
0.240884 39572
0.3
0.219519 07668
TAX
UNI
0.0
0.005699 0.044743 60844
0.0
0.464035 0.101416 24980
0.005699 0.101416 44126
TANG
-
-
0.464035 00000
-
SIZE
0.4
60532
-
0.2
0.0
12452
-
52648
0.219519
-
0.3
0.095550 0.240884 07668
0.1
21952
1.0
00000
-
0.0
39572
60532
-
-
0.028044 0.080675
1.0
0.028044 00000
-
0.4
-
0.217416
1.0
0.080675 0.217416 00000
The value ranges from -1 to 1 and in case the result is closer to 1 or -1 lead to the
correlation is stronger (Taylor, 2005). Moreover, Kennedy (2008) points out that
multicollinearity occurs when correlations are higher than 0.8. As cited in Table 4.2, it is
shown that the correlation between the independent variables is lower than 0.8, indicating
25
LUAN VAN CHAT LUONG download : add