Lý thuyết thương mại quốc tế mới: Bằng chứng kiểm định từ trường hợp của Việt Nam ppt
Bạn đang xem bản rút gọn của tài liệu. Xem và tải ngay bản đầy đủ của tài liệu tại đây (390.22 KB, 18 trang )
J. Sci. & Devel., Vol. 11, No. 3:
411
-
428
T
ạ
p chí Khoa h
ọ
c và Phát tri
ể
n 201
3, t
ậ
p 1
1
, s
ố
3
:
411
-
428
www.hua.edu.vn
411
NEW TRADE THEORY: NEW EVIDENCE FROM VIETNAM
Hoàng Chí Cương
1,2,*
, Đỗ Thị Bích Ngọc
2
, Bùi Thị Thanh Nhàn
2
1
GSAPS, Waseda University, Tokyo, Japan, Doctoral Candidate
2
Faculty of Business Administration, Hai Phong Private University
*
: ;
Received date: 15.04.2013 Accepted date: 18.06.2013
ABSTRACT
This paper employs Gravity model, first used by Tinbergen (1962), and a panel data of country pairs between
Vietnam and her 18 major/stable trading partners in the period from 1995 to 2011. This purpose was to assess the
impact of the “index of similarity in GDP size” (SIMSIZE in short) on imports and exports of Vietnam. The empirical
results show that the index of similarity in GDP size promotes strongly Vietnam’s exports. By contrast, there is no
evidence that demonstrates convincingly that this index induces the country’s imports. These investigations can
somewhat contribute to the existing literature on the “New Trade Theory”, which was initiated in the late 1970s and in
the early 1980s, in terms of testable implications from gravity models that are emphasized in the case study between
some developing countries.
Keywords: Exports, imports, SIMSIZE, Gravity model, Hausman-Taylor estimator, New Trade Theory, Vietnam.
Lý thuyết thương mại quốc tế mới:
Bằng chứng kiểm định từ trường hợp của Việt Nam
TÓM TẮT
Bài báo này áp dụng mô hình Lực hấp dẫn, lần đầu tiên được sử dụng bởi Tinbergen (1962), và dữ liệu hỗn
hợp (panel data) giữa Việt Nam và 18 đối tác thương mại quan trọng/ổn định trong giai đoạn từ 1995 đến 2011. Mục
đích để đánh giá tác động của “chỉ số tương đồng về quy mô GDP” tới xuất và nhập khẩu của Việt Nam. Kết quả
thực nghiệm cho thấy chỉ số tương đồng về quy mô GDP tác động làm tăng xuất khẩu của Việt Nam (Việt Nam có xu
hướng xuất khẩu nhiều hơn sang các nước có sự tương đồng về quy mô GDP). Ngược lại, không có bằng chứng
thuyết phục rằng chỉ số này có tác động làm tăng nhập khẩu của Việt Nam (Việt Nam không nhập khẩu nhiều từ các
đối tác thương mại có quy mô GDP tương đồng). Kết quả nghiên cứu đã góp phần củng cố thêm cho sự tồn tại của
Lý thuyết Thương mại Quốc tế mới (New Trade Theory), được khởi nguồn từ cuối những năm 1970 đầu những năm
1980, ở khía cạnh áp dụng mô hình kinh tế Lực hấp dẫn để kiểm chứng Lý thuyết Thương mại Quốc tế mới trong
quan hệ thương mại giữa một số nước đang phát triển.
Từ khóa: Mô hình Lực hấp dẫn, nhập khẩu, Lý thuyết Thương mại Quốc tế mới, phương pháp ước lượng
Hausman-Taylor, SIMSIZE (chỉ số tương đồng về quy mô GDP), Việt Nam, xuất khẩu.
1. INTRODUCTION
International trade can be defined as the
exchange of capital, goods, and services across
international borders or territories. In
international trade, inter-industry trade is
usually driven by differences in factor
endowments (hence price) as stated in neoclassic
theories such as the theory of Comparative
Advantage of David Ricardo and the Hechsker -
Ohlin (H-O) theory of Eli Heckscher and Bertil
Ohlin. One of the founding principles of these
free trade models is the perfect competition
principle, which suggests that multiple
producers of goods competing with each other
ultimately reduce prices for consumers and that
this situation is the most beneficial for the
society at large. This advantage might come due
to natural factors within a country such as
climate or natural resources, or those countries
New trade theory: New evidence from Vietnam
412
might enjoy a labor advantage when producing a
particular product. However, these
theories/models fail to explain for the occurrence
of intra-industry trade (IIT) - the two-way
exchange of goods within standard industrial
classifications. These include the facts that most
trade is between countries with similar factor
endowments and productivity levels and the
large amount in overall trade in the globe is
intra-industry trade of similar products. This
has resulted in the formation of the “New Trade
Theory” that tries to deal with those issues.
In the early 1980s, a new set of models
gained prominence in international trade.
Krugman (1979, 1980), Lancaster (1980),
Helpman (1981), etc. studied a far-reaching
implication of monopolistic competition for
international trade theory.
1
To a large extent,
this line of research as part of the New Trade
Theory was motivated by two stylized facts that
the traditional theories of international trade of
Ricardo or Heckscher-Ohlin failed to explain.
First, why does most world trade flows between
developed countries that are similar in terms of
endowments and technology levels? Second, why
a major fraction of trade consists of intra-
industry trade in similar products? Helpman and
Krugman (1985) showed that a monopolistic
competition model could explain both facts as
long as firms produce differentiated products
with increasing returns to scale
2
technology, and
1
Monopolistic competition is a type of imperfect competition
that many producers sell products that are differentiated
from one another as goods but not perfect substitutes (such
as from branding, quality, or location). In monopolistic
competition, a firm takes the prices charged by its rivals as
given and ignores the impact of its own prices on the prices
of other firms.
2
In economics, returns to scale and economies of scale are
related terms that describe what happens as the
cale of production increases in the long run, when all input
levels including physical capital usage are variable (chosen
by firm). They are different terms and should not be used
interchangeably. The returns to scale arise in the context of a
firm’s production function. It refers to changes in output
resulting from a proportional change in all inputs (where all
inputs increase by a constant factor). If output increases by
that same proportional change then there are constant returns
to scale. If output increases by less than that proportional
change, there are decreasing returns to scale. If output
increases by more than that proportional change, there are
as long as consumers have utility functions that
reward diversity. There has been also an
extensive empirical literature on trade in
different products that in many instances
preceded the New Trade Theory. The early work
by Verdoorn (1960), Balassa (1966) and Grubel
and Lloyd (1975) documented the growing two-
way intra-industry trade between developed
countries.
3
These empirical works, however,
mostly lacked an explicit link to theoretical
models. Against this background, Helpman
(1987) has been an important contribution since
the author has explicitly derived testable
implications from a monopolistic competition
model in order to explain the increasing trade to
GDP ratios among developed nations.
Particularly, Helpman predicts that countries
exchange a larger fraction of output as they
become more similar in terms of size and as their
total size as a group increases, i.e. as they
produce more varieties. Helpman’s prediction
plays an important role in the empirical
literature that tests some implications of
monopolistic competition models for aggregate
trade patterns with country-level data. The
econometric work of Hummels and Levinsohn’s
(1995) confirms Helpman’s findings.
4
Mauro (2000) also employed the size
similarity variable to assess the impact of this
factor on FDI flows and exports of selected
countries (e.g., France, Germany, Italy, the UK,
Japan, the USA, the Republic of Korea, Canada
etc). The empirical results indicate the positive
impact of this factor on both FDI flows and exports.
This suggests that the countries similar in size
tend to trade and invest more to each other.
Debaere (2005) stated that the increasing
similarity in GDPs among OECD country pairs
increasing returns to scale. Notably, the returns to scale
faced by a firm are purely technologically imposed and is
not influenced by economic decisions or by market
conditions.
3
Debaere, P. (2005). Monopolistic competition and trade,
revisited: testing the model without testing for gravity.
Journal of International Economics 66, pp. 249-250.
4
Debaere, P. (2005). Monopolistic competition and trade,
revisited: testing the model without testing for gravity.
Journal of International Economics 66, p. 250.
Hoàng Chí Cương, Đỗ Thị Bích Ngọc, Bùi Thị Thanh Nhàn
413
leads to higher bilateral trade to GDP ratios. The
investigations of Mauro (2000) and Debaere
(2005), again, provide some support for the
prediction of Helpman (1987), whose model
explains intra-industry trade that is prevalent
among developed countries.
In contrast with the vast empirical studies of
foreign researchers that have examined the
impact of similarity in GDP size on trade or FDI
flows between developed countries as mentioned
above, the author hardly finds empirical studies
examining the case between developing
countries. This raises the research question that:
Does the increasing similarity in GDPs among
developing countries lead to higher bilateral
trade between them? This inspires us to examine
the case study of Vietnam. Vietnam offers an
interesting case study for several reasons. First,
there might not be empirical study that has ever
examined the impact of the similarity in GDP
size on foreign trade of Vietnam using economic
models before.
5
Second, Vietnam has
maintained the high growth rate of foreign trade
since the launch of Renovation Policy in the late
1980s. Third, an understanding of the impact of
the country similarity in size on Vietnam’s
foreign trade will be an important implication for
the design of supporting trade policies. The
hypothesis is that Vietnam will trade more with
countries, which have the same GDP size with
her, especially in export side. If this prediction
holds true, this empirical study will provide
some support for the “New Trade Theory”. The
remainder of this paper is organized as follows.
The section 2 first analyzes briefly Vietnam’s
foreign trade from 1995 to 2011. Then, section 3
details gravity models and decrypts the data set
(methodology and data). After that, section 4
presents the empirical results and discussions.
The final section refers to some concluding
remarks.
5
For the case of Vietnam, after searching on many academic
research sources such as Science Direct, Pro-Quest, EBSCO,
Wiley Inter-science, IMF, WB, Google Scholars, no
empirical study relating this topic has been found.
2. AN OVERVIEW ABOUT VIETNAM’S
FOREIGN TRADE IN THE PERIOD FROM
1995 TO 2011
2.1. An overview of Vietnam’s export
markets
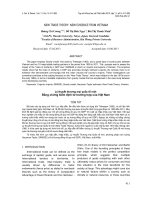
Table 1 illustrates Vietnam’s exports by
destinations during 1995 - 2011 in values.
Generally, Vietnam’s exports have concentrated
on the Asia - Pacific region and EU. In 2000,
Japan was the largest market with the export
value of $ 2,575.2 million taking 17.78% of
Vietnam’s total exports. This was followed by the
EU 5, ASEAN 4, China, Australia, Taiwan, the
USA and the Republic of Korea. In 2006, we
witness the appearance of the USA as the largest
export market of Vietnam. The export value to
the U.S. market increased from $ 732.8 million
in 2000 to $ 7,845.1 million in 2006, more than
tenfold over 6 years. Large as it is, the
magnitude of the export response is no surprise
given the big size of the U.S. market in the world
market. Also this year, the EU, ASEAN, Japan,
Australia, China, Taiwan and the Republic of
Korea were the major export markets of
Vietnam. In 2011, the USA still dominated the
biggest market share of Vietnam’s exports taking
17.47% totally. The proportions of the EU 5 and
ASEAN 4 declined from 12.47% and 11.99% in
2006 to 11.11% and 8.71% in 2011, respectively.
The ratio of Vietnam’s exports to Japan also
reduced from 13.15% to 11.12% in the same
period. Vietnam’s exports to Australia tended to
decline gradually from 9.4% in 2006 to 2.6% in
2011 (calculated from figures in the Table 1).
There were narrow changes in the cases of
China, the Republic of Korea and Taiwan. Top
18 major export markets covered around 80%
and the others shared about 20% of Vietnam’s
total exports in this duration.
2.2. An overview of Vietnam’s import
markets
414
Table 1. Value (current $ Million) of Vietnam’s exports by destination during 1995 - 2011
Year 1995 1996 1997 1998 1999 2000 2001 2002 2003 2004 2005 2006 2007 2008 2009 2010 2011
Australia 55.4 64.8 230.4 471.5 814.6 1272.5 1041.8 1328.3 1420.9 1884.7 2722.8 3744.7 3802.2 4351.6 2386.1 2704 2519.1
Belgium 34.7 61.3 124.9 212.3 306.7 311.9 341.2 337.1 391.4 515.7 544.1 687.5 849 1019.2 831.7 848.8 1199.7
Canada 17.8 32.6 63.9 80.2 91.1 98.7 107.3 138.1 171.3 270.1 356 440.5 539.2 656.4 638.5 802.1 969.4
China 361.9 340.2 474.1 440.1 746.4 1536.4 1417.4 1518.3 1883.1 2899.1 3228.1 3242.8 3646.1 4850.1 5403 7308.8 11125.0
France 169.1 145 238.1 297.3 354.9 380.1 467.5 437.9 496.1 555.1 652.9 797.2 884.4 970.8 809.6 1095.1 1658.9
Germany 218 228 411.4 552.5 654.3 730.3 721.8 729 854.7 1064.7 1085.5 1445.3 1854.9 2073.4 1885.4 2372.7 3366.9
Hong Kong 256.7 311.2 430.7 318.1 235.7 315.9 317.2 340.2 368.7 380.1 353.1 453 582.5 877.2 1034.1 1464.2 2205.7
Japan 1461 1546.4 1675.4 1514.5 1786.2 2575.2 2509.8 2437 2908.6 3542.1 4340.3 5240.1 6090 8467.8 6335.6 7727.7 10781.1
Malaysia 110.6 77.7 141.6 115.2 256.5 413.9 337.2 347.8 453.8 624.3 1028.3 1254 1555 2030.4 1775.2 2093.1 2832.4
The Netherlands 79.7 147.4 266.8 304.1 342.9 391 364.5 404.3 493 581.9 659.2 857.4 1182.1 1577.4 1355.6 1688.3 2148.0
The Philippines 41.5 132 240.6 401.1 393.2 478.4 368.4 315.2 340 498.6 829 782.8 965.1 1824.7 1461.9 1706.4 1535.3
The Russian Federation 80.8 84.7 124.6 126.2 114.9 122.9 194.5 187.4 159.6 215.8 251.9 413.2 458.5 672 414.9 829.7 1287.3
Singapore 689.8 1290 1215.9 740.9 876.4 885.9 1043.7 961.1 1024.7 1485.3 1917 1811.7 2234.4 2713.8 2075.6 2121.3 2285.7
The Republic of Korea 235.3 558.3 417 229.1 319.9 352.6 406.1 468.7 492.1 608.1 663.6 842.9 1243.4 1793.5 2077.8 3092.2 4715.4
Taiwan 439.4 539.9 814.5 670.2 682.4 756.6 806 817.7 749.2 890.6 935 968.7 1139.4 1401.4 1120.6 1442.8 1843.3
Thailand 101.3 107.4 235.3 295.4 312.7 372.3 322.8 227.3 335.4 518.1 863 930.2 1030 1288.5 1314.2 1182.8 1792.2
The UK 74.6 125.1 265.2 335.8 421.2 479.4 511.6 571.6 754.8 1010.3 1015.8 1179.7 1431.3 1581 1329.2 1681.9 2398.2
The USA 169.7 204.2 286.7 468.6 504 732.8 1065.3 2452.8 3938.6 5024.8 5924 7845.1 10104.5 11886.8 11407.2 14238.1 16927.8
ASEAN 4 943.2 1607.1 1833.4 1552.6 1838.8 2150.5 2072.1 1851.4 2153.9 3126.3 4637.3 4778.7 5784.5 7857.4 6626.9 7103.6 8445.6
EU 5 576.1 706.8 1306.4 1702 2080 2292.7 2406.6 2479.9 2990 3727.7 3957.5 4967.1 6201.7 7221.8 6211.5 7686.8 10771.7
Top 18 4597.3 5996.2 7657.1 7573.1 9214 12206.8 12344.1 14019.8 17236 22569.4 27369.6 32936.8 39592 50036 43656.2 54400 71591.4
Others 851.6 1259.7 1527.9 1787.2 2327.4 2275.9 2685.1 2686.3 2913.3 3915.6 5077.5 6889.4 8969.4 12649.1 13440.1 17791.9 25314.3
Total 5448.9 7255.9 9185 9360.3 11541.4 14482.7 15029.2 16706.1 20149.3 26485 32447.1 39826.2 48561.4 62685.1 57096.3 72191.9 96905.7
Notes: ASEAN 4 includes Malaysia, the Philippines, Singapore and Thailand covering around 70% of Vietnam’s total exports to ASEAN 9 during 1995-2011
EU 5 includes Belgium, France, Germany, the Netherlands and the United Kingdom (UK) covering about 70% of Vietnam’s total exports to all EU members
during 1995-2011
Source: Personally calculated from figures published by the Vietnam’s General Statistics Office (GSO), 2012.
New trade theory: New evidence from Vietnam
414
Hoàng Chí Cương, Đỗ Thị Bích Ngọc, Bùi Thị Thanh Nhàn
415
Table 2. Value (current $ Million) of Vietnam’s imports by sources during 1995 - 2011
Year 1995 1996 1997 1998 1999 2000 2001 2002 2003 2004 2005 2006 2007 2008 2009 2010 2011
Australia 100.6 132.8 192.6 253.9 215.7 293.5 266.4 286.3 278 458.8 498.5 1099.7 1059.4 1357.9 1045.9 1443.6 2123.3
Belgium 21.7 59.9 80 69.5 85.2 92 72.2 94.7 167.8 137.6 171.2 225.4 312.2 348.3 300.9 320.2 346.9
Canada 24.9 35.1 36.9 41.3 49.5 37.6 56.8 63.7 76.6 96.8 173.6 178.6 287.2 297.8 235.8 349.3 342.1
China 329.7 329 404.4 515 673.1 1401.1 1606.2 2158.8 3138.6 4595.1 5899.7 7391.3 12710 15973.6 15411.3 20018.8 24593.7
France 276.6 416.8 550.8 379.8 309.3 334.2 300.4 299.2 411 617.4 447.7 421.1 1155.4 816.5 753.9 969 1205.0
Germany 175.5 288.2 280.8 359.9 268.7 295.2 396.7 558.1 614.6 694.3 661.9 914.5 1308.5 1479.9 1421.5 1742.4 2198.6
Hong Kong 419 795.4 598.9 557.3 504.7 598.1 537.6 804.8 990.9 1074.3 1235 1440.8 1950.7 2633.3 2120.9 860.4 969.7
Japan 915.7 1260.3 1509.3 1481.7 1618.3 2300.9 2183.1 2504.7 2982.1 3552.6 4074.1 4702.1 6188.9 8240.3 6836.4 9016.1 10400.3
Malaysia 190.5 200.3 226.8 249 305 388.9 464.4 683.3 925 1215.3 1256.5 1482 2289.9 2596.1 2561.3 3413.4 3919.7
The Netherlands 36.3 51.4 51.5 54 48.5 84.6 114.6 114.3 324.9 179.4 312.1 360.8 510.3 710.5 701.4 527.8 669.4
The Philippines 24.7 28.9 36.3 67.7 47.5 62.9 53.5 100.6 140.9 188.4 209.9 342.6 414.2 389.1 450.7 700.3 805.1
The Russian Federation 144.8 186.5 158 216.3 245.6 240.5 376.4 500.6 491.8 671.5 766.6 455.8 552.2 969.6 1288.1 999.1 694.0
Singapore 1425.2 2032.6 2128 1964 1878.5 2694.3 2478.3 2533.5 2875.8 3618.4 4482.3 6273.9 7613.7 9378 7015.2 4101.1 6390.6
The Republic of Korea 1253.6 1781.4 1564.5 1420.9 1485.8 1753.6 1886.8 2279.6 2625.4 3359.4 3594.1 3908.4 5340.4 7255.2 6707.6 9761.3 13175.9
Taiwan 901.3 1263.2 1484.7 1377.6 1566.4 1879.9 2008.7 2525.3 2915.5 3698.3 4304.2 4824.9 6946.7 8362.6 6112.9 6976.9 8556.8
Thailand 439.8 494.5 575.2 673.5 561.8 810.9 792.3 955.2 1282.2 1858.6 2374.1 3034.4 3744.2 4905.6 4471.1 5602.3 6383.6
The UK 50.7 83.7 103.9 96.4 109.2 149.9 171.6 166.5 219.8 227.7 182.4 202.1 237 386.3 342.5 511.1 646.1
The USA 130.4 245.8 251.5 324.9 322.7 363.4 410.8 458.3 1143.3 1133.9 862.9 987 1700.5 2646.6 2710.5 3766.9 4529.2
ASEAN 4 2080.2 2756.3 2966.3 2954.2 2792.8 3957 3788.5 4272.6 5223.9 6880.7 8322.8 11132.9 14062 17268.8 14498.3 13817.1 17499
EU 5 560.8 900 1067 959.6 820.9 955.9 1055.5 1232.8 1738.1 1856.4 1775.3 2123.9 3523.4 3741.5 3520.2 4070.5 5066
Top 18 6861 9685.8 10234.1 10102.7 10295.5 13781.5 14176.8 17087.5 21604.2 27377.8 31506.8 38245.4 54321.4 68747.2 60487.9 71080 87950
Others 1294.4 1457.8 1358.2 1396.9 1446.6 1855 2041.2 2658.1 3651.6 4591 5254.3 6645.7 8443.3 11966.6 9460.9 13721.2 18799.9
Total 8155.4 11143.6 11592.3 11499.6 11742.1 15636.5 16218 19745.6 25255.8 31968.8 36761.1 44891.1 62764.7 80713.8 69948.8 84801.2 106749.9
Notes: ASEAN 4 includes Malaysia, the Philippines, Singapore and Thailand covering around 90% of Vietnam’s total imports from ASEAN 9 during 1995-2011; EU 5 includes
Belgium, France, Germany, the Netherlands and the United Kingdom (UK) covering about 70% of Vietnam’s total imports from all EU members during 1995-2011
Source: Personally calculated from figures published by the Vietnam’s General Statistics Office (GSO), 2012.
Hoàng Chí Cương, Đỗ Thị Bích Ngọc, Bùi Thị Thanh Nhàn
415
New trade theory: New evidence from Vietnam
416
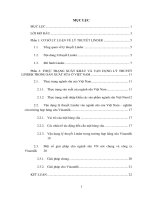
Table 2 presents Vietnam’s imports by
sources during 1995 - 2011 in values. On import
side, a similar trend can be easily observed for
the changes in the relative importance in order of
some main import sources of Vietnam. Vietnam’s
imports have mainly concentrated on the Asia -
Pacific region and the EU due to its integration
focusing on these regions. In contrast to export
side, the USA was not the biggest import source
of Vietnam, while China, ASEAN 4, the Republic
of Korea, Japan and Taiwan were the major
important import sources. Specifically, the
proportion of Vietnam’s import from the USA
was only 2.32% in 2000, 2.2% in 2006 and 4.24%
in 2011. Vietnam’s imports from China have
increased steadily in both absolute value and
ratio recently. The import value increased from $
1,401.1 million in 2000 to $ 7,391.3 million in
2006 and $ 24,593.7 million in 2011. The share in
its total imports rose from 8.96% in 2000 to
16.46% in 2006 and 23.04% in 2011. Although,
the proportion of Vietnam’s imports from ASEAN
4 has decreased from 24.79% in 2006 to 16.39%
in 2011, ASEAN 4 was still the second largest
import source of Vietnam just after China. This
means, there was a “trade diversion” from
ASEAN 4 to China in importation. Vietnam’s
import value from the Republic of Korea has
increased from $ 3,908.4 million in 2006 to $
13,175.9 million in 2011 covering 12.34% of its
total imports. At the same period, the ratios of
Vietnam’s imports from Japan and the EU 5
remained stableof around 9.74% and 4.74% in
order. Top 18 Vietnam’s major import sources
covered over 85% and the others shared around
15% of its total imports (calculated from figures
in Table 2).
2.3. An overview about Vietnam’s trade
balance with its major trading partners
The Table 3 indicates the pattern of
Vietnam’s trade balance with its major trading
partners from 1995 to 2011. It is obvious that
trade deficit with China has grown up rapidly
from $ 188.8 million in 2001 to $ 13,468.7
million in 2011 amounting over 100% of
Vietnam’s total trade deficit in the same year ($
9,844.2 million).
6
Vietnam continued to run
substantial trade deficits with ASEAN 4, the
Republic of Korea and Taiwan. Trade deficit
with ASEAN 4 seems to be decreased but still
stopped at high volume of about $ 9,053.4
million in 2011. In contrast, Vietnam had
steady trade surplus with the USA, the EU 5
and Australia. In 2011, trade surplus with the
USA and the EU 5 reached at $ 12,398.6 million
and $ 5,705.7 million respectively. The trade
surplus with Australia was $ 395.8
million in the same year. There has been a
fluctuation in trade balance with Japan.
Overall, despite having the trade surplus
with the USA, the EU 5, and Australia, Vietnam
still had trade deficit in total trade balance.
Vietnam’s balance of trade deficit had experienced
an upward trend together with the increase of
trade size. Trade deficit has increased from $
1,153.8 million in 2000 to $ 5,064.9 million in
2006 and stopped at $ 9,844.2 million in 2011,
8.53 times higher than that in 2000 and 1.94
times better in comparison with 2006.
Vietnam’s trade deficit with its major
trading partners recently could be explained as
follows. Firstly, Vietnam’s domestic producers
have not met the demands in both
manufacturing and final consuming yet.
Secondly, the capacity of competition of
domestic products is quiet limited. Those
created the huge imports to satisfy domestic
demands. Thirdly, it has resulted from the slow
change of Vietnam export - import structure.
Vietnam’s economy still focuses on processing
and assembling using cheap labor force but
medium and low technology. Domestic
manufacturing depends much upon the world’s
input material markets. 80 - 90% of input
materials were imported from abroad covering
two thirds of factory price. The increase of
6
To investigate why Vietnam imported much more from
China leading to the trade deficit of the country, please read
more on Hoang, C.C. (2013). “An analysis of trade balance
between Vietnam and China”, available on:
/>16644/Phan-tich-can-can-thuong-mai-Viet
Trung/Default.aspx, accessed on 23
rd
May 2013.
Hoàng Chí Cương, Đỗ Thị Bích Ngọc, Bùi Thị Thanh Nhàn
417
Table 3. Vietnam’s foreign trade balance (current $ Million) with its major trading partners during 1995-2011
Trade Balance 1995 1996 1997 1998 1999 2000 2001 2002 2003 2004 2005 2006 2007 2008 2009 2010 2011
Australia -45.2 -68 37.8 217.6 598.9 979 775.4 1042 1142.9 1425.9 2224.3 2645 2742.8 2993.7 1340.2 1260.4 395.8
Canada -7.1 -2.5 27 38.9 41.6 61.1 50.5 74.4 94.7 173.3 182.4 261.9 252 358.6 402.7 452.8 627.3
China 32.2 11.2 69.7 -74.9 73.3 135.3 -188.8 -640.5 -1255.5 -1696 -2671.6 -4148.5 -9063.9 -11123.5 -10008.3 -12710 -13468.7
Hong Kong -162.3 -484.2 -168.2 -239.2 -269 -282.2 -220.4 -464.6 -622.2 -694.2 -881.9 -987.8 -1368.2 -1756.1 -1086.8 603.8 1236
Japan 545.3 286.1 166.1 32.8 167.9 274.3 326.7 -67.7 -73.5 -10.5 266.2 538 -98.9 227.5 -500.8 -1288.4 380.8
The Russian Federation -64 -101.8 -33.4 -90.1 -130.7 -117.6 -181.9 -313.2 -332.2 -455.7 -514.7 -42.6 -93.7 -297.6 -873.2 -169.4 593.3
The Republic of Korea -1018.3 -1223.1 -1147.5 -1191.8 -1165.9 -1401 -1480.7 -1810.9 -2133.3 -2751.3 -2930.5 -3065.5 -4097 -5461.7 -4629.8 -6669.1 -8460.5
Taiwan -461.9 -723.3 -670.2 -707.4 -884 -1123.3 -1202.7 -1707.6 -2166.3 -2807.7 -3369.2 -3856.2 -5807.3 -6961.2 -4992.3 -5534.1 -6713.5
The USA 39.3 -41.6 35.2 143.7 181.3 369.4 654.5 1994.5 2795.3 3890.9 5061.1 6858.1 8404 9240.2 8696.7 10471.2 12398.6
ASEAN 4 -1137 -1149.2 -1132.9 -1401.6 -954 -1806.5 -1716.4 -2421.2 -3070 -3754.4 -3685.5 -6354.2 -8277.5 -9411.4 -7871.4 -6713.5 -9053.4
EU 5 15.3 -193.2 239.4 742.4 1259.1 1336.8 1351.1 1247.1 1251.9 1871.3 2182.2 2843.2 2678.3 3480.3 2691.3 3616.3 5705.7
Top 18 -2263.7 -3689.6 -2577 -2529.6 -1081.5 -1574.7 -1832.7 -3067.7 -4368.2 -4808.4 -4137.2 -5308.6 -14729.4 -18711.2 -16831.7 -16680 -16358.6
Others -442.8 -198.1 169.7 390.3 880.8 420.9 643.9 28.2 -738.3 -675.4 -176.8 243.7 526.1 682.5 3979.2 4070.7 6514.4
Total -2706.5 -3887.7 -2407.3 -2139.3 -200.7 -1153.8 -1188.8 -3039.5 -5106.5 -5483.8 -4314 -5064.9 -14203.3 -18028.7 -12852.5 -12609.3 -9844.2
Notes: ASEAN 4 includes Malaysia, the Philippines, Singapore and Thailand
EU 5 includes Belgium, France, Germany, the Netherlands and the United Kingdom (UK)
Source: Personally calculated from figures published by the Vietnam General Statistics Office (GSO), 2012.
Hoàng Chí Cương, Đỗ Thị Bích Ngọc, Bùi Thị Thanh Nhàn
417
New trade theory: New evidence from Vietnam
418
exports has been accompanied by the rise of
imports from foreign markets. Vietnam’s
exports concentrated on raw material (e.g.,
crude oil, coal, and iron ore etc), agriculture,
forestry and aquatic products (e.g., rice, coffee,
cashew nut, pepper, catfish, etc.) and on some
light industry products (e.g., garment, textile,
footwear, etc.) with low added value while it
imported mostly input/manufacturing materials
(e.g., machines, equipments, instruments, parts
and components, fuels, raw materials, etc.) and
luxury consuming goods (automobiles, mobile
phones, luxury cosmetics, computers, etc.),
which covered over 70% of total imports. How to
test the impact of the index of similarity in GDP
size on exports and imports of Vietnam? The
next section will present the methodology and
data used to conduct this research.
3. THE SPECIFICATION OF GRAVITY
MODELS AND DECRYPTING THE DATA SET
3.1. The specification of Gravity equations
The Gravity model in international trade
presents a more empirical analysis of trading
patterns. The gravity model, in its basic form,
predicts trade based on the distance between
countries and the interaction of the countries’
economic sizes. The model mimics the
Newtonian Law of gravity which also considers
distance and physical size between two objects.
The model has been proven to be empirically
strong through econometric analysis and takes
the following formula:
F
ij
= G(M
i
M
j
)/D
ij
(1)
wherein:
. F
ij
is the bilateral trade flow between
countr i and country j
. M
i
is the economic mass of country i
(often
using GDP, GNP measurements)
. M
j
is the economic mass of country j (often
using GDP, GNP measurements)
. D
ij
is the distance between countries (i and
j), and
. G is a constant.
For further development, many other
variables can be added in the model, such as
transport and transaction costs; FDI inflows
(FDI stock per capita); trade policies, exchange
rate regime; cultural differences: colonial
history, language diversity and literacy rate
(%); institution, uncertainty; preference
schemes: Generalized System of Preferences
(GSP); limited overlap in consumer preference
schemes; market access; openness; index of
country similarity in size, economic size
similarity, differences in relative endowments
etc. The Gravity model has been used
comprehensively in many empirical studies in
international economics (e.g., Poyhonen (1963);
Linnemann (1966); Anderson (1979);
Bergstrand (1985); Bayoumi and Eichengreen
(1995); Deardorff (1998); Mauro (2000); Aderson
and van Wincoop (2003); Rose (2004a);
Subramanian and Wei (2007); Tomz et al.
(2007); Shujiro and Misa (2007); Helpman et al.
(2008); Eicher and Henn (2011); Pham (2011),
Medvedev (2012) etc).
Notably, in a panel data setting, random-
effects and fixed-effects models have been
traditionally and widely used for the estimation
of Gravity models. The choice between them is
using the Hausman test. However, both
methods have their own disadvantages. While
the random-effects models do not incorporate
country fixed-effects (which are likely to be
presented in a heterogeneous country sample),
time invariant variables will not yield
coefficient estimates in a fixed-effects model. It
means that we cannot acquire estimates for the
coefficients of time invariant variables,
although these can be quite interesting in a
Gravity model, since they reveal the “distance”
between two countries and reveal whether they
“share a land border”. As a remedy, Hausman
and Taylor (1981) and Wyhowki (1994) proposed
a different model that could incorporate the
advantages of the random-effects and the fixed -
effects models. Egger (2005) stated that the
Hausman-Taylor estimator is consistent and
the performance is at least equivalent to the
random-effects and the fixed-effects estimators.
Hoàng Chí Cương, Đỗ Thị Bích Ngọc, Bùi Thị Thanh Nhàn
419
McPherson and Trumbull (2003) also tested
different estimators and found the Hausman-
Taylor estimator to be superior in the
estimation results. From this perspective, the
author will use the Hausman-Taylor estimator
for the empirical analysis in this paper. The
Hausman-Taylor estimator is basically a hybrid
of the fixed - effects and the random - effects
models and takes the following formula:
y
it
= β
1
x’
1it
+ β
2
x’
2it
+
1
z’
1i
+
2
z’
2i
+ ε
it
+ u
i
(2)
In which, y
it
reflects the dependent variable
for country i in period/time/year t; x’
1it
denotes
variables that are time varying and uncorrelated
with the error term in the random-effects model
(u
i
); x’
2it
refers to a set of variables that are time
varying and correlated with u
i
; z’
1i
represents the
time invariant variables that are uncorrelated
with u
i
; z’
2i
describes the time invariant variables
that are correlated with u
i
; β
i
and
i
are the
vectors of coefficients associated with the
covariates; and ε
it
is the random error with the
hoping that its value is appropriate zero. My
benchmark specification models take the
following formulas:
LnEX
jt
= β
10
+ β
11
LnDIS
VNj
+ β
12
LnGDP
VNt
+
β
13
LnGDP
jt
+ β
14
Ln1- (GDP
VNt
/(GDP
VNt
+
GDP
jt
))
2
- (GDP
jt
/(GDP
VNt
+ GDP
jt
))
2
+
β
15
LnFDI
jt-1
+ β
16
LnRER
CURj/VNDt
+
β
17
Ln(ins
VNt
*ins
jt
) + γ
11
FTA + γ
12
Bothin
VNjt
+
γ
13
Onein
VNjt
+ γ
14
CRI
j
1997
+ γ
15
CRI
j
2008
+ γ
16
BOR
VNj
+ ε
1VNj
(3)
LnIM
jt
= β
20
+ β
21
LnDIS
VNj
+ β
22
LnGDP
VNt
+
β
23
LnGDP
jt
+ β
24
Ln1- (GDP
VNt
/(GDP
VNt
+
GDP
jt
))
2
- (GDP
jt
/(GDP
VNt
+ GDP
jt
))
2
+
β
25
LnFDI
jt-1
+ β
26
LnRER
CURj/VNDt
+
β
27
Ln(ins
VNt
*ins
jt
) + γ
21
FTA + γ
22
Bothin
VNjt
+
γ
23
Onein
VNjt
+ γ
24
CRI
j
1997
+ γ
25
CRI
j
2008
+
γ
26
BOR
VNj
+ ε
2VNj
(4)
In which:
EX
jt
is the real Vietnam’s exports to country
j at year t in $ (2005 price).
IM
jt
is the real Vietnam’s imports from
country j at year t in $ (2005 price).
DIS
VNj
is the weighted distance between
Vietnam and country j in km (CEPII work).
GDP
VNt
is the real GDP of Vietnam at year t
in $ (2005 price).
GDP
jt
is the real GDP of country j at year t
in $ (2005 price).
FDI
jt-1
is the amount of implemented FDI
capital of country j at year t-1 in Vietnam in $
(2005 price). To avoid the endogenous issues
such as the existence of bidirectional causality
between the FDI and GDP variables in gravity
models, the author uses a one time period lag
for the FDI variable.
RER
CURj/VNDt
is the real bilateral exchange
rate between Vietnam Dong (VND) and
currency of country j at year t. The real
exchange rate is calculated by the following
formula:
RER
CURj/VNDt
= e
CURj/VNDt
*
(CPI
jt
/CPI
VNt
) (5)
In which:
RER
CURj/VNDt
is the Real exchange rate
between VND and currency of country j at year t
e
CURj/VNDt
is the Nominal exchange rate
between VND and currency of country j at year
t (this expresses the number of VND used to
exchange with 1 currency unit of country j at
year t).
CPI
jt
is the Consumer Price Index of
country j at year t.
CPI
VNt
is the Consumer Price Index of
Vietnam at year t.
ins
VNt
is the average value of government
indicator of Vietnam at year t.
ins
jt
is the average value of government
indicator of country j at year t.
ins
VNt
* ins
jt
is an institutional variable. In
which, ins
VNt
and ins
jt
are the values of the
governance indicators of Vietnam and country
partner j respectively at year t. Each of them
will be taken from the average of five indicators:
(1) the Political Stability and Absence of
Violence/Terrorism; (2) Government
Effectiveness; (3) Regulatory Quality; (4) Rule of
Law; and (5) Control of Corruption indicators,
which are provided by the World Bank.
Percentile rank among all countries ranges from
New trade theory: New evidence from Vietnam
420
0 to 100. The higher figures mean better
governance. The institutional variable in this
study reveals the interaction in governance
between Vietnam and country partners. It
reveals that better governance may facilitate
the exports and imports of Vietnam.
FTA is a binary dummy variable which is
unity if Vietnam and country partner j have
joined/signed a regional bilateral/plurilateral
trade agreement at year t such as the AFTA,
USBTA, ACFTA, AKFTA, JVEPA, AJCEP and
the AANZFTA and otherwise.
7
Bothin
VNjt
is a binary dummy variable
which is unity if both Vietnam and country j are
WTO members at year t and otherwise.
Onein
VNjt
is a binary dummy variable which
is unity if either Vietnam or country j is a WTO
member at year t and otherwise.
CRI
j
1997
and CRI
j
2008
are binary dummy
variables. Each dummy will take the value of 1
if country j has been suffered from the 1997
Asian financial crisis or the 2008 global
financial and economic crisis respectively and
otherwise. The values of these variables are
obtained from the work of Laeven and Valencia
(2008) and some others (e.g., Bartram and
Bodnar (2009), Naudé (2009), Erkens et al.
(2012), Rose and Spiegel (2012)).
BOR
VNj
is a binary dummy variable which
is unity if Vietnam and country j share the land
border and otherwise.
1 - (GDP
VNt
/(GDP
VNt
+GDP
jt
))
2
-
(GDP
jt
/(GDP
VNt
+ GDP
jt
))
2
is the index of
similarity in GDP size (SIMSIZE in short) that
takes the value in the phase (-, -0.69). In case
of perfect dissimilarity (GDP
VN
has a huge
difference with the GDP
j
at year t), then Ln1 -
(GDP
VNt
/(GDP
VNt
+ GDP
jt
))
2
- (GDP
jt
/(GDP
VNt
+
7
AFTA: ASEAN Free Trade Area; USBTA: The U.S. –
Vietnam Bilateral Trade Agreement; ACFTA: ASEAN
China Free Trade Area; AKFTA: ASEAN Korea Free Trade
Agreement; JVEPA: Japan Vietnam Economic Partnership
Agreement; AJCEP: ASEAN - Japan Comprehensive
Economic Partnership Agreement; AANZFTA: ASEAN -
Australia - New Zealand Free Trade Agreement.
GDP
jt
))
2
ln[1 - (0)
2
- (1)
2
] or ln[1 - (1)
2
- (0)
2
]
ln (near Zero) = - . In case of perfect similarity
(GDP
VN
has a very pretty/small difference with
the GDP
j
at year t or GDP
VNt
GDP
jt
), then
Ln1- (GDP
VNt
/(GDP
VNt
+ GDP
jt
))
2
-
(GDP
jt
/(GDP
VNt
+ GDP
jt
))
2
ln[1 - (1/2)
2
- (1/2)
2
]
ln[1 - (1/4)
- (1/4)] ln (1/2) = - 0.69. The index
of similarity in GDP size should have positive
impact on foreign trade, especially on exports.
This is the most important variable in the
gravity equations for it assesses the impact of
the index of similarity in GDP size on exports
and imports of Vietnam. In other words, it helps
us find the answer for the research question
presented in the preamble of the paper. All the
variables, except the dummies, are in natural
logarithm form in gravity equations.
3.2. The data set
For the data, the empirical analysis
presented in this paper is based on a panel data
of country pairs set in the period from 1995 to
2011 which involves 18 Vietnam’s major/stable
trading partners including: Australia, Belgium,
Canada, China, France, Germany, Hong Kong,
Japan, Malaysia, the Netherlands, the
Philippines, the Russian Federation, Singapore,
the Republic of Korea, Taiwan, Thailand, the
United Kingdom (UK), and the United States.
Eighteen trading partners listed above account
for around 80% of Vietnam’s foreign trade in
duration of 1995 - 2011. The data were obtained
from different reliable sources such as
Vietnam’s authorities (e.g., the General
Statistics Office (GSO), the Ministry of Industry
and Trade (MIT), the Ministry of Planning and
Investment (MPI)) and the international
organizations (e.g., the Asian Development
Bank (ADB), the International Monetary Fund
(IMF), the United Nations Statistics Division
(UNSD), the World Bank (WB), and the WTO).
In regards to the special case of Taipei
(Taiwan), the figures were collected from ADB
and the World Economic Outlooks October
2012, available on Knoema’s website. The
subsequent section will present the empirical
results and some discussions.
Hoàng Chí Cương, Đỗ Thị Bích Ngọc, Bùi Thị Thanh Nhàn
421
4. THE EMPIRICAL RESULTS AND DISCUSSIONS
The estimated results of LnEX
jt
and LnIM
jt
gravity equations are summarized and reported
in the Table 4, Table 5, Table 6 and Table 7
below using the econometric software Stata 11
and the Hausman-Taylor estimator.
Table 4. Gravity Model Estimations using Hausman-Taylor estimator
Explanatory Variables
Dependent Variables
LnEX
jt
LnIM
jt
Time Varying Exogenous (x’
1it
) Coefficient
P. Value Coefficient P. Value
LnSIMSIZE 2.111613* 0.005 0.1549599 0.776
LnRER
CURj/VNDt
0.2185425** 0.018 0.1878377*** 0.074
Ln(ins
VNt
*ins
jt
) -0.7171291** 0.017 -0.7976364* 0.001
FTA 0.2305745** 0.024 0.2396292* 0.001
Bothin
VNjt
-0.6370675*** 0.094 1.182218* 0.000
Onein
VNjt
-0.3824997** 0.018 0.3431386* 0.003
CRI
j
1997
0.2910508* 0.001 0.1361741** 0.024
CRI
j
2008
0.2630407 0.330 -0.5987318* 0.002
Time Varying Endogenous (x’
2it
)
LnGDP
VNt
0.3628319 0.587 1.481185* 0.002
LnGDP
jt
2.551989* 0.000 0.9565375*** 0.056
LnFDI
jt-1
0.0562757** 0.016 0.0589474* 0.000
Time Invariant Exogenous (z’
1i
)
LnDIS
VNj
-1.058839* 0.000 -1.641928* 0.000
BOR
VNj
-1.085608 0.190 -0.7403132 0.526
Constant -41.1477* 0.000 -24.6597* 0.000
Notes: *, **, and *** indicate significance at the levels of 1%, 5%, and 10% respectively.
Table 5. Summary of the Statistics (Period: 1995 - 2011, Countries: 18, Observations: 306)
Variables Observations Mean Standard Deviation Min Max
LnEX
jt
306 20.4561 1.1627 16.7017 23.5033
LnIM
jt
306 20.3741 1.4608 16.8974 23.8168
LnDIS
VNj
306 8.3099 0.9309 6.7140 9.5226
LnGDP
VNt
306 24.5363 0.3192 23.9940 25.0309
LnGDP
jt
306 27.2633 1.3520 24.9592 30.2141
LnSIMSIZE 306 -2.2742 1.1348 -5.1491 -0.7707
LnFDI
jt-1
306 17.9463 1.8680 10.6049
21.7693
LnRER
CURj/VNDt
306 7.8679 2.0986 2.2858
10.3280
Ln(ins
VNt
*ins
jt
) 306 7.9462 0.3712 6.6646 8.3059
FTA 306 0.2549 0.4365 0 1
Bothin
VNjt
306 0.2778 0.4486 0 1
Onein
VNjt
306 0.6405 0.4806 0 1
CRI
j
1997
306 0.1438 0.3515 0 1
CRI
j
2008
306 0.2941 0.4564 0 1
BOR
VNj
306 0.0555 0.2294 0 1
422
Table 6. Correlation matrix for LnEX
jt
equation
Correlation LnEX
jt
LnDIS
VNj
LnGDP
VNt
LnGDP
jt
LnSIMSIZE LnFDI
jt-1
LnRER
CURj/VNDt
Ln(ins
VNt
*ins
jt
) FTA Bothin
VNjt
Onein
VNjt
CRI
j
1997
CRI
j
2008
BOR
VNj
LnEX
jt
1.0000
LnDIS
VNj
-0.0577
1.0000
LnGDP
VNt
0.6841 -0.0000 1.0000
LnGDP
jt
0.3771 0.7099 0.1281 1.0000
LnSIMSIZE -0.2415 -0.6802 0.1061 -0.9676 1.0000
LnFDI
jt-1
0.2890
-0.3085 -0.0147 0.0776 -0.0904 1.0000
LnRER
CURj/VNDt
-0.0606
0.5159 -0.0028 0.1978 -0.2000 -0.2979 1.0000
Ln(ins
VNt
*ins
jt
)
0.1264
0.2974 -0.0004 0.2023 -0.1977 0.1819 0.4807 1.0000
FTA 0.4820 -0.3518 0.4158 -0.0615 0.1081 0.1226 -0.1500 -0.2201 1.0000
Bothin
VNjt
0.5516 -0.0190 0.7449 0.1021 0.0699 0.0309 0.0130 0.1122 0.3404 1.0000
Onein
VNjt
-0.3999
0.0393 -0.5588 -0.0718 -0.0709 0.0023 0.1009 0.1806 -0.2182 -0.8278 1.0000
CRI
j
1997
-0.1012 -0.2386 -0.3767 -0.1481 0.0482 0.1147 -0.1689 -0.0177 -0.2183 -0.2541 0.1517 1.0000
CRI
j
2008
0.5395 0.0000 0.7753 0.1075 0.0754 0.0198 -0.0122 0.0192 0.3137 0.9608 -0.7869 -0.2645 1.0000
BOR
VNj
0.1973 -0.1434 -0.0000 0.1884 -0.1829 -0.0159 -0.0356 -0.3531 0.1855 0.0088 -0.1454 0.0632 0.0000 1.0000
New trade theory: New evidence from Vietnam
422
Hoàng Chí Cương, Đỗ Thị Bích Ngọc, Bùi Thị Thanh Nhàn
423
Table 7. Correlation matrix for LnIM
jt
equation
Correlation LnIM
jt
LnDIS
VNj
LnGDP
VNt
LnGDP
jt
LnSIMSIZE
LnFDI
jt-1
LnRER
CURj/
VNDt
Ln(ins
VNt
*in
s
jt
)
FTA Bothin
VNjt
Onein
VNjt
CRI
j
1997
CRI
j
2008
BOR
VNj
LnIM
jt
1.0000
LnDIS
VNj
-0.4628 1.0000
LnGDP
VNt
0.5278 -0.0000 1.0000
LnGDP
jt
0.0945 0.7099 0.1281 1.0000
LnSIMSIZE 0.0170 -0.6802 0.1061 -0.9676 1.0000
LnFDI
jt-1
0.5487 -0.3085 -0.0147 0.0776 -0.0904 1.0000
LnRER
CURj/VNDt
-0.4252 0.5159 -0.0028 0.1978 -0.2000 -0.2979 1.0000
Ln(ins
VNt
*ins
jt
) -0.0548 0.2974 -0.0004 0.2023 -0.1977 0.1819 0.4807 1.0000
FTA 0.4686 -0.3518 0.4158 -0.0615 0.1081 0.1226 -0.1500 -0.2201 1.0000
Bothin
VNjt
0.4385 -0.0190 0.7449 0.1021 0.0699 0.0309 0.0130 0.1122 0.3404 1.0000
Onein
VNjt
-0.3876 0.0393 -0.5588 -0.0718 -0.0709 0.0023 0.1009 0.1806 -0.2182 -0.8278
1.0000
CRI
j
1997
-0.0313 -0.2386 -0.3767 -0.1481 0.0482 0.1147 -0.1689 -0.0177 -0.2183 -0.2541
0.1517 1.0000
CRI
j
2008
0.4362 0.0000 0.7753 0.1075 0.0754 0.0198 -0.0122 0.0192 0.3137 0.9608 -0.7869 -0.2645 1.0000
BOR
VNj
0.2415 -0.1434 -0.0000 0.1884 -0.1829 -0.0159 -0.0356 -0.3531 0.1855 0.0088 -0.1454 0.0632 0.0000 1.0000
Hoàng Chí Cương
, Đ
ỗ
Th
ị
Bích Ng
ọ
c
, Bùi Th
ị
Thanh Nhàn
423
424
The Gravity Models constructed in this
paper seem fit the data well because no of
correlations exceeds 0.8 (see more on the Table
6 and Table 7). The estimates presented in the
Table 4 indicate that a large share of the
variation of Vietnam’s exports and imports
recently could be explained by a considerable
number of factors, namely, GDP, Distance, FDI,
FTA, Exchange rate, Institution, WTO, Crises,
and the Index of similarity in GDP size
(SIMSIZE in short). However within the
analysis framework of this study, the author
focuses more on the coefficients β
14
and β
24
for
they reflect the impact of similarity in GDP size
on exports and imports of Vietnam.
Furthermore, they support for the answer of the
research question: Does the increasing
similarity in GDPs among developing countries
lead to higher bilateral trade between them?
First, the coefficient of the lnSIMSIZE
variable (β
14
) in the LnEX
jt
equation is positive
and statistically significant at the level of 1%
suggesting that Vietnam has exported much
more of goods to the country partners which
have the similarity in GDP size with her. By
contrast, the coefficient of the lnSIMSIZE
variable (β
24
) in the LnIM
jt
equation is not
statistically significant indicating that Vietnam
has not imported as such of goods from those
similar trading partners. The question is why
does Vietnam tend to export more to trading
partners with similarity in GDP size? The
answer could be related to the FDI in Vietnam.
It is shown that the presence of foreign firms in
Vietnam, through horizontal and vertical
(backward or forward) linkages, significantly
affects the exports of Vietnam, especially, in
intra-industry trade.
8
Mentioning the FDI in
Vietnam, since the launch of the “outward -
looking policy” from the early 1990s, the
country has successfully attracted a
considerable amount of FDI capitals from
regional countries, especially after her accession
8
For further information, please see more on Anwar and
Nguyen (2011).
to the WTO.
9
The accumulative figure is over $
220,000 million, in which implemented FDI
capital is around $ 100,000 million in 1986 -
2011 duration. It is clear that FDI in Vietnam is
seeking for export-orientation resulting from
trade liberalization under FTAs and the WTO
in which Vietnam has joined recently. Notably,
FDI focuses on processing and assembling
industries to enjoy/exploit the cheap domestic
labors and natural resources. However, as
analyzed in the previous sections, due to lack of
subsidiary industries, most all of FDI
enterprises have to seek the input material
sources from the world markets (usually from
mother companies). After manufacturing or
processing, foreign firms export their outputs
(finished/final products) back to home country
or to the global market. The share of FDI
enterprises in Vietnam’s total exports is around
55% in recent years. This might be one cause for
the increase of the intra-industry trade in
Vietnam. The expertise partially comes from the
empirical results. The estimated coefficient of
the lnFDI
jt-1
variable is positive and significant
at the levels of 5% and 1% respectively in the
LnEX
jt
and LnIM
jt
gravity equations. This
suggests that FDI has stimulated both the
country’s exports and imports recently.
Obviously, FDI has been an important factor
inducing the country’s foreign trade. In
Addition, Markusen and Venables (1998) found
the importance of multinational firms in total
activity when countries are similar in incomes
(size) and in relative factor endowments, and
when total world income is high.
10
Moreover, as
shown in the work of Kyoji (2003) that as
economic integration in East Asia progresses,
trade patterns within the region are displaying
an ever-greater complexity: the share of inter-
industry trade in overall trade is declining.
Instead, intra-industry trade (IIT), which can
be further divided into horizontal IIT and
9
See more on Hoang (2013).
10
Markusen, J.R. and Venables, A.J. (1998). Multinational
firms and the new trade theory. Journal of International
Economics 46, pp. 183-203.
Hoàng Chí Cương, Đỗ Thị Bích Ngọc, Bùi Thị Thanh Nhàn
425
vertical IIT, is growing in importance.
11
Particularly, vertical IIT is closely related to
offshore production by multinational
enterprises. This implies that FDI plays a
significant role in the rapid increase in vertical
IIT in East Asia in recent years. Roldán et al.
(2011) have proved for the growth of IIT in
overall trade between Latin America and Asia.
Accordingly, the economic sectors in this
analysis include the agro-based, rubber-based,
wood-based products, fisheries, health-care,
automobile, textile and garments, electronics,
and ICT industries. Their findings indicate that
the Grubel-Lloyd index (GLI) allows the
identification of sectors where there is evidence
of IIT among ASEAN-7
12
(including Vietnam)
and the Pacific Alliance.
13
Thus the trade
relation between those countries has the
potentiality to become IIT. These results are
relevant in the light of the identification of
opportunities to expand trade and straighten
the production linkages among APEC members
in the intra-industry trade.
11
The Intra-industry trade (IIT) is also defined as one that
occurs “if a country simultaneously imports and exports
similar goods and services” (Van Marrewijk, 2009).
Horizontal intra-industry trade refers to the simultaneous
import and export of goods classified in the same industry
and at the same level of processing (Van Marrewijk, 2009).
Vertical intra-industry trade is characterized by a two-
way exchange of goods classified in the same industry but
with different levels of processing (Van Marrewijk, 2009).
The extent of intra-industry trade is commonly measured by
Grubel-Lloyd index based on commodity group
transactions. Thus, for any particular product class i, an
index of the extent of intra-industry trade in the product
class i between countries A and B is given by the following
ratio:
IIT
i, AB
= [((X
i
+ M
i
) - |X
i
– M
i
|)/(X
i
+ M
i
)]*100
This index takes the minimum value of zero when there are
no products in the same class that are both imported and
exported, and the maximum value of 100 when all trade is
intra-industry (in this case X
i
is equal to M
i
).
12
ASEAN-7 Includes ASEAN members also in APEC:
Brunei Darussalam, Indonesia, Malaysia, the Philippines,
Singapore, Thailand and Vietnam.
13
The Pacific Alliance or Alianza del Pacifico in Spanish was
initially known as Acuerdo de Integración Profunda AIP.
Currently, the Pacific Alliance members are: Mexico,
Colombia, Chile and Peru.
Second, for the lnGDP
jt
and lnGDP
VNt
variables, theoretically when GDP of a country
partner grows (in this situation income of its
domestic consumers also increases) resulting in
an increase in the demand of foreign imported
goods. Consequently, a country partner is likely
to import more from abroad. It means an
increase of a country partner’s GDP will
potentially motivate Vietnam’s exports. The
estimated coefficients of the lnGDP
jt
variables
in both the LnEX
jt
and LnIM
jt
equations are
positive and significant at the levels of 1% and
10% respectively. This means an increase of
GDP of country partner strongly motivates both
exports and imports of Vietnam. The author
also observes the positive significant coefficient
of the lnGDP
VNt
variable in the LnIM
jt
equation.
This suggests that the development of
Vietnam’s domestic market (economic growth),
in turn, led to an increase in the country’s
imports to serve this process. In other words,
local suppliers could not satisfy all demands for
domestic manufacturing and consuming, hence
the country had to seek the imports from
foreign sources.
Third, while the author finds the positive
impacts of the exchange rate regime on both
Vietnam’s exports and imports the negative
significant coefficients of institutional variables
in both gravity equations suggesting that
institution has been a friction in foreign trade of
the country. So the policy makers of Vietnam
should take a look on this issue. As the author
predicted, the FTAs which Vietnam has
signed/joined recently have induced both
exports and imports of the country as they
present the culmination of trade integration
within the economic space of country members.
The coefficients of these dummy variables are
significant in two gravity equations.
Fourth, the estimated results show that the
WTO has clearly expanded the country’s
imports rather than exports. This expresses the
“trade creation effect” (replace the higher cost of
domestic production by lower cost sources of
supply from abroad through importation) as the
WTO accession is accompanied by Vietnam’s
426
tariff reduction and loosening the quantitative
restriction. The question is why does the WTO
have not induced the country’s exports as had it
in mind? The explanation comes partially from
Subramanian and Wei (2007, p. 157) arguments
that when Vietnam liberalizes its imports under
the WTO’s agreements, there is reason to expect
Vietnam’s imports from the WTO members to
increase but there is no theoretical reason for
its exports to the WTO members to increase as
well. In other words, the trade effect of the
WTO really relates to imports rather than
exports, and Vietnam is not an exceptional case.
Fifth, the author confers the impacts of two
financial crises on Vietnam’s exports and
imports. The empirical results indicate that the
1997 crisis did not reduce the volume of the
country’s foreign trade as predicted for its
positive significant coefficients in both gravity
equations. By contrast, the 2008 global financial
and economic crisis has had negative impact on
imports of the country. The coefficient of this
variable is negative and significant at the level of
1% in the LnIM
jt
equation. This implies that the
channel that transmits the forces that raise
growth also transmits forces that lower growth
when world markets weaken and decline. The
fact is that the more open an economy is to trade,
the faster it can grow when world demand is
expanding. But when there is a crumple/collapse
in world demand; the more open an economy is,
the more exposed it is to negative external
shocks. This suggests that Vietnam should vary
her export-import structure and export
destinations as well as import sources to avoid
depending much more on some trading partners.
Finally, the coefficients of the LnDIS
VNj
variables in both gravity equations are clearly
negative and significant at the level of 1%
indicating that Vietnam trades less from more
distant countries owing to higher transport and
transaction costs. Transport and transaction
costs are likely to increase if two countries are
located far away from each other. This is
definitely appropriate with the results in many
empirical studies using the theory of gravity. To
this end, contrary to popular belief, the close
geographical location between Vietnam and
China has not induced Vietnam’s trade flows
with this neighbor country because the
coefficients of the BOR
VNj
dummy variables are
insignificant in both gravity equations.
5. CONCLUDING REMARKS
By constructing two gravity models and a
panel data of country pairs that involves 18
major trading partners during 1995 - 2011 and
the Hausman-Taylor estimator, the paper finds
evidence broadly consistent with the
hypothesis/prediction that the SIMSIZE has
promoted strongly Vietnam’s exports of goods to
similar trading partners. By contrast, there is
no evidence that demonstrates convincingly
that Vietnam has imported such large amount
of goods from those countries. These
investigations are also sufficient for the
conclusion that the increasing similarity in
GDPs among developing countries could lead to
higher bilateral trade between them. The main
findings of this research provide some support
for the New Trade Theory. Hence, international
trade is not only driven by differences in factor
endowments as stated in neoclassic theories
such as the Ricardian theory of Comparative
Advantage and the H-O theory but also by the
identical factor endowments inspired by the
New Trade Theory. This implies that the inter-
industry trade (motivated by traditional
neoclassic theories) seems to be prevalent
between counties which have differences in
factor endowments; and intra-industry trade
(supported by the New Trade Theory) is likely
to be prevailed between countries with identical
factor endowments.
Overall, there is no doubt that my
investigations can somewhat contribute to the
existing literature on the New Trade Theory in
terms of testable implications from gravity
models that emphasize in the case study
between some developing countries. However,
available data have been too limited to selected
trading partners of Vietnam to produce a
persuasive test of the hypothesis. It could well
Hoàng Chí Cương, Đỗ Thị Bích Ngọc, Bùi Thị Thanh Nhàn
427
be that some more samples of developing
countries were included in the panel data. And,
an analysis of the IIT at the firm/industry level
for the case of Vietnam is also very important to
support for these investigations, which merits
future research to understand how
international trade is transformed.
REFERENCES
Anderson, J. and Wincoop van E. (2003). Gravity with
gravitas: a solution to the border puzzle. American
Economic Review, 93 (1): 170 - 192.
Anderson, J. E. (1979). A theoretical foundation for the
gravity equation. American Economic Review, 69:
106-116.
Antras, P. and Helpman E. (2004). Global Sourcing.
Journal of Political Economy, 112: 552-580.
Anwar, S. and P.L. Nguyen (2011). Foreign direct
investment and export spillovers: Evidence from
Vietnam. International Business Review, 20: 177-
193.
Balassa, B. (1966). Tariff reduction and trade in
manufactures among the industrial countries.
American Economic Review, 56: 466-473.
Bartram, S.M. and Gordon M. Bodnar (2009). No place
to hide: The global crisis in equity markets in
2008/2009. Journal of International Money and
Finance 28: 1246-1292.
Bayoumi, T., and Eichengreen B. (1995). Is
regionalism simply a diversion? Evidence from the
evolution of the EC and EFTA. NBER Working
Paper 5283.
Bergstrand, J. H. (1985). The gravity equation in
international trade: Some microeconomic
foundations, and empirical evidence. Review of
Economics and Statistics 67 (4): 474-81.
Deardorff, A. V. (1998). Determinants of bilateral
trade: Does gravity model work in a neoclassical
world? In The Regionalization of the World
Economy (Ed.) Frankel, J., University of Chicago
Press, Chicago.
Debaere, P. (2005). Monopolistic competition and
trade, revisited: testing the model without testing
for gravity, Journal of International Economics, 66:
249-266.
Egger, P. (2005). Alternative Techniques for
Estimation of Cross-Section Gravity Models.
Review of International Economics, 13(5): 881-
891.
Eicher, T.S., and Henn C. (2011). In search of WTO
trade effects: Preferential trade agreements
promote trade strongly, but unevenly. Journal of
International Economics, 83: 137-153.
Erkens, D.H., Hung M. , Matos P. (2012). “Corporate
governance in the 2007 - 2008 financial crisis:
Evidence from financial institutions worldwide”.
Journal of Corporate Finance, 18: 389-411.
Grubel, H.G., Lloyd P.J. (1975). Intra-Industry Trade:
The Theory and Measurement of International Trade
in Differentiated Products. Wiley, New York.
Hausman, J. and Taylor W. (1981). Panel Data and
Unobservable Individual Effects. Econometrica,
49(6): 1377-1398.
Helpman, E. (1981). International trade in the presence
of product differentiation, economies of scale and
monopolistic competition: a Chamberlin -
Heckscher - Ohlin approach. Journal of
International Economics 11: 305-340.
Helpman, E. (1987). Imperfect competition and
international trade: evidence from fourteen
industrial countries. Journal of the Japanese and
International Economies 1: 62-81.
Helpman, E., Melitz M. , and Rubinstein Y. (2008).
Estimating trade flows: trading partners and
trading volumes. Quarterly Journal of Economics
123(2): 441-487.
Helpman, E., P. Krugman (1985). Market Structure and
Foreign Trade. Increasing Returns, Imperfect
Competition and the International Economy. MIT
Press, Cambridge.
Hoang, C.C. (2013). The Impact of the World Trade
Organization (WTO) Regime on Foreign Direct
Investment (FDI) Flows to Vietnam: A Gravity
Model Approach. Journal of Modern Accounting
and Auditing, 9(7) (forthcoming).
Hummels, D. and Levinsohn J. (1995). Monopolistic
competition and international trade: reconsidering
the evidence. Quarterly Journal of Economics 110:
799-836.
Krugman, P. (1979). Increasing returns to scale,
monopolistic competition and international trade.
Journal of International Economics 9: 469-479.
Krugman, P. (1980). Scale economies, product
differentiation and the pattern of trade. American
Economic Review 70 (5): 950-959.
Kyoji, F. (2003). Vertical Intra-Industry Trade and
Foreign Direct Investment in East Asia. Japanese
Int. Economies 17: 468-506.
Laeven, L. and Valencia F. (2008). System Banking
Crises: A New Database. IMF Working paper No.
WP/08/224.
Lancaster, K. (1980). Intra - industry trade under
perfect monopolistic competition. Journal of
International Economics, 10: 151-175.
428
Linneman, H. (1966). An Econometric Study of
International Trade Flows. North Holland
Publishing Company, Amsterdam.
Markusen, J.R. and Venables A.J. (1995).
Multinational Firms and the New Trade Theory.
NBER Working Paper N. 5036, Feb.
Markusen, J.R. and Venables A.J. (1998). Multinational
firms and the new trade theory. Journal of
International Economics 46: 183-203.
Mauro, F.D. (November 2000). The Impact of
Economic Integration on FDI and Exports: A
Gravity Approach. Working Document No. 156.
McPherson, M. and Trumbull W. (2003). Using the
Gravity Model to Estimate Trade Potential:
Evidence in Support of the Hausman-Taylor
Method, website:
accessed on 25
th
December 2012.
Medvedev, D. (2012). Beyond Trade: The Impact of
Preferential Trade Agreements on FDI Inflows.
World Development, 40(1): 49-61.
Melitz, M.J. (2003). The Impact of Trade on Intra-
Industry Reallocations and Aggregate Industry
Productivity. Econometrica, 71: 1695-1725.
Naudé, W. (2009). “The Financial Crisis of 2008 and
the Developing Countries”. Discussion Paper No.
2009/01.
Ottaviano and Gianmarco I.P. (2011). New’ new
economic geography: firm heterogeneity and
agglomeration economies. Journal of Economic
Geography, 11 (2): 231-240.
Pham, T.H.H (2011). Does the WTO accession matter
for the Dynamics of Foreign Direct Investment and
Trade? Economic of Transition, 19(2): 255-285.
Poyhonen, P. (1963). A tentative model for the volume
of trade between countries, Weltwirtschaftliches
Archiv., 90: 93-100.
Roldán, A. and Pérez C. (2011). The Importance of
Intra-Industry Trade between ASEAN-7 and the
Pacific Alliance: A Mechanism to Strengthen
Economic Integration and Expanding Trade across
the Pacific. Working paper.
Rose, A. (2004a). Do we really know that the WTO
really increases trade? American Economic
Review, 94: 98-114.
Rose, A.K. and Mark M. Spiegel (2012). Cross-country
causes and consequences of the 2008 crisis: Early
warning. Japan and the World Economy, 24: 1-16.
Shiozawa, Y. (2007). A New Construction of Ricardian
Trade Theory: A Many-country, Many-commodity
with Intermediate Goods and Choice of Techniques.
Evolutionary and Institutional Economics Review, 3
(2): 141-187.
Subramanian, A. and Wei S-J. (2007). The WTO
promotes trade, strongly but unevenly. Journal of
International Economics, 72: 151-175.
Tomz, M., J. Goldstein and D. Rivers (2007).
Membership has its privileges: the impact of the
GATT on international trade, American Economic
Review, 97: 2005-2018.
Urata, S. and O. Misa (2007). The impacts of Free
Trade Agreements on Trade Flows: An
Application of the Gravity Model Approach.
RIETI Discussion Paper Series 07 - E - 052.
Van Marrewijk, C. (2009). The Princeton Encyclopedia
of the World Economy. Princeton, United States of
America: Princeton, 2: 708-713.
Verdoorn, P.J. (1960). Intra-block trade of benelux. In:
Robinson, E.A. (Ed.) Economic Consequences of
the Size of Nations. Macmillan, London.
Wyhowski, D. (1994). Estimation of a Panel Data
Model in the Presence of Correlation between
Regressors and a Two-Way Error Component.
Econometric Theory, 10(1): 130-139.