Analysis of the production capacity of a packaging machine in the plastic components sector in a company of the manaus industrial complex
Bạn đang xem bản rút gọn của tài liệu. Xem và tải ngay bản đầy đủ của tài liệu tại đây (204.33 KB, 5 trang )
International Journal of Advanced Engineering Research and
Science (IJAERS)
Peer-Reviewed Journal
ISSN: 2349-6495(P) | 2456-1908(O)
Vol-8, Issue-6; Jun, 2021
Journal Home Page Available: />Article DOI: />
Analysis of the Production Capacity of a Packaging
Machine in the Plastic Components Sector in a Company
of the Manaus Industrial Complex
Antonio Almeida Ferreira¹, Fabiana Rocha Pinto²
1Department
2Doctorate
of Engineering, Centro Universitário FAMETRO, Brazil
in tropical agronomy, Centro Universitário FAMETRO, Brazil
Received: 30 Apr 2021;
Received in revised form:
25 May 2021;
Accepted: 08 Jun 2021;
Available online: 18 Jun 2021
©2021 The Author(s). Published by AI
Publication. This is an open access
article under the CC BY license
( />/4.0/).
Keywords—
Productive
Process,
Goals, Statistical Analysis, OEE –
Overall Equipment Effectiveness,
Reality.
I.
Abstract— The industrial scenario demonstrates a production dispute not only
with other companies competing in the market, but competition within the
organization in order to demonstrate excellence in the production process.
Establishing a correct manufacturing goal will aid in production planning,
determine concise objectives with actual plant capability, and ensure that outliers
are identified in advance for the correct solution and application of efforts to
improve the process. These steps will ensure the correct evaluation of the plant
before other business units, as well as stipulation measures that are adopted so as
not to impair the real perception of the process and to consider the indicators
without any margins of disagreement. The production to be studied comes from
the work of packaging plastic components performed by a machine divided into
two stages of operation, first manual and manufactured and then automated
packaging. The production data is improved by shifts of eight hours through those
used and subsequently entered into the company's database. In these, statistical
tools will be used, helping to better compose the data, where a qualified sample is
sought for the study, which through the OEE - Overall Equipment Effectiveness
indicator provided in this set, will measure the efficiency through the indices of
availability, quality and productivity and whether the disposition of values and
their representativeness within what has been established is practicable. The
grouping of generated data demonstrates a condition expected by the production
team, but that only through numerical results can be explained, a target based on
the nominal capacity of the machine does not represent the current state of the
process and becomes infeasible to achieve the normal conditions of production.
Consider a value below what was previously stipulated, non-demonstration to be
an erroneous strategy because of the history of the demonstration process and
also because the calculations demonstrated are in accordance with the reality
and production volumes achieved. Understanding a real productive capacity and
working on concise numbers will allow accurate decision making.
INTRODUCTION
Production targets established by companies do not
represent the actual production capacity of machines. The
determined values are based on the machine’s nominal
www.ijaers.com
value, the design capacity. As explained by [1], design
capacity does not take into account losses during the
process. Also, according to the authors, production
capacity is the maximum amount of output of a good or
service in a given period of time.
Page | 213
Antonio Almeida Ferreira et al.
International Journal of Advanced Engineering Research and Science, 8(6)-2021
Planning the production capacity is an advantage for
companies, as with the correct value set to achieve the
results, it is possible to prepare for the demand, in addition
to structuring project expenses and manufacturing inputs.
The degrees and levels of capacity may vary depending on
authors and different companies; however, the meaning of
the content remains the same [1].
Statistical calculation, based on the global production
indicator called OEE – Overall Equipment Efficiency, was
used to study the equipment’s production capacity. The
OEE is an indicator that shows how efficient a factory is
based on the assets installed in it [2].
As stated by [3], the overall efficiency of an
equipment is established by the TPM as an indicator that
continuously assesses the machine’s production capacity to
deliver what was theoretically calculated in the
manufacturing design. The authors explain that the OEE
can identify values and measure losses during the
manufacturing process, which is divided into three (3)
factors: availability, productivity and quality.
The OEE indicator uses simple methodological
models and non-complex tools to stratify problems. With
this, it seeks to achieve, in the short term, and gradually,
improvements which should eventually become
continuous and long-lasting. This reachability through
indicators, which are fragmented for better understanding,
also allows for an in-depth study in order to increase
results [3].
As developed in the study by [4], it is essential to
analyze alternative indicators to Overall Equipment
Effectiveness (OEE). To complement and structure
industrial management that is up to date with market
demands, the form of application of OEE can be adapted
to suit the context in which it will be used.
With the data and numbers related to the company’s
production in hand, it is possible to organize and conduct a
statistical study. Statistics, as a science, comprises the
studies based on the collection of data, understanding and
analysis of this information to present the results of a
group in an explanatory manner, to understand a general
picture and observe the whole scenario.
Statistical studies support production capacity studies
through the OEE. Statistics avoid presenting biased
information, being able to study the whole from a set of
data. Data is understood as a set of values, numerical or
not. Through its models, statistics allow knowing
determining factors for various events [5].
This article aims to study the production history of a
company of the Manaus Industrial Complex (MIC), by
comparing it with its current productivity, using
mathematical principles to analyze the current production
www.ijaers.com
capacity of a packaging machine in the plastic components
sector.
II.
MATERIAL AND METHODS
The company under study, part of the Manaus
Industrial Complex (MIC) and consolidated worldwide,
makes plastic components for packaging, distributed in the
domestic and foreign markets. Increase in efficiency is an
improvement pillar for the structure of this company. The
sector to be studied is the production of final packaging for
shipment to customers, whose process is divided into two
parts: manual and automatic.
It is necessary to define goals that are tangible and
achievable, according to the statistical reality and based on
the study of the Overall Equipment Effectiveness (OEE)
production indicator. Thus, these goals can be compared
with the goals currently established, and it is possible to
verify if they were achieved and are consistent with the
values shown in this study.
A general data spreadsheet (Microsoft Excel® 2019,
Redmond, WA, USA) extracted from production reports
will be presented, and statistics will be used as a tool to
obtain a correct average to represent the real status of the
machine. Subsequently, these values will be compared
with OEE values to analyze machine numbers and actual
production by shifts.
The OEE metrics are shown through productivity,
quality and availability equations. Multiplying the three
factors results in the OEE value [6]:
Productivity equals good production divided by
theoretical production:
P = GP ÷ THEORP;
THEORP = OT * PPM;
OT is the operation time and PPM stands for pieces
per minute.
The calculation only considers the time the machine is
running, discarding any machine downtimes, scheduled or
not. The pieces per minute value is the machine standard,
informed by the manufacturer and defined by process
engineering.
Quality is calculated by dividing Good Production
(GP) by Total Machine Output (TP).
Q = GP ÷ TP;
The calculation of availability takes into account all
production times that are managed in production.
Operation time (OT), Planned Operation Time (POT),
which is calculated by discarding all scheduled machine
downtimes.
Machine losses that directly affect availability are
those that are unforeseen and require corrective
maintenance actions [7]. Scheduled downtimes are those
that involve planning and are previously scheduled so as
Page | 214
Antonio Almeida Ferreira et al.
International Journal of Advanced Engineering Research and Science, 8(6)-2021
not to impact the production schedule, such as preventive
maintenance, cleaning, machine lubrication, shutdowns
due to high inventory.
The equation is defined as:
A = OT ÷ POT;
Thus, the OEE formula is:
OEE = P * Q * A
Due to the high number of shifts to be analyzed,
statistical calculations with standard deviation can be used.
This study will make it possible to use a model with
reduced range, closer to the mean curve of the data set,
centralizing the information for analysis. This enables the
analysis to disregard cases that are exceptions, out of the
ordinary, and unusual to the standard process, which do
not contribute to the case study [8].
Standard deviation is a calculation made from the
mean to observe how values vary in the dataset. It
indicates what the average error will be, also understood as
the deviation made when trying to replace each
observation with the average [9].
Standard deviation helps to understand the dispersion
of values in the dataset. By transforming its value into a
unit, the number of factors that are grouped in a given
region of the complete set can be visualized [10].
To have a more accurate measurement of the total data
set, it is necessary to separate the sample into classes and
limit the range to values closer to the mean. Class
distribution makes it possible to study a sample and verify
the reliability of the data, allowing to analyze
representativeness according to the object of study [11].
As described by [10], when the raw data is
defragmented and distributed into classes, some
information is lost due to no longer being able to observe
the individual characteristics of each value; however,
compared to the gain in concise information and real
representation, it is considered that this loss can be
dismissed.
In a distribution into classes, data are divided into
value ranges or intervals. A class is a line of frequency
distribution, in which the difference between the lowest
and highest observed value of variable X is called total
amplitude (AT = xmax – xmin); the lowest value of the
class is called the lower limit; and the highest value of the
class is called upper limit [11].
III.
RESULTS AND DISCUSSIONS
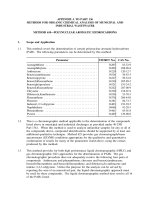
Table 1 shows a total of 1046 work shifts, in
which each individual has a production value, with a
standard time interval of eight work hours. Furthermore,
there can be more than one productive shift per day. The
Shifts/Day reference helps to check the number of shifts
needed to reach the production average.
www.ijaers.com
Table 1. Production values per shift
Shifts
/Day
Average
production
/
shift
(output)
Average
production/
day
(output)
Years
Shift
s
2018
345
149
2.3
32,106
69,018
2019
421
284
1.5
30,183
72,710
2020
280
106
2.6
32,436
82,129
Total
1,046
539
1.9
31,420
73,638
Days
It was possible to verify that the values are
historically below 40,000 units produced, which is the
number set as the production target of the packaging
machine. In 2020, to get to an average output per day that
reached the goal, in this case, 80,000, as it involves two
production shifts, it was necessary to work 23% more,
with an average of 2.6 shifts per day.
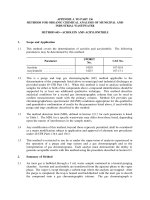
Table 2, using standard deviation to limit the
amplitude, obtained higher averages than the previous
table. This is because this analysis excludes outliers,
reducing the sample to 60% of the population.
Table 2. Production considering the standard deviation.
Year
Standard
deviation
Production average in the
standard deviation range
(± 1σ)
2018
10,235
34,170
2019
8,475
30,823
2020
7,959
33,262
Total
9,017
32,434
Comparing the values shown in Tables 1 and 2,
there is an increase in average output when using the
standard deviation to limit the sample values. With the
increase in average, it can be inferred that limiting the
sample increases the production average, as it reduces the
number of elements outside the production proportionality.
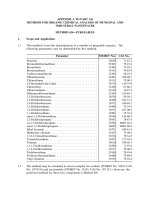
Table 3 presents the number of shifts and divides
them into classes to check the region with the highest
number of elements, in order to calculate the average that
represents the production.
Table 3. Distribution of shifts into classes
Number of shifts
Class/Year
2018
2019
2020
Period
total
Page | 215
Antonio Almeida Ferreira et al.
International Journal of Advanced Engineering Research and Science, 8(6)-2021
x < 30K
115
186
89
390
30 ≥ x < 35
66
102
77
245
35 ≥ x < 40
76
84
70
230
x ≥ 40k
88
49
44
181
Total n. of shifts
345
421
280
1046
As can be seen, 46% of the shifts have values
greater than 30k and less than or equal to 40k. The 40k
machines target is reached in only 17% of the shifts, which
represents 181 shifts out of 1046. In addition, 37% of the
shifts have output of less than 30k.
Analyzing the high number of shifts that do not
reach 30k of units made, it should be considered that the
factory operation system has two shifts with reduced time
every week, for general cleaning (5S program). Thus,
production below 30k does not always represent machine
failure; it may also be due to planned downtime. This
shorter production time cannot impact the assessment
indicators. Based on this information, one can choose to
study the class that presents production values between
30k and 40k of units made, as the statistical values of this
area are in closer agreement with the reality of machine
output (Table 4).
Table 4. Average of units made in classes 30 ≤ x < 40
between 2018 and 2020.
Year
Average of units made between
30k and 40k
2018
35311
2019
34737
2019
35040
Total average
35003
It can be seen that the production averages using
the separation by class have less variation than the other
averages and sets of values. This represents a more
uniform process, excluding shifts that were outside the
normal process pattern.
The OEE will be calculated according to the
averages of the shifts per year, and before the collection of
the interval that was analyzed: shifts that produced more
than 30k and less than 40k.
The values obtained from the total shifts in 2019
were 75.6% productivity, 99.8% quality and 85.2%
availability. In 2020, 73.5% productivity, 99.9% quality
and 89% availability. The analysis found an evolution in
availability, which is a result of improvements and
www.ijaers.com
machine failures that were fixed; in contrast, there was a
decrease in productivity.
This can be explained by the increase in
production time, process failures and micro-stops have
become more frequent, directly impacting the productivity
indicator.
Micro-stops (less than 10 minutes) are not
included in lost time that affects availability. These microstops affect the productivity indicator. This is the
beginning of the comparison of the OEE and the good
production volume. Considering the range with output of
more than 30k and less than 40k, we have:
●Operation time = 359 minutes
●Planned Production Time = 385 minutes
●Good production = 35040 products
●Total production (shavers) = 35076 products
●Theoretical production (shavers)
= 47372
products
Considering these averages in a 480-minute shift:
Production loss (Planned Production - Good
Production) is 12332 products; the machine downtime
(Planned Production Time - Operation Time) is 26
minutes. These 12332 shavers represent, in terms of time,
132 parts per minute produced by the machine; dividing
these numbers 12332/132, the result is 93 minutes.
During the shift, the work process has 93 minutes
of micro-stops; this represents the losses and downtime
inherent to the process, and which do not directly affect
availability, but rather productivity.
Considering the target of producing 40,000
products, and the Theoretical Production Average, the
machine will have a loss of 7372 shavers, which represents
55 minutes.
Calculations proved that the nominal target does
not represent the actual machine operation process, as the
number of shifts that reached the target is 17%, which does
not represent even half of the total shifts. The total average
is that of 2020 compared to the nominal target, with a
difference of almost 8 thousand, that is, 1/3 of the achieved
value. It would take 33% more productivity to reach the
goal; analyzing the machine history, this number cannot be
reached.
The average between 30k and 40k represents the
process better, due to the characteristics of the machines
and the statistic calculation as well. As stated by [9], the
choice of intervals is arbitrary and the researcher’s
familiarity with the data is what will suggest how many
and which classes (intervals) should be used. However, it
Page | 216
Antonio Almeida Ferreira et al.
International Journal of Advanced Engineering Research and Science, 8(6)-2021
should be noted that a low number of classes can mean
loss of information, and with a high number of classes, the
objective of summarizing data is impaired.
[3]
Based on the OEE, and simulating a production
shift, 55 minutes is the maximum time of micro-stops to
meet the real production volume target equal to 40000.
This value assumes that quality and availability will be
100%, which represents 79% of productivity and,
consequently, of the overall equipment effectiveness.
The time for loading the raw material into the
machine, calculated based on the averages, and taking into
account good working conditions, will be at least 28
minutes, as in a shift that has good output numbers, the
plastic packages are refilled four times. If the machine is in
good working order, it will take 30 minutes to adjust it.
Just the time for reloading and adjusting the raw materials
already reaches the maximum downtime minutes to reach
the established target.
According to [4], it is of paramount importance to
concatenate the numerical values with the interpretation of
OEE data. These values must be considered by
management in order to understand the real production
scenario.
The analysis of the volume production history and the
packaging production process was shown. The calculation,
reducing the number of shifts to the total average,
considering shifts that produced more than 30k and less
than 40k, results in a new average: 35k.
IV.
CONCLUSION
Considering the overall process, the number of 35,000
was proven to be the actual and current capacity of the
packaging machine. To gain efficiency and, consequently,
increase productivity, it is necessary to tackle problems
and improve the engineering of the packaging machine,
enabling it to work with lower loss values. Stipulating
40,000 as a production target is not consistent with the real
numbers, as it is reached few times, which causes
frustration and poor representation of productivity.
[4]
[5]
[6]
[7]
[8]
[9]
[10]
[11]
Nacional de Engenharia de Produỗóo. Curitiba: ABEPRO.
2014.In Oxford reference online premium dictionary.
Retrieved from
RODRIGUES, J. B. M.; CABRAL, A. C. D. Use of
packing equipment efficiency as an estimate of the overall
plant effectiveness and as a tool to improve financial results
of a food - processing unit. Brazilian Journal of Food
Technology, 20, e2016068. Epub June 08, 2017.
Clerk Maxwell
(1892), A TreatiseonElectricity and Magnetism, 3rd ed.,
vol. 2. Oxford: Clarendon, pp.68–73.
BUSSO, C. M.; MIYAKE, D. I. Análise da aplicaỗóo de
indicadores
alternativos
ao
Overall
Equipment
Effectiveness (OEE) na gestóo do desempenho global de
uma fỏbrica. Prod. São Paulo, v. 23, n. 2, p. 205-225, junho
2013. < sci_arttext
& pid=S0103-65132013000200001 & lng= en\ nrm=iso>.
Retrieved in May 19, 2021. Epub Oct 02, 2012.
/>Elissa, “Title of paperifknown,” unpublished.
PEREIRA, M. A. T.; PEREIRA, P. J. Estatística Aplicada à
Engenharia. São Paulo: Notas de Aula, 2018.
POMORSKI,
T.
Managing
Overall
Equipment
Effectiveness [OEE] to optimize factory performance. In:
IEEE
INTERNATIONAL
SYMPOSIUM
ON
SEMICONDUCTOR
MANUFACTURING
CONFERENCE, 1997, San Francisco. Proceedings...
Eindhoven:
IEEE,
p.
33-36.
1997.
/>PASQUINI, N. C. Planejamento e controle da produỗóo
(PCP): estado da arte. Revista Tecnolúgica da Fatec
Americana,
Americana.
v.3,
n.2,
p.81-97,
set.2015/mar.2016.
Available
from
< />AM/article/view/55/64>. Access in May 23, 2021.
LEVINE, S.;KREHBIEL,B. - Traduỗóo de Tereza Cristina
Padilha de Souza. Estatớstica: Teoria e Aplicaỗừes (5a ed.).
Livros Tộcnicos e Cientớficos Editora S.A. 2008.
MORETTIN, P. A.; BUSSAB, W. de Oliveira. Estatística
Básica. 6. ed. São Paulo: Saraiva, 540 p. 2010.
MONTGOMERY, D.C.; RUNGER, G.C. Estatística
Aplicada e Probabilidade para Engenheiros. Rio de Janeiro:
Livros Técnicos e Científicos Editora S.A., 2012.
CASTANHEIRA, N. P. Estatística: aplicada a todos os
níveis. 5. ed. Curitiba: Ibpex, 2012.
REFERENCES
[1] PEINADO, J.; GRAEML, A. R. Administraỗóo da
Produỗóo: operaỗừes industriais e de serviỗos. Curitiba:
UnicenP, 2007.Perfect, T. J., & Schwartz, B. L. (Eds.).
2002.
Applied
metacognitionRetrieved
from
/>[2] STORTTE, J. M. C.; ZAFRA, F. M.; SILVA, D. C.;
DETREGIACHI, E.; ZACHI, J. Mallia. Aplicaỗóo do
indicador OEE como ferramenta para aumento da
eficiờncia em uma caldeira. In Anais do XXXIV Encontro
www.ijaers.com
Page | 217