An integrated and quantitative vulnerability assessment for proactive hazard response and sustainability a case study on the chan may lang co gulf area, central vietnam
Bạn đang xem bản rút gọn của tài liệu. Xem và tải ngay bản đầy đủ của tài liệu tại đây (298 KB, 11 trang )
Sustain Sci
DOI 10.1007/s11625-013-0221-9
CASE REPORT
An integrated and quantitative vulnerability assessment
for proactive hazard response and sustainability: a case study
on the Chan May-Lang Co Gulf area, Central Vietnam
Mai Trong Nhuan • Le Thi Thu Hien •
Nguyen Thi Hoang Ha • Nguyen Thi Hong Hue
Tran Dang Quy
•
Received: 5 December 2012 / Accepted: 27 May 2013
Ó Springer Japan 2013
Abstract A natural factors-based approach was developed to examine proactive responses to hazards and
improving sustainability on the Chan May-Lang Co Gulf
area, Central Vietnam. The approach was based on a
weight-of-evidence method within an integrated and
quantitative vulnerability assessment in which the spatial
relationship between a set of evidential factors (lithology,
distance to the coastline, altitude, slope, aspect, drainage,
wind speed during storms, and land use and cover) and a
set of hazard locations was combined with the prior
probability (total vulnerability) to obtain the posterior
probability of hazard occurrence. The result showed that
44.3 % of the study area had high to very high total vulnerability, due to the high density of vulnerable objects and
frequency of severe damage from typhoons, floods, landslides, and erosion. The result also demonstrated that the
contribution of natural factors was directly proportional to
total vulnerability in approximately 75 % of the study area,
indicating a high dependence of vulnerability on natural
factors. In the remaining areas, low contributions were
found in the high and very high vulnerability areas dominated by high anthropogenic activities. In contrast, natural
Handled by Soontak Lee, Yeungnam University, Korea.
M. T. Nhuan (&) Á N. T. H. Ha Á T. D. Quy
Department of Geo-environment, VNU University of Science,
334 Nguyen Trai, Thanh Xuan, Hanoi, Vietnam
e-mail:
L. T. T. Hien
Institute of Geography, Vietnam Academy of Science
and Technology, Hanoi, Vietnam
N. T. H. Hue
VNU Sea and Islands Research Centre, Vietnam National
University, Hanoi, Vietnam
factors were important contributors to total vulnerability in
areas characterized by dense vegetation, consolidated
rocks, and altitude greater than 300 m, reflecting high
natural resilience. The present study demonstrated that a
proactive approach may provide appropriate measures to
mitigate hazards and to increase the sustainability of the
study area.
Keywords Chan May-Lang Co gulf area Á Hazard Á
Proactive response Á Sustainability Á Vulnerability
assessment Á Weight of evidence
Introduction
The Vietnam coastal zone plays an important role in socioeconomic development, territorial sovereignty protection,
and maintenance of biodiversity in Vietnam. However, this
region is vulnerable to natural hazards (e.g. typhoons,
floods, coastal erosion, salinity intrusion, and landslides)
and anthropogenic impacts (e.g. population growth,
excessive aquaculture, and overfishing). These threats have
the potential to limit sustainable development in the Vietnam coastal zone, through severe and widespread damage
to human life and property as well as degradation of natural
resources and the environment (Nhuan et al. 2011a).
Vulnerability and sustainability are two contrasting
aspects of a system, in which local vulnerability can affect
the system sustainability in a resilience framework (Eakin
and Wehbe 2009). Vulnerability is one of the central elements of dialogue in science, decision-making, and sustainability research (Turner et al. 2003). Appropriate
adaptive and preparedness planning, and mitigation measures implemented at an appropriate time help to reduce
vulnerability and the risk from potential hazards, thus
123
Sustain Sci
increasing the sustainability of a system (Winograd 2007).
Appropriate adaptation and effective mitigation of hazard
effects requires a detailed knowledge of the vulnerability of
an area to potential hazards (Cutter et al. 2000).
A number of vulnerability assessment methods have
been suggested for particular hazards, such as sea level rise
(Torresan et al. 2008), storms (Bosom and Jimenez 2011),
floods (FAO 2004; Snoussi et al. 2008), erosion (Boruff
et al. 2005), and landslides (Szlafsztein and Sterr 2007;
Uzielli et al. 2008). Recently, the importance of a multihazard approach to risk management has been emphasized
(Kappes et al. 2011). However, few studies have presented
an integrated approach to multi-hazard assessment (Cutter
et al. 2000; Kappes et al. 2011; Kumar et al. 2010; Mahendra et al. 2011; Nhuan et al. 2009, 2011a, b; NOAA
1999; Pratt et al. 2005).
Vulnerability has been assessed by qualitative, semiquantitative, and quantitative methods. Quantitative methods involve statistical, geotechnical, and artificial neural
network methods that reduce subjectivity and are more
easily reproduced. One quantitative method, a weight of
evidence model, uses evidence from previous events to
predict the probability of hazards occurring in the study
area. The relative importance of each line of evidence is
estimated by a statistical method, based on the available
data (Mathew et al. 2007). However, this model is used
primarily for vulnerability assessment of landsides, rather
than for multi-hazard environments (Barbieri and Cambuli
2009; Mathew et al. 2007).
An object-related approach creates a clear separation
between the biophysical or natural dimension and the
socio-economic dimension when assessing vulnerability
(Adger 1999; Cutter et al. 2000; Nhuan et al. 2009,
2011a, b). Almost all studies using such an approach have
performed a vulnerability assessment subsequent to hazard occurrence. Although such studies provide some
useful results, their ability to assess the adaptability of a
system and the timeliness of the response to hazards is
limited.
Natural factors such as geology, geography, hydrology
and meteorology are important components that influence
the vulnerability of a region (Birkmann 2006; Furlan et al.
2011; Marchand 2009; Nhuan et al. 2009, 2011a, b).
Determining the contribution of natural factors to vulnerability by applying the weight-of-evidence method provides a reliable base for assessing and forecasting the
vulnerability of a region. This proactive, prediction-based
approach is a fundamental requirement for outlining
appropriate strategies for community response to hazards
(Mimura 2008), hazard adaptation, and hazard mitigation.
The prospect of a proactive approach highlights the need to
conduct appropriate research on which this approach is
based.
123
The objective of the present study was to propose a new
approach for assessing and forecasting vulnerability based
on natural factors and evidence that can create proactive
responses to hazards and thus enhance sustainability.
Subsequently, the approach developed was applied to
determine the contribution of natural factors to the total
vulnerability of the Chan May-Lang Co Gulf area, Central
Vietnam. Proposed measures for hazard mitigation and
improvement of sustainability are also discussed.
Study area
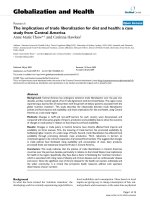
The Chan May-Lang Co Gulf area is located in Central
Vietnam (Fig. 1). It is approximately 711 km2 in area, and
is surrounded by 18 communes. There are two lagoons
(Cau Hai and An Cuu) and two gulfs (Chan May and Lang
Co), which are the most popular and important wetlands of
the Central Vietnam coastal zone. In addition, the study
area is a key economic zone in Central Vietnam, as it is on
shipping routes to northern and southern Asia. Land use in
the study area is divided between scattered forest (48.8 %),
anthropogenic construction (17.0 %), agriculture (12.1 %),
aquaculture (17.4 %), and others (4.7 %) (PLPC 2010).
The major igneous rocks are biotite granite, two-mica
granite, aplite, pegmatite, and granite (Nhuan and Tien
1993, 2011b). There are four main types of sedimentary
materials: marine–river sediments (maQ32), lagoon sediments (bmQ32), and two types of marine sediments (mQ1–2
2
and mQ32). The sediments are composed primarily of sand,
sand–mud, mud–sand, mud, mud–clay, and clay. The
geomorphology is typically characterized by erosion–
denudation relief in the mountain area, and mixed depositional relief of alluvium, deluvium, and proluvium in the
coastal plain.
The study area is located within a distinct monsoon
climate zone, with a rainy season from August to January,
and a dry season from February to July. Annual average
rainfall level is 2,800 mm and the annual average temperature is 25 °C. The average annual wind speed and
maximum wind speed are 1.5 and approximately 40 m/s,
respectively. The prevailing wind directions are northwest
in winter (14–34 %) and south–southwest in summer
(10–17 %).
Analysis of historical data shows that typhoons, landslides, floods, and erosion are the most frequently occurring
hazards and cause the most severe damage (MONRE
2008). Annually, there are 4–5 typhoons and tropical lowpressure storms, causing severe damage to property and
loss of human lives (MONRE 2008). For example,
Typhoon Tilda struck the Lang Co region on 22 September
1964 with wind speeds of 38 m/s and a storm surge of
1.7 m (MONRE 2008). In addition, the Bach Ma mountain
chain in the southwest of the study area affects the regional
Sustain Sci
Fig. 1 Map showing the study area
rainfall regime, intensifying the occurrence of hazards. For
example, in November 1999, severe rains caused a flood
and landslides which resulted in property damage in the
3,000 m2 mountain area of the L Tien and L Vinh communes (MONRE 2008). The flood and landslide hazards
threatened 50 households, and destroyed roads and
infrastructure.
The study area is representative of the Central Vietnam
coastal zone, which is characterised by a contrast between
flat lagoons and river plains, and adjacent mountains ranges. The Central Vietnam coastal zone is experiencing
rapid economic development while facing increasing natural hazards. Therefore, an integrated quantitative vulnerability assessment for proactive responses to hazards is
crucial to the continued development of the study area and
the Central Vietnam coastal zone.
Methodology
Proactive approach
Previous vulnerability assessments and reduction measures
have used two major approaches: (1) post-event or (2) preevent. A number of vulnerability assessments have focussed on the former (e.g. Adger 1999; Snoussi et al. 2008;
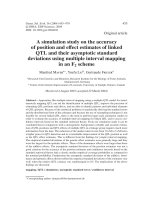
Uzielli et al. 2008). This approach, shown in Fig. 2, is
largely considered a passive response, as damage from the
event has already occurred. In contrast, a proactive
approach would provide more effective and active
responses prior to any event occurring (Fig. 2).
Analysis of natural factors in a region can provide evidence for the probability of a hazard occurring (Birkmann
2006; Furlan et al. 2011; Marchand 2009). Natural factors
that may generate, intensify, or mitigate natural hazards
include the geology, geography, hydrology, oceanography,
meteorology, and land cover in the region. For example,
landslides can often be attributed to the local geology, geomorphology, land cover, and drainage (Mathew et al. 2007).
Similarly, mean tidal range, coastal slope, rate of relative sea
level rise, shoreline erosion or accretion rates, and mean
wave height, are key indicators of erosion vulnerability
(Boruff et al. 2005). In addition, Furlan et al. (2011) revealed
that the geomorphology, geology, pedology, and vegetation
are important criteria in assessing natural vulnerability.
Vulnerability assessments of multi-hazards based on all
natural factors are extremely complex. Therefore, evidence
and damage of major hazards in the study area needs to be
assessed and weighted, thus enabling less important factors
to be disregarded. A deficiency of reliable data and information, which is a problem in developing countries such as
Vietnam, can also restrict the assessment of all natural
factors. In addition, some attribute parameters (e.g., rainfall, geodynamic features) are also disregarded due to the
paucity of spatial differentiation in the small study area.
Therefore, in this study, several major parameters have
been selected to assess the natural component of hazard
vulnerability (Table 1). This selection was based on evidence from field surveys, existing data, further data analysis, and spatial differentiation of parameters.
As shown in Fig. 2, the contribution of natural parameters to total vulnerability was calculated using the
123
Sustain Sci
Fig. 2 Formal and proactive
approaches in vulnerability
assessment
Table 1 Parameters used to
assess natural dimension
vulnerability
Natural factors
Parameters
Hazard/resilience
to hazards
Calculated methods
Geology
Lithology
Landslide, erosion
Classification of rock types based on
consolidated levels
Geography
Distance to coastline
Typhoon, erosion
Calculation for each cell the Euclidean
distance to the closest coastline
Altitude
Slope
Flood
Landslide, flood
Rank of the terrain elevation
3D analyst: interpolation of slope
Aspect
Erosion, flood,
landslide
3D analyst: interpolation of aspect
Hydrology
Drainage
Flood, landslide
Drainage density (km/km2): length of the
stream channels per calculated unit area
Meteorology
Wind speed during
storms
Typhoon, flood,
landslide
Classification of wind speed levels
corresponding to the wind in the storm
Land use and
cover
Land use and cover
Flood, landslide,
erosion
Classification of land cover and land use
patterns
weight-of-evidence method. The relative contribution of
natural parameters is assumed to be constant and is used to
estimate the total vulnerability of an area when natural
parameters change.
Total vulnerability assessment
Vulnerability is considered as the potential for loss or
damage to objects and systems from hazards (Cutter 1996;
Cutter et al. 2000; Mitchell 1989; Nhuan and Tien 2011b).
The vulnerability of natural and social systems has been
assessed using three components: danger level of hazards,
density of vulnerable objects, and resilience (Nhuan et al.
2009, 2011a). It is noteworthy that the level of probability
caused by a hazard depends on both the danger of the
hazard and the resilience of the system. For example, given
a particular probability hazard, a region of low resilience
123
will experience more damage than a region of high resilience. Damage caused by an event is considered to be a
practical and reliable method for weighting evidence in
vulnerability assessments.
In this study, the total vulnerability of the Chan MayLang Co Gulf area was evaluated using the following
components: proportion of people evacuated per year, total
economic losses, and density of vulnerable objects. Each
component was then divided into five levels based on the
damage caused by hazards (for evacuations and economic
losses) or the level of vulnerability (for density of vulnerable objects; Table 2). The number of people evacuated
and the economic losses for the period 2004–2010 were
determined from existing data and from field surveys
conducted in 2010. Vulnerable objects included humans,
natural resources, economic assets (agriculture, aquaculture, and tourism), and infrastructure (construction, roads,
Sustain Sci
Table 2 Classification of
vulnerability criteria on the
Chan May-Lang Co Gulf area
Proportion of people
evacuated per year
Value
Total economic losses
(million VND/person)
Value
Density of
vulnerable objects
Value
\1.03
1
1
1
Very low
0–1
1.04–7.32
2
1–7
2
Low
1–2
7.33–10.96
3
7–11
3
Medium
2–3
10.97–23.68
4
11–23
4
High
3–4
23.69–36.83
5
23–38
5
Very high
4–5
and houses). Analysis and calculation of total vulnerability,
as well as the contribution of natural factors, were performed using ArcGIS 10.
Weight of evidence
The weight of evidence was based on a log-linear Bayesian
model using the prior and posterior probabilities (Jeffreys
1998). The method has been used for mineral potential
mapping (Agterberg et al. 1990; Bonham-Carter et al.
1989) and landslide hazard mapping (Barbieri and Cambuli
2009; Hien 2010; Mathew et al. 2007). This approach uses
the prior probability of an occurred hazard to find the
posterior probability based on the relative contribution of
the subject by evidence. Prior and posterior probabilities of
a hazard (S), given the presence or absence of any binary
pattern (Bi or Bi ), are calculated using Eqs. 1 and 2:
PPrior ẳ PfSg ẳ
Npix Hazardị
Npix Totalị
1ị
and,
PfSjBi g ẳ
PfS \ Bi g Npix fS \ Bi g
ẳ
Npix fBi g
PfBi g
2ị
where Npix (Hazard) and Npix (Total) are the number of
pixels affected by the hazard and the total number of pixels
in the study area, respectively.
À
Positive and negative weights (wỵ
i and wi ) are developed from these conditional probabilities as defined by
Eqs. 3 and 4:
PfBi jSg
ẫ
wỵ
i ẳ loge ẩ
P Bi jS
3ị
and,
w
i
ẩ
ẫ
P Bi jS
ẫ
ẳ loge ẩ
P Bi jS
4ị
The difference between the positive and negative weights
is termed the contrast (Cw) for each parameter class and is
calculated to reflect the spatial combination between the
evidence of vulnerability and the occurrence of the hazard, as
shown in Eq. 5 (Barbieri and Cambuli 2009):
Cw ẳ wỵ
i À wi
ð5Þ
In addition, Cw/S(Cw), where S(Cw) is the standard
deviation, provides an indication of the reliability of the
relationship calculated between the hazard parameters. A
higher Cw/S(Cw) value reflects a closer relationship
between the hazard and the parameters used in the
calculation (Barbieri and Cambuli 2009).
In the present study, the spatial relationship between a
set of evidential themes and a set of hazard locations is
combined with the prior probability (total vulnerability) to
derive the posterior probability of hazard occurrence. This
enables the contribution of natural factors to total vulnerability to be calculated.
Results and discussion
Total vulnerability assessment
A total of 755 billion Vietnamese Dong (US $36 million)
was lost in the period from 2004 to 2010 as a result of
natural hazards in the study area (Table 3; PLPC 2009).
The damage from the hazards was scattered throughout the
study area. The highest economic losses occurred in several
communes in the northwest of the Chan May-Lang Co Gulf
area (L Bon, L Son, and L Dien communes). However,
more than 90 % of the populations in the L Tri, L Tien, and
L Co communes were affected by the hazards (Table 3).
More than 20 % of the populations of the L Binh, L Vinh,
V Hien, and V Hai communes were evacuated each year
(Table 3).
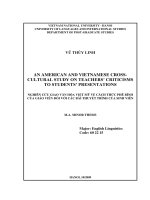
Total vulnerability is shown in Fig. 3. The vulnerability
level is classified into 5 levels: very high (4–5), high (3–4),
medium (2–3), low (1–2), and very low (0–1). These
classes account for 10.0, 34.3, 12.8, 23.8, and 19.0 % of the
Chan May-Lang Co Gulf, respectively. The result showed
that approximately 44.3 % of the study area has high to
very high vulnerability levels, encompassing the coastal
and the northwestern communes of the Chan May-Lang Co
Gulf region (Fig. 3). These regions have a high density of
vulnerable objects and frequently suffer severe damage
from typhoons (L Vinh and V Hai communes), floods
123
Sustain Sci
Table 3 Population, affected
and evacuated people, and
economic loss on the ChanLang Co Gulf area due to
natural hazards in the period
from 2004 to 2010
Source: PLPC (2009)
a
1 US dollar is equal to 20,850
VND (2012)
Population
(people)
Population
density
(people/km2)
Proportion of
people affected
per year (%)
Proportion of
people evacuated
per year (%)
Economic losses
(million VND)a
No.
Commune
1
L Bon
14,022
431
6.3
1.05
67,030
2
L Son
7,665
401
24.5
4.11
71,138
3
X Loc
2,554
58
82.6
14.15
52,713
4
L An
13,731
508
51.5
8.68
41,517
5
L Dien
16,015
139
33.4
5.55
65,056
6
L Hoa
2,804
86
44.8
7.55
48,964
7
8
P Loc
L Tri
11,372
8,894
418
141
66.2
92.7
11.09
15.36
44,666
51,867
9
L Binh
2,650
97
14.3
23.59
33,760
10
L Thuy
13,167
187
35.6
5.73
53,910
11
L Tien
9,051
158
90.5
15.13
46,754
12
L Vinh
26,569
13
L Co
14
6,872
199
22.1
38.04
12,026
114
95.5
15.95
26,704
V Hien
9,145
403
17.9
30.15
22,925
15
V Hai
2,668
433
12.8
21.37
17,343
16
V Giang
5,114
273
61.7
9.95
29,896
17
V My
6,330
779
25.8
4.30
18,115
18
V Hung
8,365
521
31.1
5.16
–
–
Total
152,445
–
36,234
755,161
Fig. 3 Map of the total
vulnerability in the period from
2004 to 2010 on the Chan MayLang Co Gulf area
(L Vinh and L Tien communes), landslides (L Tien, L Son,
X Loc, and L Vinh communes), and erosion (L Vinh and V
Hai communes). Conversely, the regions with very low and
low vulnerability levels corresponded to areas that have a
medium density of vulnerable objects, but have suffered
little damage from natural hazards.
123
Contribution of natural factors to total vulnerability
The weight of evidence is shown in Tables 4, 5, 6,
7, 8, 9, 10, 11. The weight of evidence was calculated
for various parameter classes used in the study
(Table 1).
Sustain Sci
Table 4 Weights and contrast
values for the lithology
Table 5 Weights and contrast
values for the distance to
coastline
Table 6 Weights and contrast
values for the altitude
Table 7 Weights and contrast
values for the slope
Lithology
Class
w?
Area
(square km)
w-
Contrast
(Cw)
Cw/S(Cw)
a,am: loam/sandy/pebble-gravel
1
121
0.6104
-0.1416
0.7520
40.7750
Biotite granite/binary granite
3
303
-0.6266
0.3762
-1.0027
-62.3451
Gabbro/olivine gabbro/
gabbronorite
6
25
-0.5826
0.0189
-0.6015
-13.1919
m,bm,vm: sand/calcareous sand/
coral/peat
9
30
0.7074
-0.0348
0.7422
21.9666
m,m(v): sand/calcareous sand/
coral
11
35
0.7374
-0.0429
0.7802
24.8656
Sandstone/siltstone/shale/
limestone
13
56
0.2614
-0.0236
0.2850
10.8985
Shale/sandstone/conglomerate
14
38
1.7432
-0.1123
1.8556
55.9522
Distance to coastline (km)
Class
7.6 to 12.6
1
3.6 to \7.6
1.8 to \3.6
Area (square km)
w?
w-
Contrast (Cw)
Cw/S(Cw)
57
0.3402
-0.0301
0.3704
14.8960
2
94
-0.3034
0.0448
-0.3482
-16.9047
3
206
-0.2364
0.0943
-0.3307
-21.7867
0.7 to \1.8
4
230
-0.0944
0.0446
-0.1390
-9.5261
0 to \0.7
5
125
0.6188
-0.1332
0.7520
41.5849
Area (square km)
w?
w-
Contrast (Cw)
Cw/S(Cw)
Altitude (m)
Class
\-1
1
24
0.2189
-0.0081
0.2270
5.8332
-1 to 0
2
86
-1.7433
0.1474
-1.8907
-48.9652
0 to 50
3
243
0.6277
-0.3920
1.0197
66.7701
50 to 300
4
190
0.2469
-0.0958
0.3428
21.1597
[300
5
167
-0.9700
0.2259
-1.1960
-55.5344
Slope (°)
Class
Area (square km)
0–6
1
404
w?
0.67
w-0.29
Contrast (Cw)
0.96
Cw/S(Cw)
53.18
6–12
2
61
-0.10
0.01
-0.11
-3.89
12–20
3
103
-0.82
0.07
-0.89
-29.96
20–28
4
98
-2.04
0.12
-2.12
-65.08
28–57.2
5
66
0.09
0.02
-1.45
-15.75
Lithology
Among the lithological classes, the shale–sandstone–conglomerate has the highest w? and Cw values (Table 4),
indicating that landslides and erosion could occur, resulting
in high vulnerability. In contrast, the consolidated rocks
composed of biotite granite and binary granite have the
lowest w? and Cw values.
Distance to coastline
Previous observations indicate that areas close to the coastline experience more frequent and more intense coastal
erosion. This parameter contributes significantly to vulnerability in areas located 0–0.7 km from the coastline (Table 5).
This result is in accordance with the high frequency of
typhoons and erosion and high proportion of people evacuated in the L Vinh and V Hai communes (Table 3).
Altitude
The w? and Cw values showed a positive correlation with
vulnerability at 0–50 m altitude (accounting for approximately 34 % of the study area; Table 6). It is noteworthy
that the majority of the population and infrastructure are
distributed within this altitude range. Therefore,
123
Sustain Sci
Table 8 Weights and contrast
values for the aspect
Aspect (degree according
to the north direction)
Class
Table 11 Weights and contrast
values for the land use and
cover
Contrast (Cw)
Cw/S(Cw)
1
51
-1.8068
0.0861
-1.8928
-36.9889
South (157.5–202.5)
2
51
0.3967
-0.0332
0.4299
15.9148
Southeast (112.5–157.5)
3
53
0.2227
-0.0189
0.2415
8.9205
North (337.5–360)
4
47
0.0466
-0.0034
0.0499
1.6998
North (0–22.5)
5
66
-0.0462
0.0047
-0.0510
-1.9878
Northeast (22.5–67.5)
6
123
-0.2111
0.0421
-0.2532
-12.5114
West (247.5–292.5)
7
82
0.2260
-0.0313
0.2573
11.5568
Southwest (202.5–247.5)
8
71
0.2653
-0.0315
0.2969
12.6095
9
80
-0.1468
0.0183
-0.1650
-6.9072
10
81
0.2490
-0.0342
0.2831
12.6949
Northwest (292.5–337.5)
Table 10 Weights and contrast
values for the wind speed during
storms
w-
Flat (-1)
East (67.5–112.5)
Table 9 Weights and contrast
values for the drainage
w?
Area (square km)
Drainage (km/km2)
Class
Area (square km)
w?
0–1
1
191
-0.5820
1.1–3.5
2
191
0.2861
3.6–6.5
3
112
0.5249
6.6–10
4
59
10.1–20.5
5
Wind speed during
storms (m/s)
Class
w-
Contrast (Cw)
Cw/S(Cw)
0.1804
-0.7624
-41.3772
-0.1131
0.3992
24.7497
-0.1095
0.6344
33.3181
0.5685
-0.0566
0.6252
25.0766
159
-0.4227
0.1081
-0.5308
-27.8593
Area (square km)
w?
Contrast (Cw)
Cw/S(Cw)
w-
26.0–26.6
1
65.50
1.3925
-0.1656
1.5582
63.7094
26.6–27.3
2
165.01
-0.2696
0.0758
-0.3454
-18.9945
27.3–28.0
3
480.90
-0.1311
0.2544
-0.3855
-25.0396
w?
Cw/S(Cw)
0.0780
-2.8735
-38.4400
-0.8012
0.1385
-0.9397
-46.0253
-0.1479
0.1918
-0.3398
-24.9003
113
1.3047
-0.2326
1.5374
74.0988
48
1.3077
-0.0888
1.3965
45.8469
Class
Dense forest
1
34
-2.7956
Spare forest and afforestation
2
117
Grass and bush
3
412
Agriculture/aquaculture/road
4
Human settlement
5
vulnerability is heightened due to the high density of vulnerable objects.
w-
Contrast (Cw)
Land use and cover
Area
(square km)
vulnerability. The difference between the two studies is
attributable to the high population density in areas of slope
gentler than 6° in the present study area.
Slope
Aspect
Slopes of 0°–6° were found to be a significant contributor
to landslides and other hazards (Table 7). This contradicts
the results reported by Mathew et al. (2007) that slopes
under 30° were insignificant in terms of hazard
123
The w? and Cw values are high in regions with southerly,
southeasterly, westerly, southwesterly, and northwesterly
aspects (Table 8). This pattern indicates that the prevailing
Sustain Sci
wind direction (northwest in winter and south–southwest in
summer) has a major influence on hazard vulnerability.
Drainage
Drainage significantly influences slope stability by controlling toe erosion and the saturation of slope material
(Gokceoglu and Aksoy 1996; Mathew et al. 2007). The
efficiency of the river system also controls the extent of
flooding. The intensity of hazards increased in areas where
drainage density ranged from 3.6 to 10.0 (Table 9),
resulting in increased vulnerability. This is due to the
distribution of these areas within regions of complex
topography. The distribution of high drainage density in a
relatively flat area is considered to minimize the occurrence
of flash floods in that area.
Wind
Wind speed during storms contributes significantly to
hazard intensity. The maximum wind speed in storms
occurred most frequently in classes 1–3. The highest w?
and Cw values correlated to winds of 26.0 to 26.6 m/s
(Table 10), showing that high wind speeds result in high
vulnerability. This is due to substantial storm damage in
areas of high population density and low altitude, without
adjacent mountains acting as wind barriers.
Land use and cover
Vegetation plays a crucial role in slope stability and the
regulation of surface flow. In the absence of other factors,
areas of dense vegetation should be less susceptible to
landslides and erosion than bare areas. The present results
showed that the agriculture, aquaculture, roads, and human
settlement had the highest contrast values (Table 11),
reflecting high vulnerability associated with weakly cohesive materials (Mathew et al. 2007). This result was supported by the evidence of landslides observed in the
northern L Tien, L Son, and L Vinh communes. In addition, these land uses were also classified as vulnerable
objects, consequently enhancing their vulnerability.
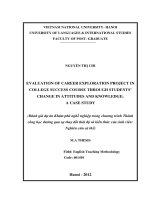
The contribution of natural factors to total vulnerability is
shown in Fig. 4 in which the negative and positive values
indicate the low and high contribution. The result showed
that the contribution of natural factors was directly proportional to total vulnerability in approximately 75 % of the
study area (Figs. 3, 4). This pattern reflected the fact that
vulnerability is highly dependent on natural factors. The
result also indicated that social resilience was so low that it
contributed little to resisting natural hazards in the study
area. Social resilience remains low as a result of an outdated
forecasting system for hazards, low community awareness of
hazards, and low income. In contrast, social resilience is an
important contributor to total vulnerability in developed
countries (Boruff et al. 2005; Cutter 1996; Harvey and
Woodroffe 2008; NOAA 1999). In the high and very high
vulnerability areas, two contrast trends of the contribution of
the natural factors to total vulnerability were found. The first
trend showed a high contribution in the L Son, L Binh,
southern L Tien, and southern L Tri communes (Figs. 3, 4).
Natural factors were dominant in regions characterized by
dense vegetation, consolidated rocks, and altitude greater
than 300 m (Fig. 4). This demonstrates the role of natural
factors in enhancing natural resilience. In contrast, natural
factors contributed little to total vulnerability in the regions
Fig. 4 Contribution of natural
factors to total vulnerability on
the Chan May-Lang Co Gulf
area
123
Sustain Sci
dominated by high anthropogenic activities such as the
northern V Hai, L Vinh, X Loc, northern L Tien, and northern
L Tri communes (Fig. 4).
The present study clearly demonstrates that natural factors
influence the resilience of both natural and socio-economic
systems. Mangrove and terrestrial forests, mountainous areas,
consolidated rocks, and distance from the coast increase natural resilience. Low elevation, unconsolidated rocks, high
wind speed, and natural hazards decrease natural resilience.
The location of vulnerable socio-economic objects in these
areas of low natural resilience results in low socio-economic
resilience. Based on this, appropriate measures for proactive
responses to hazards can be proposed to reduce this risk of
disaster, and increase the sustainability of the study area. The
results of the present study indicate that proposed measures
should aim to increase social resilience. Three groups of
solutions can be implemented to achieve this, as follows:
1.
2.
3.
Natural vulnerability assessment and forecasting-based
planning such as sustainable resource use (Adger et al.
2005); implementation of sustainable livelihood solutions (e.g. the Satoyama–Satoumi model, sustainable
economic development models, diverse agriculture,
eco-tourism, and community frameworks); locating
evacuation channels, technical infrastructure, and
social infrastructure in areas of low natural vulnerability; installation of early warning systems in highvulnerability areas; and ensuring that vulnerable
communities have access to emergency health services, safe havens, and evacuation channels.
Management strategies, such as creating and implementing proactive policies for responses to natural
hazards; and enhancing sustainability, adaptive management of wetlands, integrated community-based
coastal zone management (Nunn and Mimura 2007)
and integrated mountainous area management.
Hazard mitigation plans, policies, and measures based
on the results of the present study such as installation
of updated early warning systems, policies for proactive mitigation of hazards, afforestation and reforestation of mangrove areas, construction of coastal
protection structures, and maintenance of the natural
sediment balance (Winchester et al. 2007). In addition,
community awareness and education campaigns, regular training, and guidance materials should be implemented with reference to natural hazards, disasters,
and factors contributing to vulnerability.
Conclusions
Eight natural parameters (lithology, distance to coastline,
altitude, slope, aspect, drainage, storm wind speed, and
123
land use and cover) were used to evaluate the influence of
natural factors on total vulnerability. The contribution of
natural factors was directly proportional to total vulnerability in approximately 75 % of the study area. This result
indicated that the vulnerability was highly dependent on
natural factors. In contrast, low contribution was found in
the high and very high vulnerability areas dominated by
high anthropogenic activities.
The results of this study highlight the need for increasing resilience and sustainability of natural and socio-economic systems by implementing management practices,
sustainable resource use planning, and proactive hazard
mitigation measures. Future research should focus on
forecasting and verifying vulnerability based on natural
and socio-economic factors. Using a proactive approach to
hazard response will help to increase the resilience and
sustainability of important ecosystems such as coastal
waters, marine ecosystems, and mangrove and terrestrial
forests.
Acknowledgments This research was supported by the Vietnam’s
National Foundation for Science and Technology Development
(NAFOSTED) (No. 105.09.82.09). The authors gratefully acknowledge the People’s Committee of Phu Loc District, Thua Thien Hue
Province (Vietnam), the VAST Institute of Marine Resources and
Environment for their help with data collection.
References
Adger WN (1999) Social vulnerability to climate change and
extremes in coastal Vietnam. World Dev 27(2):249–269
Adger WN, Arnell NW, Tompkins EL (2005) Successful adaptation
to climate change across scales. Global Environ Chang 15:77–86
Agterberg FP, Bonham-Carter GF, Wright DF (1990) Statistical pattern
integration for mineral exploration: In: Gaal G, Merriam DF (eds)
Computer applications in resource estimation: predictions and
assessment for metals and petroleum, Pergamon, Oxford, pp 1–21
Barbieri G, Cambuli P (2009) The weight of evidence statistical
method in landslide susceptibility mapping of the Rio Pardu
Valley (Sardinia, Italy). 18th World IMACS/MODSIM Congress, Cairns, Australia, 13–17 July
Birkmann J (2006) Measuring vulnerability to natural hazards:
towards disaster resilient societies. United Nations University
Press, Tokyo
Bonham-Carter GF, Agterberg FP, Wright DF (1989) Weights of
evidence modeling: a new approach to mapping mineral
potential. In: Agterberg FP, Bonham-Carter GF (eds) Statistical
applications in the earth sciences, Canadian Government Publishing Centre, pp 171–183
Boruff BJ, Emrich C, Cutter SL (2005) Erosion hazard vulnerability
of US coastal counties. J Coastal Res 21(5):932–942
Bosom E, Jimenez JA (2011) Probabilistic coastal vulnerability
assessment to storms at regional scale—application to Catalan
Beaches (NW Meditrrranean). Nat Hazard Earth Sys 11:475–484
Cutter SL (1996) Vulnerability to environmental hazards. Prog Hum
Geog 20:529–539
Cutter SL, Mitchell JT, Scott MS (2000) Revealing the vulnerability
of people and places: a case study of Georgetown County, South
Carolina. Ann Assoc Am Geogr 90(4):713–737
Sustain Sci
Eakin HC, Wehbe MB (2009) Linking local vulnerability to system
sustainability in a resilience framework: two cases from Latin
America. Climatic Change 93:355–377
FAO (2004) Food insecurity and vulnerability in Viet Nam: profiles
of four vulnerable groups. ESA Working paper No. 04–11.
Available at />00.pdf (Accessed 10 April 2012)
Furlan A, Bonotto DM, Gumiere SJ (2011) Development of
environmental and natural vulnerability maps for Brazilian
coastal at Sa˜o Sebastia˜o in Sa˜o Paulo State. Environ Earth Sci
64:659–669
Gokceoglu C, Aksoy H (1996) Landslide susceptibility mapping of
the slopes in the residual soils of the Mengen region (Turkey) by
deterministic stability analyses and image process techniques.
Eng Geol 44:147–161
Harvey N, Woodroffe C (2008) Australian approaches to coastal
vulnerability assessment. Sustain Sci 3(1):67–87
Hien LTT (2010) Measurement of effected factors on landslide in Ho
Chi Minh road by using weight evidence model and GIS.
Proceedings of International Symposium on GeoInformatics for
spatial-infrastructure development in Earth and Allied Sciences.
Hanoi, Vietnam, pp 9–11
Jeffreys H (1998) Theory of probability (Oxford Classic Texts in the
Physical Sciences). Oxford University Press, Oxford
Kappes MS, Papathoma-Kohle M, Keiler M (2011) Assessing
physical vulnerability for multi-hazards using an indicator-based
methodology. Appl Geogr 32:577–590
Kumar TS, Nayak S, Radhaksirhnan K, Sahu KC (2010) Coastal
vulnerability assessment for Drissa Stote, East coast of India.
J Coastal Res 26(3):523–534
Mahendra RS, Mohanty PC, Bisoyi H, Kumar TS, Nayak S (2011)
Assessment and management of coastal multi-hazard vulnerability along the Cuddalore–Villupuram, east coast of India using
geospatial techniques. Ocean Coast Manage 54(4):302–311
Marchand M (2009) Modeling coastal vulnerability: design and
evaluation of a vulnerability model for tropical storms and
floods. IOS, Amsterdam
Mathew J, Jha VK, Rawat GS (2007) Weights of evidence modeling
for landslide hazard zonation mapping in part of Bhagirathi
valley, Uttarakhand. Curr Sci 92(5):628–636
Mimura N (2008) Asia-pacific coasts and their management: states of
environment (coastal systems and continental margins).
Springer, Dordrecht
Mitchell JK (1989) Hazards research. In: Gaile G, Willmott C (eds)
Geography in America. Merrill, Columbus, pp 410–424
MONRE (Ministry of Natural Resources and Environment) (2008)
Climate change impacts in Huong River basin and adaptation in
its coastal district Phu Vang, Thua Thien Hue province.
Available at: />Vietnam/NCAP.VN.CON-01.FinalReport.final.pdf (Accessed 4
October 2011)
Nhuan MT, Tien DM (1993). Assessing environmental status of Hai
Van–Deo Ngang coastal zone (0–30 m water deep). Technical
report. General Department of Geology and Minerals of
Vietnam. In Vietnamese
Nhuan MT, Tien DM (2011b) Investigating and assessing vulnerability of natural resources and environment in Vietnam coastal
and marine areas, proposing solutions for sustainable management (in Vietnamese). Technical report. Vietnam Ministry of
Natural Resources and Environment.
Nhuan MT, Ngoc NTM, Huong NQ, Hue NTH, Tue NT, Ngoc PB
(2009) Assessment of Vietnam coastal wetland vulnerability for
sustainable use (case study in Xuanthuy Ramsar site, Namdinh
province). Wetl Ecol 2:1–16
Nhuan MT, Ha NTH, Quy TD, Hue NTH, Hien LTT (2011)
Integrated vulnerability assessment of natural resources and
environment for sustainable development of Vietnam coastal
zone. VNU J Sci 27(1S):114–124
NOAA (National Oceanic and Atmospheric Administration) (1999)
Community Vulnerability Assessment Tool CD—ROOM.
NOAA Coastal Services Center. Available online at: http://
www.csc.noaa.gov/digitalcoast/training/roadmap/index.html
(Accessed 28 May 2000)
Nunn P, Mimura N (2007) Promoting sustainability on vulnerable
island coast: a case study smaller Pacific islands. In: McFadden
L, Nicholls RJ, Penning-Rowsell E (eds) Managing coastal
vulnerability. Emerald, Tokyo, pp 195–222
PLPC (People’s Committee of Phu Loc District) (2009) Statistical
yearbook
PLPC (People’s Committee of Phu Loc District) (2010) Land-use
status in 2010
Pratt CR, Kaly UL, Mitchell J (2005) How to use the environmental
vulnerability index (EVI). SOPAC Technical Report 383, United
Nations Environment Programme
Snoussi M, Ouchani T, Niazi S (2008) Vulnerability assessment of the
impact of sea-level rise and flooding on the Moroccan coast: the
case study of the Mediterranean eastern zone. Estuar Coast Shelf
Sci 77:206–213
Szlafsztein C, Sterr H (2007) A GIS-based vulnerability assessment of
coastal natural hazards, state of Para´, Brazil. J Coast Conservat
11(1):53–66
Torresan S, Critto A, Dalla Valle M, Harvey N, Marcomini A (2008)
Assessing coastal vulnerability to climate change: comparing
segmentation at global and regional scales. Sustain Sci 3:45–65
Turner BL II, Kasperson RE, Matson PA, McCarthy JJ, Corell RW,
Christensen L, Eckley N, Kasperson JX, Luers A, Martello ML,
Polsky C, Pulsipher A, Schiller A (2003) A framework for
vulnerability analysis in sustainability science. Proc Natl Acad
Sci USA 100(14):8074–8079
Uzielli M, Nadim F, Lacasse S, Kaynia AM (2008) A conceptual
framework for quantitative estimation of physical vulnerability
to landslides. Eng Geol 102:251–256
Winchester P, Marchand M, Penning-Rowesell E (2007) Promoting
sustainable resilience in Coastal Andhra Pradesh. In: McFadden
L, Nicholls RJ, Penning-Rowsell E (eds) Managing coastal
vulnerability. Emerald, Tokyo, pp 159–176
Winograd M (2007) Sustainability and vulnerability indicators for
decision making lessons learned from Honduras. Int J Sustain
Develop 10(1/2):93–105
123