Mapping land cover using multi temporal sentinel 1a data a case study in hanoi
Bạn đang xem bản rút gọn của tài liệu. Xem và tải ngay bản đầy đủ của tài liệu tại đây (899.19 KB, 15 trang )
Vietnam Journal of Earth Sciences, 39(4), 345-359, DOI: 10.15625/0866-7187/39/4/10730
Vietnam Academy of Science and Technology
(VAST)
Vietnam Journal of Earth Sciences
/>
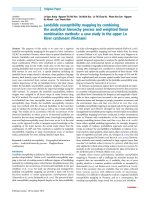
Mapping land cover using multi-temporal sentinel-1A
data: A case study in Hanoi
Le Minh Hang*1, Vu Van Truong1, Nguyen Dinh Duong2 , Tran Anh Tuan 3
1
Military Technical Academy, 236 Hoang Quoc Viet street, Cau Giay, Hanoi, Vietnam
Institute of Geography (VAST), Hanoi, Vietnam
3
Institute of Ecology and Biological Resources (VAST), Hanoi, Vietnam
2
Received 22 November 2016. Accepted 01 September 2017
ABSTRACT
Land cover mapping is one of the most important applications of both optical and microwave remote sensing. The
optical remote sensing recognizes land cover objects using spectral reflectance of the material constituting the land
cover. The microwave remote sensing recognizes ground objects using backscatter, of which the intensity depends on
the roughness of the ground’s surface. Therefore, the multi temporal SAR images owning a lot of phenology information of land cover are the potential ideal data source for land cover mapping, in particular in the urban area. In this
article, the authors present a new approach to the classification of land cover by using multi-temporal Sentinel-1A
data. The experience data are single-pole (VV) in Interferometric Wide Swath mode (IW) collected from December
2014 to October 2015 along descending orbit over Hanoi, Vietnam. Decision tree method is applied base on analyzing threshold of standard deviation, mean backscatter value of land cover patterns, and combining double-crop rice
classification image. The double-crop rice image is classified by rice phenology using multi-temporal Sentinel-1A
images. The threshold in decision tree method is analyzed by field surveying data. The resulting classified image has
been assessed using the test points in high-resolution images of Google Earth and field data. The accuracy of proposed method achieved 84.7%.
Keywords: Multi-temporal SAR images; Land cover; Sentinel-1A; Decision tree classification.
©2017 Vietnam Academy of Science and Technology
1. Introduction1
According to FAO (Food and Agriculture
Organization of the United Nations), land
cover is the observed as biophysical cover on
the Earth's surface. Land cover, conventionally, is mapped by using satellite imagery, aerial
photo, field survey, or the combination of
these data.
*
Corresponding author, Email:
Optical satellite imagery plays an important part in mapping land cover. Recognition of the land cover is based on spectral reflectance characteristics of land cover categories (Abdalla and Abdulaziz, 2012; Nguyen
Dinh Duong et al., 2014; Li et al., 2004) or
NDVI time series (Lambin et al., 1999;
Myneni et al., 1995). However, optical imagery has many disadvantages due to weather
condition and cloudiness. This is apparent
345
Le Minh Hang, et al./Vietnam Journal of Earth Sciences 39 (2017)
truth for countries in the tropical region including Vietnam. The highest expectancy of
cloud-free observation could be just one or
two times per year only. It is difficult to extract land cover objects, particularly cultivated
land if we use only one or two observations.
Therefore, agricultural cultivation with harvest interval of three months cannot be detected sufficiently using such infrequent optical
imagery.
In recent years, microwave remote sensing
technology has been intensively used for monitoring natural resources. Many studies have
indicated the correlation between radar
backscatter and the different land cover types
(Björn, 2009; Thiel et al., 2009) or agricultural land (Nguyen Ba Duy et al., 2015). For example, (Nguyen Ba Duy et al., 2015) extracted rice region of the Mekong Delta by using
decision tree method with accuracy 92%...
The broad use of the former SAR systems
was, however, quite limited due to high cost
and low temporal resolution. The new SAR
system as Sentinel-1A provides polarimetric
data in high spatial and temporal resolution
for allowing land cover mapping with a quite
high accuracy up to 93.28% (Abdikan, 2016;
Heiko, 2015; Wagner et al., 2012).
The Sentinel-1A, a European radar imaging satellite, was launched in 2014. The satellite was developed for the specific needs of
the Copernicus program in collaboration with
European Commission (EC) and European
Space Agency (ESA). Sentinel-1A satellite
provides SAR images in band C. The system
operates in four observation modes offering
medium and high spatial resolution data (up to
5 m) in a swath up to 400 km. Sentinel-1A data has two polarizations such as VV and VH
and repeated observation cycle of 12 days.
The data is public free.
346
In this paper, the authors used multitemporal Sentinel 1A data to map land cover
in Hanoi city. Using means and standard deviations computed from the one-year multitemporal Sentinel 1A data helps us to find out
phenology patterns for major land cover categories in the study area. By combining the
phenology patterns and thresholds of mean
backscatter values of major land cover types
and applying decision-tree method, we succeed to develop automatically land cover map
with detail cropland and developed land distribution.
2. Study area and data used
The study area is located in Hanoi city in
the North Vietnam. Hanoi is situated between
20°53' to 21°23' North latitude and 105°44' to
106°02' East longitude (Figure 1). The Red
River, a major river, flows through Hanoi.
The main topography of Hanoi includes delta
and hills. Hanoi has the humid and tropical
climate.
Hanoi was chosen as the study area because it has enough dynamics to achieve the
goals of this research. Moreover, Hanoi is a
challenging area regarding land cover changes
(urban sprawl). The cultivated land is being
changed to developed land. Some parts of the
cultivated land are not used and changed to
barren land. In addition, the land cover of Hanoi is complex, it has many types such as developed land, barren land, cultivated land,
forest land, water, and wetland…
In this study, the Sentinel-1A data in observation mode Interferometric Wide Swath
(IW) with single VV polarization, acquired in
a period from December 2014 to October
2015 has been used. Detail characteristics of
the used data are shown in Table 1.
Vietnam Journal of Earth Sciences, 39(3), 345-359
Figure 1. Location of study area
Table 1. Multi-temporal Sentinel-1A experiment data
Specifications
Sentinel-1A experiment data
Acquisition time
13/12/2014; 06/01/2015; 23/02/2015; 19/03/2015; 12/04/2015
30/05/2015; 23/06/2015; 17/07/2015; 03/09/2015; 21/10/2015
Acquisition orbit
Ascending
Imaging Mode
IW (Interferometry Wide Mode)
Imaging frequency
C-band (5.46 Hz)
Polarization
single VV polarization
Data product
Level-1 GRD (Ground Range Detected)
Resolution mode
10 × 10 m
Bit depth
16 bit
3. Methods
3.1. Pre-processing
The SAR data are preprocessed by the
open source software SNAP Toolbox which is
provided by the European Space Agency. Preprocessing of Sentinle-1A images consists of
radiometric calibration, geocoding. The geocoding step involves a Range Doppler Terrain correction processing that uses the elevation data from the 3 arc-second DEM products
from the Shuttle Radar Topography Mission
(SRTM) provided by ESA. In this process, data are resampled and geocoded to a grid of
10m spacing to preserve the 20 m × 5 m spatial resolution according to the NYQuist sampling thermo (Nguyen Ba Duy et al, 2015).
The pre-processing includes three main
teps such as (1) Backscatter normalization
to sigma-naught (°) of intensity band; (2)
Resampled and geo-coded by DEM product
and (3) Convert linear to/from dB (Figure 2).
347
Le Minh Hang, et al./Vietnam Journal of Earth Sciences 39 (2017)
Image No1
Image No2
….
Image No n
Radiometric Calibration
Sigma naught (°) intensity band
DEM product
SRTM
Terrain Correction
- UTM/WGS 84
- Resolution: 10 × 10 m
Convert linear to dB
True
Save to file
i ≤ number of images
False
Stop pre-processing
Figure 2. Pre-processing flowchart of multi temporal Sentinel-1A data
According to the theory of SAR image
processing, the backscatter signal is not only
influenced by the characteristics of land cover
but also incidence angle. In order to extract
the changed of land cover objects by
backscatter values, it is necessary to adjust the
effect of incidence angle by normalizing all
acquisition to a common incidence angle by
which intensity value is converted to sigma
naught (°). This is described in Daniel Sabel’s paper (Daniel et al, 2012). In this SNAP
toolbox, the objective of SAR calibration output scaling applied by the processor must be
undone and the desired scaling must be ap348
plied. Level-1 products provide four calibrations Look Up Tables (LUTs) to produce °.
The LUTs apply a range-dependent gain including the absolute calibration constant. For
GRD products, a constant offset is also applied. The radiometric calibration is applied
by the following Eq (1):
i0
DN i
Ai2
2
(1)
where: DNi-depending on the selected LUT,
Ai - beta-naught value (i). Bi-linear interpolation is used for any pixels that fall between
points in the LUTs.
Vietnam Journal of Earth Sciences, 39(3), 345-359
After normalized radar cross section, the
data needs to be converted to dB by SNAP
Toolbox. Figure 3b shows the backscatter
value in the cross section of the preprocessed
image which was acquired on 13/12/2014. In
Figure 3b the backscatter of the near and far
range is balanced. It is proved that the
backscatter value of the preprocessed image is
unaffected by the incident angle.
Another while, the stability backscatter of
pre-processed multi-temporal images is evaluated by maximum, minimum, average and
standard deviation values of overall the study
area (Table 2).
(b)
(a)
Figure 3. (a) Rotated Sentinel-1A image acquired on 13/12/2014 to azimuth;
(b) Backscatter value in cross section at line 7712 of the pre-processed image
Table 2. Stability of backscatter value of pre-processed Sentinel-1A images
Acquisition date
Minimum value
Maximum value
Average Value
Standard deviation
13/12/2014
-31.650
34.861
-4.491
5.586
06/01/2015
-29.671
35.580
-4.787
5.958
23/02/2015
-31.517
34.747
-4.789
5.964
19/03/2015
-29.661
36.022
-3.941
4.988
12/04/2015
-31.021
35.855
-3.862
4.967
30/05/2015
-30.287
35.424
-3.873
5.015
23/06/2015
-30.851
35.844
-4.278
5.547
17/07/2015
-30.371
36.358
-3.897
4.998
03/09/2015
-30.839
35.353
-3.763
4.976
21/10/2015
-30.530
35.259
-3.814
4.970
3.2. Fieldwork
In this study, the authors sampled a total of
48 field sites by using the Locus map software
on March 16, 2015 and December 22, 2014
(Figure 17b). Locus map software, an Android
application, is capable of locating GPS loca-
tions, collecting photos and recording tracks.
The types of land cover objects in the study
area consist of cultivated land, evergreen forest land, double-cropped rice land, barren
land, fruit trees, developed land in urban and
rural, water (rivers and lakes), wetland and
trees in urban area (Figures 4-7).
349
Le Minh Hang, et al./Vietnam Journal of Earth Sciences 39 (2017)
(a)
(b)
Figure 4. (a) Wetland in the Western Hanoi (16/03/2015); (b) High building (22/12/2014)
(a)
(b)
Figure 5. (a) Trees in urban area at Vietnam National Convention Center;
(B) Trees on Thang Long Highway (22/12/2014)
(a)
350
Figure 6. (a) Double-cropped rice fields in Dan Phuong, Ha Tay (22/12/2014);
(B) Double-cropped rice fields in Dan Phuong, Ha Tay (16/03/2015)
(b)
Vietnam Journal of Earth Sciences, 39(3), 345-359
(a)
(b)
Figure 7. (a) Barren land in the city; (b) Difference type of crop is grown in paddy field (22/12/2014)
3.3. Determining the phenology patterns
3.3.1. Analysis of SAR backscatter for landcover types
Changed/unchanged patterns:
Analyzing multi-temporal SAR images
(from December 2014 to October 2015), land
cover patterns can be divided into two main
groups: (i) Changed land-cover patterns (patterns have changed during the timeframe of
the study) and (ii) Unchanged land-cover patterns (patterns have not changed or changed
little during the timeframe of the study).
The major changed patterns include cultivated land (for example double-cropped rice,
other croplands) and wetland in the Western
Hanoi because of changing the purpose of
land use. The unchanged patterns are developed land, forest land, water and barren land.
In which, forest pattern, in this study, is defined as trees in urban, evergreen forest and
fruit-trees. As along river or lake, backscatter
coefficient is sometimes higher than mean
value because of moving of ships, boats,...
Figure 8 displays the RGB composite image of Sentinel-1A in three observation times.
The different color in the composite image
represents for different types of land cover.
The white or black colors in RGB image are
unchanged patterns because of stability of
backscatter value in time-series image (Figure
8a). On the other hand, the color shades in
RGB image are changed patterns because of
having difference backscatter signal of each
pixel in time-series (Figure 8b). To separate
changed and unchanged land cover categories,
we use mean and standard deviation of temporal backscatter. Standard deviation value is
determined by the Eq. (2):
2 2
1 n
(2)
std i
xi x
1
n
i 1
where: std i is standard deviation value of
multi-temporal image; xi is backscatter value
of one pixel in each time; x is mean backscat1
ter value of the multi-temporal image.
Averaged backscatter value of land-cover
patterns:
Figure 9 and Figure 10 show the variation
of the backscatter value of each land cover object in the time frame of the study. In Figure
9, backscatter value of developed land in urban has the highest values ranging from
+15dB to +20dB, developed land in rural has
the lower value than in urban from +5dB to
+10dB. By contrast, backscatter of water has
the lowest value, ranging from -20dB to -5dB
and forest land has the value from -10dB to 5dB. Backscatter of barren land has the same
value as forest land.
351
Le Minh Hang, et al./Vietnam Journal of Earth Sciences 39 (2017)
RGB = R ( 30/01/2015): G (19/3/2015): B (23/06/2015)
Figure 8. Color composite using temporal Sentinel-1 data (a) The unchanged patterns shown in black and white;
(b) The changed patterns shown in different color shades
Figure 9. The backscatter value of barren land, water, developed land and
forest on multi-temporal Sentinel-1A images
352
Vietnam Journal of Earth Sciences, 39(3), 345-359
Figure 10. Backscatter value of double-cropped rice, other croplands and
wetland on multi-temporal Sentinel-1A images
Figure11 shows that the standard deviation
values of unchanged patterns (such as water,
developed land in urban, developed land in
rural, barren land, forest) are less than value
+2.85dB. By contrast, the standard deviation
values of changed patterns (such as doublecropped rice, wetland, the other's cropland)
are greater than +2.85dB. Besides, with patterns having the same standard deviation values (such as water and developed land) we
can use the mean backscatter value to discriminate them. For example, mean backscatter of
water is -7.586dB whereas the value for developed land in urban is +16.558dB. Therefore, we can extract water and developed land
by using simultaneously both thresholds of
standard deviation and mean backscatter value
simultaneously. As a result, by combining the
standard deviation and mean backscatter values of multi temporal SAR data, we can extract different land cover objects. However,
Figure 10 and Figure 11 show that it is difficult to discriminate between rice and the others cropland by mean backscatter or standard
deviation value because of having the same
texture surface information.
Double-cropped rice phenology by multitemporal SAR images:
Many studies have proposed methods
which help to extract rice regions by using
multi-temporal SAR images (Nguyen Ba
Duy et al., 2015; Yuan et al., 2009; Zhiyuan
et al., 2011). Figure 12 shows the morphology of water rice crop with eight main
stages.
353
Le Minh Hang, et al./Vietnam Journal of Earth Sciences 39 (2017)
According to field survey data, there are
two main crops in Hanoi. Summer-Autumn
rice crop is from February to May and WinterSpring rice crop is from August to November.
Figure 11. Standard deviations and mean values of backscatter of major land cover objects in Hanoi area
Figure 12. Water rice morphology
354
Vietnam Journal of Earth Sciences, 39(3), 345-359
Figure 13 shows the correlation between
phenology of double-cropped rice and backscatter values of multi-temporal Sentinel-1A data in
Hanoi within 10 months. There are two periods
with the lowest peaks backscatter values which
correspond to follow stages. Based on the lowest peaks in January and June, we generate
double-cropped rice classification image in binary format in which value 1 refers to rice and
the value 0 stand for the other objects.
Figure 13. Phenology of double-crop rice with two low-peaks of backscatter
3.3.2. Calculating the intermediate images
As the result of section 3.2 and section 3.3,
we calculate standard deviation image (Figure
14a) and mean backscatter image (Figure 14b)
and double-cropped rice classification image
(Figure 14c). The result images were calculated by MATLAB 2014a software.
Figure 14 shows the difference between
land cover objects in the intermediate images.
For example, the unchanged patterns such as
water and developed land have low standard
deviation values with the dark color, and the
changed pattern's values cultivated land in the
Western Hanoi has a high standard deviation
with bright color. On the contrary, water has
low-intensity value, developed land has highintensity value and cultivated land have the
average value in the mean image. Figure14c
shows the double-cropped rice classification
image which double-cropped rice are shown
by black color and others pattern by white
color. Figure 15 shows the difference intensity
of standard deviation image, mean backscatter
image and double-cropped rice image at the
same area, in particular, rice land.
In this paper, the authors apply decision
tree method to classify land cover. We propose using standard deviation image, mean
backscatter image and double-cropped rice
classification image, which are input data of
decision tree method. The flowchart of the
classification process is shown in Figure 16a
and the thresholds in decision tree method are
shown in Figure 16b. The threshold backscatter values of nodes in decision tree method are
chosen based on field survey and analysis
phenology patterns in multi-temporal Sentinel-1A images (Figure 11) and (Figure 14).
355
Le Minh Hang, et al./Vietnam Journal of Earth Sciences 39 (2017)
Figure 14. (a) Standard deviation image; (b) Mean backscatter image; (c) Double-cropped rice classification image
(a)
(b)
(c)
Figure 15. Different intensity of standard deviation images, mean backscatter image and double-cropped rice image
at the same area; (a) Standard deviation image; (b) Mean image; (c) Double-cropped rice classification image
(a)
(b)
Figure 16. (a) The flowchart of proposed classification method; (b) The threshold of hierarchical class in decision
tree method in which band 1 is the standard deviation image; band 2 is the mean backscatter image, and band 3 is the
double-cropped rice classification image
356
Vietnam Journal of Earth Sciences, 39(3), 345-359
4. Results and Discussion
The result of mapping land cover by using
multi-temporal Sentinel-1A images is shown
in Figure 17. To assess the accuracy of the result, we use 48 field surveying points and 96
random test points in the study area (Figure
18). The test points are interpreted and
checked on Google Earth’s high resolution
satellites images in 2014 and in 2015. The
overall accuracy achieved 84.7%.
(a)
(b)
Figure 17. (a) Land cover mapping in Hanoi; (b) The location of field surveying points and random check points
According to the land cover mapping result
by using multi-temporal Sentinel-1A images,
the authors have the following discussions:
Firstly, interpretation and analyzing of land
cover patterns in multi temporal SAR data
should be combined optical satellite images
and field surveying because SAR image
only provides texture information surface of
objects.
Secondly, the standard deviation value of
multi-temporal Sentinel-1A images allows
evaluating the changes of land cover objects
in a period of time. As a result, using standard
deviation and mean backscatter value as input
data of decision tree method can classify land
cover objects with high accuracy.
Land cover objects as developed land, rivers, lakes can be determined by multitemporal Sentinel-1A images with high accuracy (Figure 18c). The accuracy of classification developed land in this study is 78.8% in
which there are 41 corrected points out of 52
test points. In particular, crop land is classified by analyzing the correlation between crop
phenology and backscatter signal of multi
temporal SAR images (Figure 18d). The accuracy of classification rice-land is achieved
82.6% including 19 correct out of 23 test
points. Hence, the major crops such as rice,
maize etc. in Hanoi can be exactly classified
by multi-temporal Sentinel-1A images by using cropland phenology.
357
Le Minh Hang, et al./Vietnam Journal of Earth Sciences 39 (2017)
However, the proposed method has some
disadvantages. Firstly, land cover objects
which have the same roughness surface, (e.g.
the airport and lakes) are misclassified to the
same class. Secondly, terrain shadow is misclassified to developed land because of terrain
slope reflection phenomenon inside looking
principle of SAR (Figure 18b).
In this study, the authors do not apply
speckle noise filtering for the experience data
because Sentinel-1A with Level-1 GRD data
have been processed by the multi-look overlay. If we use adaptive filter method, the
backscatter value in each time will be
changed. As a result, it is difficult to find phenology patterns of land cover objects by time
series SAR images. However, the final land
cover classification results will be filtered by
the majority to remove isolated pixels.
Figure 18. Analysis of classification result (a) Area of missing image; (b) Terrain shadows;
(c) Developed land in Hanoi; (d) Double-cropped rice land
5. Conclusions
The proposed method in this paper allows
classifying land cover maps in delta area with
complex land cover types. However, the limitations of SAR image, including terrain shadows, speckle noise, and similarity in the surface texture of land cover objects can cause
confusions in classification result. By combining standard deviation, mean backscatter value and phenology of rice crop in decision tree
method allows generating the land cover map
358
in Hanoi using multi-temporal Sentinel-1A
images. The overall estimated accuracy can
achieve up to 84.7%. The signal on SAR images provides the only backscatter generated
by the roughness of ground surface object,
and the observation is unaffected by weather
condition. Meanwhile, the signal on optical
images contains spectral reflectance information from land cover objects, which is more
appropriate for recognition of land cover, but
this information is hard to obtain due to
weather condition. Therefore, in the future,
Vietnam Journal of Earth Sciences, 39(3), 345-359
we need to study a combination of optical image and SAR image to improve the accuracy
of land cover classification.
Acknowledgements
This research has been supported by
a grant for the basic research project
(No.105.08-2014.14) from National Foundation for Science and Technology Development (NAFOSTED) of Vietnam.
References
Abdalla M. Faid, Abdulaziz M., 2012. Monitoring landuse change associated land developement using
multitemporal Landsat data and geoinformatics in
Kom Ombo area, South Egypt. International Journal
of Remote Sensing, 33, 7024-7046.
Abdikan S., et al., 2016. Land cover mapping using
Sentinel-1 SAR data. XXIII ISPRS Congress, 12-19
July 2016, Prague, Czech Republic, 757-761.
Björn Waske, Matthias Braun, 2009. Classifier
ensembles for land cover mapping using
multitemporal SAR imagery. ISPRS Journal of
Photogrammetry and Remote Sensing, 64, 450-457.
Daniel Sabel, Zoltan Bartalis, Wolfgang Wagner,
Marcela Doubkova, Jean-Pierre Klein., 2012.
Development of a Global Backscatter Model in
support to the Sentinel-1 mission design. Remote
Sensing of Environment, 120, 102-112.
Heiko Balzter, et al., 2015. Mapping CORINE Land
Cover from Sentinel-1A SAR and SRTM Digital
Elevation Model data using Random Forest. Remote
Sensing, 14876-14898.
James R., Anderson E.E., 1976. A land use and land
cover classification system for use with remote
sensor data. Washington. Geological Survey, 964.
Lambin E.F., Baulies X., Bockstael N., Fischer G., Krug
T., Leemans R., Moran E.F., Rindfuss R.R., Sato Y.,
Skole D., Turner B.L. II, Vogel C., 1999. Land-Use
and Land-Cover Change (LUCC) Implementation
Strategy; IGBP Report No.48/IHDP Report
No.10. Sweden. International Geosphere-Biosphere
Programme (IGBP), Stockholm.
Li J., Lewis J., Rowland J., Tappan G., Tieszen L.L.,
2004. Evaluation of land performance in Senegal
using multi-temporal NDVI and rainfall series.
J. Arid Environ, 59, 463-480.
Lupo F., Linderman M., Vanacker V. Bartholomé E.,
Lambin E.F., 2007. Categorization of land-cover
change processes based on phenological indicators
extracted from time series of vegetation index
data. International Journal Remote sensing, 28,
2469-2483.
Myneni R.B., Hall F.G., Sellers P.J., Marshak A.L.,
1995. The interpretation of spectral vegetation
indexes. IEEE Trans. Geosci. Remote Sensing, 53,
481-486.
Nguyen Ba Duy, Kersten Clauss Senmao Cao, Vahid
Naeimi, Claudia Kuenzer, Wolfgang Wagner, 2015.
Mapping Rice Seasonality in the Mekong Delta with
Multi-Year EnviSat ASAR WSM Data. Remote
Sensing, 7, 15868-15893.
Nguyen Dinh Duong, Anh Le Van, Thu Ho Le, 2014.
Interpretation of land cover using spectral
modulation pattern an example with Landsat 8 OLI
image. Vietnam Journal of Earth Sciences, 36,
480-488. Doi: 10.15625/0866-7187/36/4/6436.
Online E.S., 2016. ESA EO Missions. Retrieved 2000,
from Sentinel-1:
/>Online E.S., 2016. SENTINEL-1 SAR User Guide
Introduction. Retrieved 2000, from Overview:
/>Thiel C., Cartus O., Eckardt R., Richter N., Thiel C.,
Schmullius C., 2009. Analysis of multitemporal
land observation at C-band. In Proceedings of
the 2009 IEEE International Geoscience,
doi:10.1109/IGARSS.2009.5417764.
Wagner W., Sabel D., Doubkova M., Hornacek M.,
Schlaffer S., Bartsch A., 2012. Prospects of Sentinel-1 for land applications. In Geoscience and Remote Sensing Symposium (IGARSS), IEEE International. IEEE, 1741-1744.
Yuan Z, Cuizhen Wang, Jiaping Wu, Jiaguo Qi, William
A. Salas, 2009. Mapping paddy rice with
multitemporal ALOS/PALSAR imagery in southeast
China. International Journal of Remote Sensing,
30(23), 6301-6315.
Zhiyuan Pei, Songling Zhang, Lin Guo, Heather
McNairn, Jiali Shang, Xianfeng Jiao., 2011. Rice
identification and change detection using TerraSARX data. Canadian Journal of Remote Sensing, 37,
151-156.
359