Land surface temperature responses to vegetation and soil moisture index using Landsat-8 data in Luong Son district, Hoa Binh province
Bạn đang xem bản rút gọn của tài liệu. Xem và tải ngay bản đầy đủ của tài liệu tại đây (399.07 KB, 13 trang )
Management of Forest Resources and Environment
LAND SURFACE TEMPERATURE RESPONSES TO VEGETATION
AND SOIL MOISTURE INDEX USING LANDSAT-8 DATA
IN LUONG SON DISTRICT, HOA BINH PROVINCE
Vo Dai Nguyen1, Nguyen Hai Hoa1*, Nguyen Quyet1, Pham Duy Quang1
1
Vietnam National University of Forestry
SUMMARY
Land surface temperature (LST) is considered as a key factor in natural processes. Remote sensing data, including
Landsat-8 data, offers numerous opportunities to better understand the land processes. This study has conducted
to construct land use and land cover map in 2020 using NDVI thresholds. The study then calculated the LST,
NSMI, NDBI and Slope of Luong Son district, Hoa Binh province using Landsat-8 OLI/TIRS data. Models
showing the relationships between the LST and independent variables (NDVI, NSMI, NDBI and Slope) were
developed using R statistical software. As a result, NDVI used for land use and land cover mapping is confirmed
with the overall accuracy assessments of 92.0% and Kappa coefficient of 0.85. Study developed 37 linear
regression models, one of them was selected and used to predict the LST in Luong Son district. The selected
model (R2 > 0.60, Pvalue < 0.0001) confirms that an increase of built-up land (NDBI) and loss of vegetation cover
(NDVI) become a serious threat to the increase in land surface temperature in Luong Son district. This study
implies that an increase of vegetation cover would lead to a slight decrease in land surface temperature, and builtup land expansion would be one of main responsible drivers for an increase of the LST. The only way to mitigate
this risk is to increase additional vegetation cover in the built-up land; to both protect the existing forests and
promote afforestation activities, which can considerably reduce the land surface temperature.
Keywords: land surface temperature, Landsat data, NDBI, NDVI, NSMI, regression model.
1. INTRODUCTION
As defined by Anandababu et al. (2008)
land surface temperature is the surface
temperature of the earth’s crust where the heat
and radiation from the sun are absorbed,
reflected and refracted. It is considered as one
of the most important aspects of land surface.
Many fields, such as global climate change,
hydrological, geo-/biophysical, and urban land
use/land cover, rely heavily on land surface
temperature (Rajeshwari and Mani, 2014).
Therefore, changes in land use land cover or
vegetation cover is relatively sensitive to the
land surface temperature. Plants are known as a
primary factor influencing the water balance of
soil in natural and building ecosystems by
changing the transfer of heat and moisture from
the soil surface to the air (Acharya et al., 2016).
Soil moisture links with land surface
temperature through the water cycle, which in
turn influences plant development (Malo and
Nicholson, 1990). Artificial impermeable
surfaces (sealed soils) cause heat storage to
increase during the day and release to be slower
at night, resulting in a greater land surface
temperature than green areas (Morabito et al.,
2016). The impact of topography on the LST
varies depending on the quantity of solar
energy received, and the impact of topography
on the LST changes through time. There is a great
*Corresponding author:
82
difference in the land surface temperature
among different types of land use (Xiao and
Weng, 2007). Along with that, Kumar and
Shekhar (2015) concluded the distribution of
land surface temperature (LST) is significantly
influenced by vegetation coverage. Pablos et al.
(2016) identified that land surface temperature
regulation is strongly influenced by the energy
balance extension of soil moisture, an important
component of the Earth’s surface water balance.
Adulkongkaew et al. (2020) indicated that in
recent years, LST has tended to increase in both
urban and suburban areas. Peng et al. (2020)
pointed out that topography, especially slope is
an important factor in controlling LST.
Luong Son district is located in Hoa Binh
province, a mountainous province of Vietnam,
located in the nation's Northwest region, with
298,103 ha of forest areas and 64.66% of
provincial coverage. In Hoa Binh, recent
records have showed that the highest
temperature in summer could reach 340C and
the lowest temperature in January can be around
12.90C, but with very high humidity, it causes
chilling phenomenon (Luong Son Gov, 2016).
Changes in climatic factors like as land surface
temperature often lead to changes in vegetation
cover in certain locations. In addition, due to
the shortage of investigation and studies in the
correlation between land surface temperature
with vegetation, built-up area and soil
JOURNAL OF FORESTRY SCIENCE AND TECHNOLOGY NO. 11 (2021)
Management of Forest Resources and Environment
moisture, there are still a few comprehensive
documents and information about vegetation,
temperature, soil moisture and their
relationship in this study site.
Advanced spatial analysis tools and remote
sensing technologies have been developed
rapidly over the past decades. They offer a
series of sensors that can operate at a variety of
imaging scales (Rogan and Chen., 2004; Hoa et
al., 2020). The climate effect on regional
ecosystems can be demonstrated by the
response of vegetation covers to climatic
characteristics with the application of remote
sensing (Carlson, 2000). LST measures the
emission of thermal radiance from the land
surface where the incoming solar energy
interacts with and heats the ground, or the
surface of the canopy in vegetated areas (Ansar,
2021). The normalized difference vegetation
index (NDVI) has been used extensively in
remote sensing studies (Seaquist, 2003).
Besides, NDVI is a widely used indicator for
tracking vegetation dynamics and land surface
responses to hydrological variations at large
scales (Ahmed et al., 2017). Similarly, the
NSMI represents a dimensionless parameter
that can be used to quantify gravimetric soil
moisture (Haubrock et al., 2008; Alonso et al.,
2019). The normalized difference built-up index
(NDBI) has been useful for mapping urban
buildup areas using Landsat Thematic Mapper
(TM) data (Bhatti and Tripathi, 2014). Slope is
a useful parameter to assess changes in LST.
On worldwide scale, many studies have
evaluated the relationship between LST with
NDVI, NDBI, NSMI and slope (Kim, H. J et al.,
2014; Chi, et al., 2020).
The main objective of the study was to
analyses the relationships between land surface
temperature (LST) and independent variables
(NDVI, NSMI, NDBI, and Slope). To do this,
land use and land cover in 2020 was created
using Landsat-8 (2020). It then calculated
NDVI, NSMI, NDBI and Slope for modelling
development. Multiple linear regression models
have been developed to identify the predictor
and it’s for the LST in Luong Son district.
Finally, the selected models would be useful to
understand how much the LST changes when
the NDVI, NSMI, NDBI, and Slope change.
These findings would be also important to
imply how to maintain vegetation covers in
Luong Son District.
2. RESEARCH METHODOLOGY
2.1. Study site
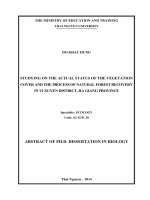
The study site of Luong Son district, Hoa
Binh province is located in the Northwest parts
of Vietnam. Hoa Binh province. It lies between
105025’14” ÷ 105041’25 E; and 20036’30” ÷
20057’22” N (Fig. 1). It borders with Ky Son
district in the West. The South borders on the
Districts of Kim Boi and Lac Thuy. The East
borders on My Duc and Chuong My districts
(Hanoi city); the North borders Quoc Oai
district (Hanoi City).
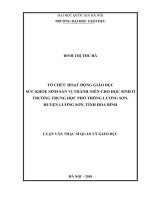
Fig. 1. Study site: (a) Geographic location of Luong Son district, Hoa Binh province;
(a) Luong Son district as study site
JOURNAL OF FORESTRY SCIENCE AND TECHNOLOGY NO. 11 (2021)
83
Management of Forest Resources and Environment
Luong Son district has the advantage of
geographical position, being a hub for
economic, cultural and social exchange between
the Northwestern mountainous region and the
Red River Delta region. The total natural areas
of the Chuong My district is estimated
36,488.85 ha (Luong Son Gov, 2016). In terms
of topography, Luong Son district belongs to the
midland mountainous region, the transition
between the plain and the mountainous region,
so the terrain is diverse. The terrain is
mountainous with an altitude of about 200 400m. The population of the district is about
98,856 people, including 3 main ethnic groups,
namely Muong, Dao, and Kinh (Luong Son
Gov, 2016). This study is one of the hottest
histrict of Hoa Binh in summer because it is
surrounded by mountains. The detection of the
extent of land surface temperature and its
relationships with other associated drivers
No
1
2
3
would be useful for adopting mitigation
measures in a changing climate.
2.2. Methods
2.2.1. Remote sensing data
In this study, Landsat-8 data in 2016 and
2020 were freely downloaded as shown in Table
1. Landsat-8 data (2016 and 2020) were both
used to construct land use and land cover maps
based the defined thresholds of each land cover
type in the Luong Son district. The Landsat-8
data in 2020 was used to develop the models
showing the relationships between LST (Land
Surface Temperature) and NDVI (Normalised
Difference
Vegetation
Index),
NDBI
(Normalised Difference Built-up Index), NSMI
(Normalised Soil Moisture Index), and Slope in
Luong Son district, Hoa Binh province. These
indices are commonly used in previous studies
in relation to land use and land cover mapping
(Schnur et al., 2010; Chuai et al., 2013).
Table 1. Remotely sensing data used this study
Image codes
Date
Spatial resolution (m)
LC08_127046_20200628_20200824_02_T1
28/06/2020
30
DEM
11/02/2000
30
Forest status map
2020
1:50.000
Source: ; 1Hoa Binh Forest Protection Department (2021).
2.2.2. Image processing and indices
calculation
Landsat-8 data pre-processing: As the
Landsat-8 data (2020) was successfully
downloaded, all of the pre-processing procedures
of Landsat-8 (2020) was undertaken based on the
guideline of Landsat preprocessing methods (e.g.
Padro et al., 2017; Shimizu et al., 2018; Afrin, et
al., 2019). In this study, the pre-processing
procedures included radiometric correction,
atmospheric correction, topographic correction,
subset, bands combination (composite bands). In
particular, Landsat-8 OLI/TIRS data are
subjected to several corrections, such as
radiometric and atmospheric issues. Landsat-8
data (2020) were converted to surface reflectance
by top-of-atmosphere (TOA) method using
ArcGIS 10.4.1. Thermal atmospheric correction
was performed on TIR bands with normalized
pixel regression method. Radiometric correction
was done to reduce and correct errors in the
digital numbers of images. This process would
improve the interpretability and quality of
remotely sensed Landsat-8 data. Radiometric
calibration and correction are particularly
84
important as comparing data sets over a multiple
time period. Radiometric calibration was also
applied this study as a sensor records the
intensity of electromagnetic radiation for each
pixel known as digital number (DN). These
digital numbers were converted to more
meaningful real world units, such as radiance,
reflectance or brightness temperature. Sensor
specific information obtained from Landsat-8
data as the metadata file was needed to carry out
this calibration. Radiometric calibration of
Landsat-8 data (2020) was converted directly to
reflectance using ArcGIS 10.4.1. Similarly,
atmospheric correction was applied to remove
the effects of the atmosphere and produce
surface reflectance values. Atmospheric
correction also significantly enables improve the
interpretability and use of Landsat-8 data. Other
preprocessing procedures were applied as the
studies of Song et al., (2001); Hai-Hoa et al.,
(2020).
Normalized Different Vegetation Index
calculated (NDVI):
One of the most commonly interpretation
methods for land use and land cover is based on
JOURNAL OF FORESTRY SCIENCE AND TECHNOLOGY NO. 11 (2021)
Management of Forest Resources and Environment
the values of NDVI. In this study, we used the
NDVI thresholds to classify NDVI into
different classes (Mohajane et al., 2018).
Mohajane et al., (2018) has used NDVI
threshold values for three vegetation categories
as NDVI values below to 0.2 are considered as
low-density vegetation; NDVI values between
0.2 and 0.5 are moderate-density vegetation and
NDVI values higher than 0.5 are high-density
vegetation. However, we would define the
NDVI threshold values for three land covers,
namely water, non-forest and forest classes in
the study site. In general, NDVI values range
from -1 to 1. The highest value represents
healthy vegetation, while the lowest NDVI
value shows non-vegetation cover (Sellers et al.,
1992; Mavi and Tupper, 2004). Non-vegetation
cover includes barren surfaces (rock and soil),
water, snow, and ice, normally ranging near
zero and decreasing negative values (Saravanan
et al., 2019). The following formula of NDVI is
presented as below (Schnur et al., 2010; Chuai
et al., 2013):
NDVI =
For Landsat-8, Band-4 is the RED Band
reflectance; and Band-5 is the NIR Band
reflectance.
Normalized
Soil
Moisture
Index
calculated (NSMI):
Normalized Soil Moisture Index (NSMI) is
defined as a non-dimensional measure of
reflectance spectra, calculated from difference
of the reflectance of two specific spectral bands,
1800 nm ÷ 2119 nm, using mathematical
operations (Haubrock et al., 2008). The
efficiency of the environment compensation
processing has a significant impact on NSMI
results (Fabre et al., 2015). This study used
NSMI to measure the soil moisture and quantify
the gravimetric soil moisture (Dinh et al., 2019).
The NSMI was straightforward to use and
interpret (Nocita et al., 2013; Hong et al., 2017).
The formula of NSMI in Landsat-8 was
designed and followed the study of Fabre’s
work (2015) as shown below:
Band
− Band
NSMI =
Band
+ Band
For Landsat-8, Band-6 is the SWIR1 Band
reflectance; and Band-7 is the SWIR2 Band
reflectance.
Normalized Difference Built-up Index
calculated (NDBI):
NDBI is one of the significant indices
applied widely to identify the built-up
information and to extract the built-up land use.
The formula is indicated as below.
Band
− Band
NDBI =
Band
+ Band
For Landsat-8, Band-6 is the SWIR1 Band
reflectance; and Band-5 is the NIR Band
reflectance.
NDBI value lies between -1 ÷ 1. The
negative value of NDBI represents water
bodies, while higher value indicates built-up
areas. NDBI value for vegetation is low.
Slope values calculated from 2011 DEM
(30m, unit degree):
DEM (Digital Elevation Model) from
ASTER remote sensing data has been used to
calculate the slope of Luong Son District with
the help of ArcGIS 10.4.1 software. The
download DEM has implemented through preprocessing of extracting by mask tools to
delineate the Luong Son region. Finally, the
slope map of Luong Son district was created.
Land Surface Temperature calculated (LST):
Land Surface Temperature (LST) is known as
a crucial index of remote sensing, which is used
to estimate the temperature of surface cover and
its surrounding environment. This parameter is
widely used in land use and land cover change
monitoring (LULC) (e.g. Bharath et al., 2013;
Bokaie et al., 2016; Jiang and Tian, 2010;). LST
is retrieved from thermal infrared (TIR) spectral
measurements made by ground-based, airborne,
or satellite-based sensors (Mutibwa et al., 2015).
Therefore, it is necessary to convert the value of
this digital image data into a spectral irradiance
value that reflects the energy emitted by each
object captured on the heat channel. Although
there are two TIR spectral bands in Landsat-8
(Bands 10 and 11), we only used Band-10 this
study due to being more stable than Band-11 and
less difference from the monitored LST at
weather station (Xu, 2015). The key steps of LST
calculation were followed and summarised as
below according to studies of Jeevalakshimi et
al., (2017); Meng et al., (2019).
+ Digital number (DN) was converted to
spectral radiance (Lλ) as below:
Lλ =ML*Qcal +AL
JOURNAL OF FORESTRY SCIENCE AND TECHNOLOGY NO. 11 (2021)
85
Management of Forest Resources and Environment
Where: ML is Band-specific multiplicative
rescaling factor from the metadata (radiance
Mult_Band_x, where x is the band number);
AL is Band-specific additive rescaling factor
from the metadata (Radiance_add_band_x,
where x is the band number);
Qcal is Quantized and calibrated standard
product pixel values (DN).
+ The next step was conversion to at-satellite
brightness temperature as the following:
T = K2/ln((K1/Lλ) +1) -272.15
Where: T is At-satellite Brightness
Temperature (K);
Lλ is TOA spectral radiance (Watts/m2 srad *
πm);
K1 is Band-specific thermal conversion
constant form the metadata (K1_constant_Band_x,
where x is the band number 10);
K2 is Band-specific thermal conversion
constant from the metadata (K2_constant_Band_x,
where x is the band number 10). For band 10: K1 is
774.89; K2 is 1321.08.
+ Proportion of Vegetation (Pv) is the ratio of
the vertical projection area of vegetation on the
ground, including leaves, stalks, and branches to
the overall vegetation area (Neinavaz et al.,
2020) and this value was calculated by using
NDVI (Wang et al., 2015; Agapiou et al., 2020).
The formula of calculating Pv is shown below:
Pv = (NDVI - NDVImin/NDVImax - NDVImin)2
+ Land Surface Emissivity (ε) is defined as
the efficiency of transmitting thermal energy as
thermal infrared (TIR) radiation across the
surface into the atmosphere (Avdan and
Jovanovska, 2016). It is a crucial factor to
compute LST with high accuracy (Zhang et al.,
2017). After calculating Pv, LSE is then derived
by the following formula:
LSE = 0.004 * Pv +0.986
+ LST is finally estimated by the following
formula:
LST=BT/1+ W*(BT/p) * Ln (LSE)
Where: BT is At-Satellite Temperature;
W is Wavelength of emitted radiance
(11.5μm = Band 10);
p=h*c/s (1.438*10^2-34Js);
h: Plantck’s constant (6.626*10^-23J/K);
s: Boltzmann constant (1.38*10^23J/K);
c: velocity of light (2.998*10^8 m/s).
2.2.3. Accuracy assessments of land use and
land cover classification
86
The accuracy assessment is an important
process for evaluating the result of postclassification as the user of land cover outputs
needs to know how accurate the results is. To
use the data correctly, we considered the
minimum level of interpretation accuracy in
land use and land cover map would be at least
85.0% as suggested by previous studies of
Anderson (1976); Thomlinson et al., (1999);
Foody (2002). Randomly selected sample
points were used to quantitatively assess the
land cover classification accuracy. Total sample
points used for the classification accuracy
estimation were 274 points, 174 points for forest
class, 50 points for water class (rivers, lakes,
other water bodies), and 50 points for non-forest
class. The overall classification accuracy,
producer’s accuracy and Kappa statistics were
then estimated for quantitative classification
performance analysis (Tso, 2001; Foody, 2013).
2.2.4. Model development
Randomly, 224 points with a 30-m buffer
(equivalent to 2826 m or 94 pixels), 174 of
which are forest points and 50 points are nonforest areas, have been extracted from NDVI,
NSMI, NDBI, Slope, and LST data through
ArcGIS 10.4.1. The mean value of each 20-m
buffered point was taken for model
development purpose.
Multiple linear regression model with the
stepwise approach has been developed to
predict the variable for measuring land surface
temperature with the help of R (Statistics
Package for Social Science). Here, the land
surface temperature (LST) was taken as a
dependent variable. NDVI and NSMI were
taken as independent variables for predicting
the land surface temperature in Luong Son
District. R is multiple correlation coefficients
which are considered as a measure of the worth
of the prediction of the dependent variables. The
values are statistically analyzed for the creation
of a model using multiple linear regression with
the stepwise approach in R where Y is the
dependent
variable
(LST), α
is
the
intercept, β1,2,3,..n are regression coefficients of
the independent variables, and x1,2,3,…n are
independent variables (NDVI, NSMI, NDBI,
Slope), which would be the predictor of the
dependent variable.
= ! + " # + " # + ⋯ + "% #%
JOURNAL OF FORESTRY SCIENCE AND TECHNOLOGY NO. 11 (2021)
Management of Forest Resources and Environment
3. RESULTS AND DISCUSSION
3.1. Land use and land cover in Luong Son
district
Accuracy assessment of land use and land
cover classification:
The classification accuracy was evaluated by
the confusion matrix. The classified image
showed an overall accuracy of 92.0% in 2020,
with a Kappa statistic of 0.85 (Table 2). User’s
and producer’s accuracies of individual classes
for 2020 of land cover map are presented in
Table 2, and indicate that all classes have user’s
and producer’s accuracies higher than 85.5%,
with exception of non-forests in producer’s
accuracy assessments. The classification
accuracy of the results was assessed based on
the field survey results, the sampling points
focused on the un-surveyed areas. During
accuracy assessments, mapping accuracies
might be affected by several possible factors,
including mixed-pixel issues, images taken at
different time and cloud cover percentage (Hoa
et al., 2020). This result confirms that the land
cover map can be used to assess the
relationships between LST, NDVI, NSMI,
NDBI and Slope in Luong Son district.
Table 2. Accuracy assessments of land cover classified by NDVI in 2020
GPS
Image classified
Water
Non-forests
Forests
Total
User’s Accuracy (%)
Water
48
2
0
50
96.0
Non-forests
1
49
0
50
98.0
Forests
0
20
180
200
90.0
180
Total
49
71
300
100.0
Producer’s Accuracy (%)
98.0
69.0
Overall accuracy (%): 92.0; Kappa coefficient is 0.85
NDVI land cover classification in 2020:
The results presented in Figs. 2 & 3, Table 3
reveal that the class of forests was the dominant
NDVI land cover class in 2020. It covers
approximately 89.82% of Luong Son’s territory
(Table 3).
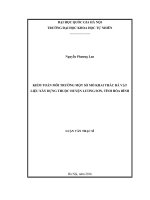
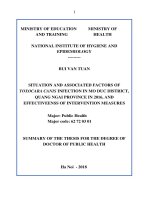
As results indicated in Fig. 2, the NDVI
values in Luong Son district range from -0.605
÷ 0.874, the greater the NDVI value is, the
denser the forest cover is (Xie et al., 2008;
Singh et al., 2016). Combined with field survey
(a)
data shows that the higher NDVI value (> 0.40)
is classed as forest class, while with lower
NDVI value (0 ÷ <0.40) is categorised as other
class (including grasslands, agriculture,
residential areas, and others); and negative
NDVI value (-0.605 ÷ 0) is surface water.
Based on the land cover classification, the study
defined thresholds of land cover in Luong Son
district as shown in Table 3. These thresholds
for land cover in 2020 was then used to classify
land cover in 2016.
(b)
Fig. 2. NDVI values (a); Land use/cover in Luong Son district (Landsat-8 28/06/2020)
JOURNAL OF FORESTRY SCIENCE AND TECHNOLOGY NO. 11 (2021)
87
Management of Forest Resources and Environment
Table 3. NDVI thresholds for land covers classified in Luong Son district
Class
Water
Non-forests
Forests
NDVI
-0.605 ÷ 0.0
0.0 ÷ 0.5
0.4 ÷ 0.874
Areas in 2020 (ha)
94.8 (0.3%)
6234.7 (17.1%)
29946.2 (82.6%)
Table 3 shows that the total of forest areas in
Luong Son district is estimated about 29946.2
ha (equivalent to 82.6%), while other land areas
covered by non-forest areas (grassland,
agricultural land, residential land, roads, bare
land) are 6234.7 ha (17.1%). The land covered
by water surface accounts for 94.8 ha (0.3%).
3.2. Land surface temperature, NSMI, NDBI
and Slope in Luong Son district
Land surface temperature (LST):
Land surface temperature (LST) shows the
mean temperature in forested areas and nonforested areas are 26.00C and 28.10C,
respectively (Table 4), with a maximum
temperature of 28.00C and minimum
temperature of 22.20C for forested areas, a
maximum temperature of 31.920C and
minimum temperature of 25.240C for nonforested areas. Key statistics are summarised in
Table 4.
Table 4. Summary of statistics of LST calculated from Landsat-8 in 2020
Land cover
Non-Forested areas
Forested areas
Indices
NDVI
NSMI
LST
(0C)
NDBI
Slope
(o)
NDVI
NSMI
LST
(0C)
NDBI
Slope
(o)
Max
Min
Mean
Std
0.39
0.04
0.21
8.7
0.39
0.02
0.22
7.81
32.9
25.2
28.1
1.66
0.22
-0.62
-0.16
0.2
46.3
0.0
8.82
10.5
0.84
0.56
0.76
7.74
0.5
0.29
0.43
3.22
28.0
22.0
26.0
1.1
-0.14
-0.54
-0.38
5.44
51.3
0.75
17.1
8.46
As shown in Table 4, there is a difference in
land surface temperature between non-forested
and forested areas. Similarly, compared with
non-forested area, the NSMI value and the LST
is higher and lower in forested areas,
respectively. Therefore, it can assume that high
vegetation cover leads to high in NSMI value,
lower vegetation cover results in lower NSMI
(a)
(b)
value. In contrast, the higher vegetation cover
is, the lower land surface temperature is and in
turn.
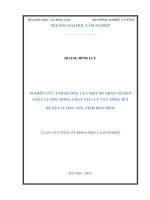
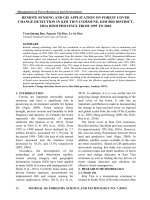
NDBI, NSMI and Slope calculation:
NDBI, NSMI and Slope indicates that there
are differences in mean NDBI, NSMI and Slope
between non-forested areas and forested areas
(Fig. 3).
(c)
Fig. 3. Indices calculated from Landsat-8 28/06/2020: (a) NSMI values; (b) NDBI values;
(c) Slope values in Luong Son district
88
JOURNAL OF FORESTRY SCIENCE AND TECHNOLOGY NO. 11 (2021)
Management of Forest Resources and Environment
In NDBI value, NDBI is used to map urban
built-up areas with a range of -1.0 ÷ 1.0, the higher
NDBI value indicate built-up areas and low value
for vegetated areas. Indeed, high built-up areas
land experiences high LST and low built-up land
is evidenced with low LST (Table 4). Similarly, it
clearly shows that where the region experiences
high vegetation cover, the LST is less and vice
versa. It is evidently there is a difference in max
LST between non-forested and forested areas.
Interestingly, there is a big difference in terms of
soil moisture between non-forested (max NSMI
=0.22) and forested areas (max NSMI = 0.43).
Therefore, it assumes that both LST and
vegetation cover are significantly influential
factors in the moisture concentration in the soil.
The LST has decreased from low elevated region
to high elevated region. Vegetation increases the
LST and these increases are indirectly
proportional built-up land increases. Height
(Slope) increases the temperature decreases. In
short, built-up land plays a major role in
increasing the temperature due to the hard
concrete surface which contains almost nil water
storage which leads to less humidity. The low
humidity results in slow transpiration of the land
surface. This process initiates the land surface
temperature to increase easily.
3.3. Linear regression models between LST
and other remote sensing indices
Linear regression models were developed to
predict the variable for measuring land surface
temperature (LST). In this study, the LST was
taken as a dependent variable, while NDVI,
NSMI, NDBI and Slope were taken as
independent variables for predicting the LST of
any given region either in Luong Son district or
Hoa Binh province. As a result of linear
regression model development, there are 37
models developed with a range of R2 from 0.520
(Model 4) to 0.679 (Model 24), showing a
moderate to good level of prediction (Table 5).
The coefficient of determination is represented
by R square (R2) which indicates the proportion
of variance in the dependent variables that can
be explained by the independent variables. The
R square values range from 0.520 (Model 4) to
0.679 (Model 37), so above 52.0% to 67.9% of
the variation in the LST (dependent variable)
can be explained by independent variables
(NDVI, NDBI, NSMI, and Slope) shown in
Table 5.
Overall, all of the models developed have
Pvalue less than 0.001, known that the
significant value of 0.00 is lesser than the alpha
value of 0.05 indicating that the independent
variables are statistically significant for the
prediction of the dependent variable. This
means that the adopted regression model is a
good fit of the data.
Table 5. Summary of linear regression models developed: Relationships between LST and other
predictor variables (NDVI, NSMI, NDBI, and Slope)
No
Models
R2
P-values
LST = 31.1219 -12.8649*NSMI
1
0.593
<0.001
LST = 28.6096 + 10.6833 * (NDVI*NDBI)
2
0.571
<0.001
LST = 29.0423 + 8.7899*NDBI
3
0.538
<0.001
LST
=
28.2990
+
21.3940
*
(NDVI*NSMI*NDBI)
4
0.520
<0.001
LST = 29.7155 -2.7114*NDVI + 5.6510*NDBI
5
0.617
<0.001
LST = 30.6911- 8.8733*NSMI + 3.3502*NDBI
6
0.615
<0.001
LST = 29.0011 + 5.1910* NDBI + 11.2302*(NDVI*NSMI*NDBI)
7
0.592
<0.001
LST = 29.22536 + 7.54456*NDBI -0.05611*(NDVI*Slope)
8
0.589
<0.001
LST = 29.408515 + 8.626850*NDBI – 0.026590*Slope
9
0.559
<0.001
10
11
12
13
14
15
LST = 30.3071 -6.3792*NSMI + 29.6517*(NDVI*NDBI) -51.0336*
(NDVI*NSMI*NDBI)
LST = 28.7118 + 2.2904*NDVI + 45.3719*(NDVI*NDBI) 64.1570*(NDVI*NSMI*NDBI)
LST = 29.2300 + 2.2665*NDBI + 30.0626*(NDVI*NDBI) 45.6457*(NDVI*NSMI*NDBI)
LST = 30.43261 -6.98473*NSMI + 3.88784*NDBI -0.02834*(NDVI*Slope)
LST = 29.65822 -2.17602*NDVI + 5.76245*NDBI – 0.02319*(NDVI*Slope)
LST = 29.13557 + 4.61870*NDBI + 5.07468*(NDVI*NDBI) 0.02753*(NDVI*Slope)
0.638
<0.001
0.637
<0.001
0.636
<0.001
0.624
0.622
<0.001
<0.001
0.617
<0.001
JOURNAL OF FORESTRY SCIENCE AND TECHNOLOGY NO. 11 (2021)
89
Management of Forest Resources and Environment
No
16
17
Models
R2
0.614
0.613
P-values
LST = 28.52729 + 5.92308*NDBI + 0.07238*Slope -0.14768*(NDVI*Slope)
<0.001
LST = 30.06768 -9.81049*NSMI + 0.06017*Slope -0.10138*(NDVI*Slope)
<0.001
LST = 28.00595 + 0.07736*Slope + 7.82381*(NDVI*NDBI) 18 0.11994*(NDVI*Slope)
0.601
<0.001
LST = 27.64006 + 0.09801*Slope + 13.73126*(NDVI*NSMI*NDBI) 19 0.15600*(NDVI*Slope)
0.574
<0.001
20 LST = 28.11218 -2.99723*NDVI +0.10290*Slope -0.16238*(NDVI*Slope)
0.548
<0.001
LST = 30.0387 +2.6185*NDVI -7.2186*NSMI + 37.0577*(NDVI*NDBI) 21 57.6510*(NDVI*NSMI*NDBI)
0.651
<0.001
LST = 28.65176 + 2.79587*NDVI + 46.06276*(NDVI*NDBI) –
22 65.35218*(NDVI*NSMI*NDBI) -0.0295*(NDVI*Slope)
0.642
<0.001
LST = 28.62815 + 0.05115*Slope + 32.33102*(NDVI*NDBI) 23 49.99425*(NDVI*NSMI*NDBI) -0.08218*(NDVI*Slope)
0.640
<0.001
LST = 29.73244 -5.63870*NSMI + 3.50655*NDBI + 0.07848*Slope 24 0.09502*(NDVI*Slope)
0.634
<0.001
LST = 29.11828 -1.69397*NDVI +5.12580*NDBI + 0.04604*Slope 25 0.08874*(NDVI*Slope)
0.631
<0.001
LST = 28.61134 + 3.92990*NDBI +0.05617*Slope +
26 4.08695*(NDVI*NDBI) -0.10416*(NDVI*Slope)
0.631
<0.001
LST = 28.55312 + 4.66898*NDBI + 0.06212*Slope +
27 5.75539*(NDVI*NSMI*NDBI) -0.11877*(NDVI*Slope)
0.624
<0.001
LST = 27.60047 + 1.91444*NDVI + 0.08433*Slope
28 +10.92910*(NDVI*NDBI) -0.13731*(NDVI*Slope)
0.607
<0.001
LST = 30.38355 +1.99188*NDVI -10.61842*NSMI +
29 4.97372*(NDVI*NDBI) -0.02177*(NDVI*Slope)
0.606
<0.001
LST = 30.06208 +3.24387*NDVI -7.73492*NSMI
30 +37.28577*(NDVI*NDBI) -58.60892*(NDVI*NSMI*NDBI) 0.658
<0.001
0.0295*(NDVI*Slope)
LST = 30.0373 + 6.2742*NDVI -11.8112*NSMI -4.4552*NDBI
31 +58.4370*(NDVI*NDBI) -86.8834*(NDVI*NSMI*NDBI)
0.657
<0.001
LST = 28.05976 +3.13874*NDVI +0.05851*Slope +
32 41.21894*(NDVI*NDBI) -57.73958*(NDVI*NSMI*NDBI) 0.656
<0.001
0.10482*(NDVI*Slope)
LST = 28.85371 + 2.4682*NDBI +0.04431*Slope +24.18246*(NDVI*NDBI)
33 -38.07884*(NDVI*NSMI*NDBI) -0.08144*(NDVI*Slope)
0.649
<0.001
LST = 29.72729 -5.24343*NSMI + 0.04085*Slope
34 +26.48790*(NDVI*NDBI)
0.647
<0.001
LST = 29.33342 + 3.43672*NDVI -6.33340*NSMI +0.04676*Slope
35 +35.00497*(NDVI*NDBI) -53.74683*(NDVI*NSMI*NDBI) 0.666
<0.001
0.09125*(NDVI*Slope)
LST = 30.05994 +6.75755*NDVI -12.15768*NSMI -4.30651*NDBI +
36 57.94422*(NDVI*NDBI) -86.83502*(NDVI*NSMI*NDBI) 0.664
<0.001
0.02415*(NDVI*Slope)
LST = 29.02306 +9.03602*NDVI -12.68862*NSMI -6.76316*NDBI
37 +0.06646*Slope +66.48707*(NDVI*NDBI) 0.679
<0.001
96.02596*(NDVI*NSMI*NDBI) – 0.11792*(NDVI*Slope)
a: dependent variable (LST, Land Surface temperature). b: predictors- constant, NDVI, NSMI, NDBI, and Slope.
As linear regression models shown in Table
5, the negative value of independent variables
(NDVI, NSMI, NDBI, and Slope) indicates that
the LST increase, which decreases in vegetation
cover (NDVI, NDBI); soil moisture (NSMI)
and Slope, so LST is negatively related to
(NDVI, NSMI, NDBI) and slope and vice versa.
In general, all of the models developed can
be used to predict the LST. However, this study
90
would select one of shortlisted models in Table
5, which can be the best prediction of the LST
in Luong Son district. To do this, some criteria
have been taken into account: (1) the model
should have R2 > 0.60 at least; (2) Pvalue of the
model and of each independent variable
included in the model need be statistically
significant with value less than 0.05; and (3)
independent variables included in the model can
JOURNAL OF FORESTRY SCIENCE AND TECHNOLOGY NO. 11 (2021)
Management of Forest Resources and Environment
be easily and clearly explained to dependent
variable (LST). As a result, the study has
selected one optimal models for predicting the
LST in Luong Son district (Table 6).
Table 6. Model summary of LST prediction in Luong Son district
1. Model 5:
(Intercept)
Estimate
29.7155
Std. Error
0.2074
t value
143.242
Pr(>|t|)
< 2e-16 ***
NDVI
-2.7114
0.4013
-6.757
1.23e-10 ***
NDBI
5.6510
0.6777
8.338
8.09e-15 ***
Signif. codes: 0 ‘***’ 0.001 ‘**’ 0.01 ‘*’ 0.05 ‘.’ 0.1 ‘’ 1
Residual standard error: 1.02 on 221 degrees of freedom; Multiple R-squared: 0.6167, Adjusted R-squared: 0.6132; Fstatistic:177.8 on 2 and 221 DF, p-value: < 2.2e-16; lm(formula = LST ~ NDVI + NDBI, data = LUONGSON)
As Table 6 shows the relationships between
the LST and other independent variables
(NDVI, NDBI). This study selected the Model
5 as the most suitable model for LST prediction
in Luong Son district. As the Model 5 shows the
LST is negatively and positively related to
NDVI and NDBI, respectively. In other word,
one unit decrease in the NDVI and one unit
increase in the NDBI would be an increase of
32.7 units in the LST. Therefore, the Model 5
used to predict the LST from NDVI and NDBI
is as follow: LST = 29.7155 – (2.7114 x NDVI)
+ (5.6510 x NDBI), R2= 0.617.
4. CONCLUSION
The study concludes that Landsat-8 data is
useful for estimating the LST, NDVI, and NDBI.
NDVI used for land use and land cover mapping
is reliable with the overall accuracy assessments
of 92.0% and Kappa coefficient of 0.85. The
high LST is recorded in Luong Son district where
there are low vegetation cover and high built-up
land. LST has indirect proportion to vegetation
cover, but direct proportion to built-up land. The
multiple regression model is very useful for the
responsible predictor of land surface temperature
(LST). The study has developed 37 linear
regression models based on four parameters
(NDVI, NSMI, NDBI, and slope). All of the
developed models could be used to predict the
LST in Luong Son district. However, the study
finally selected the most suitable model which is
best represented the relationships between the
LST and NDVI and NDBI (Model 5, R2 = 0.617)
for Luong Son district.
The selected model confirms that an increase
of built-up land (NDBI) and loss of vegetation
cover (NDVI) become a serious threat to the
increase in land surface temperature. The study
also concludes that further parameters like
rainfall, humidity, elevation included may
improve the model. Vegetation plays a most
significant role in mitigating the increasing land
surface temperature, and built-up land
expansion would be one of the main responsible
drivers for the increase of land surface
temperature. It suggests that it is very difficult
to reduce the built-up land as the population has
been growing. The only way to mitigate this risk
is to increase additional vegetation cover in the
built-up land; to both protect the existing forests
and promote afforestation activities, which can
considerably reduce the land surface
temperature.
REFERENCES
1. Acharya, B.S., Hao, Y., Ochsner, T.E., Zou, C.B.
(2016). Woody plant encroachment alters soil
hydrological properties and reduces downward flux of
water in tallgrass prairie. Plant and Soil. 1–13.
2.
Adulkongkaew,
T.,
Satapanajaru,
T.,
Charoenhirunyingyos, S., Singhirunnusorn, W. (2020).
Effect of land cover composition and building
configuration on land surface temperature in an urbansprawl city, case study in Bangkok Metropolitan Area,
Thailand, Heliyon 6 (2020) 04485
3. Afrin, A., Gupta, A., Farjad, B., Ahmed, M.R.,
Achari, G., Hassan, Q.K. (2019). Development of Landuse/Land-cover maps using Landsat-8 and MODIS data
and their integration for hydro-ecological applications.
Sensors. 19:4891.
4. Agapiou, A. (2020). Estimating Proportion of
Vegetation Cover at the Vicinity of Archaeological Sites
Using Sentinel-1 and -2 Data, Supplemented by Crowd
sourced Open Street Map Geodata. Appl. Sci. 10, 4764.
5. Ahmed, M., Else, B., Eklundh, L., Ardö, J.,
Seaquist, J. (2017). Dynamic response of NDVI to soil
JOURNAL OF FORESTRY SCIENCE AND TECHNOLOGY NO. 11 (2021)
91
Management of Forest Resources and Environment
moisture variations during different hydrological regimes
in the Sahel region, Int. J. Remote Sens.
6. Alonso, C., López, P., Benito, R.S., Tarquis, A.M.
(2019). Correlation between vegetation index and soil
moisture index using sentinel-2. Estudios en la Zona No
Saturada Del Suelo Vol. Xiv. Zns’19.
7. Anandababu, D., Purushothaman, B. M., & Suresh,
B. S. (2018). Estimation of land surface temperature
using Landsat 8 data. International Journal of Advance
Research, Ideas and Innovations in Technology, 4(2),
177-186.
9. Anderson, J. R., Hardy, E.E., Roach, J.T. and
Witmer, R.E. (1976). A Land Use and Land Cover
Classification System for Use with Remote Sensor
Data. Geological Survey Professional Paper 964.
10. Ansar, K., Soumendu, C., Yupeng, W. (2021).
Urban Heat Island Modeling for Tropical Climates. 9780-12-819669-4.
11. Avdan, U., Jovanovska, G. (2016). Algorithm for
automated mapping of land surface temperature using
Landsat 8 satellite data. Journal of Sensors. 1– 8.
12. Bharath, S., Rajan, K.S., Ramachandra, T.V.
(2013). Land surface temperature responses to land use
land cover dynamics. Geoinfor Geostat. 54:50–78.
13. Bhatti, S. S. and Tripathi, N. K. (2014). Built-up
area extraction using Landsat 8 OLI imagery. GIS
science Remote Sens., vol. 51, no. 4, pp. 445–467, 2014.
14. Bokaie, M., Zarkesh, M.K., Arasteh, P.D.,
Hosseini, A. (2016). Assessment of Urban Heat Island
based on the relationship between land surface
temperature and Land Use/ Land Cover in Tehran.
Sustain Cities Soc. 23:94–104
15. Carlson, T.N., Arthur, S.T. (2000). The impact of
land use—land cover changes due to urbanization on surface
microclimate and hydrology: a satellite perspective. Global
and Planetary Change. 25(1–2):49–65.
16. Chi, Y., Sun, J., Sun, Y., Liu, S., Fu, Z. (2020).
Multi-temporal characterization of land surface
temperature and its relationships with normalized
difference vegetation index and soil moisture content in
the Yellow River Delta, China. Global Ecology and
Conservation. 23, e01092.
17. Chuai, X.W., Huang, X.J., Wang, W.J., Bao, G.
(2013). NDVI, temperature and precipitation changes and
their relationship with different vegetation types during
1998–2007 in Inner Mongolia, China. Int J Climatol.
33:1696–706.
18. Dinh, N.T., Ha, N.T.T., Quy, D.T., Koike, K.,
Nhuan, M.T. (2019). Effective Band Ratio of Landsat 8
Images Based on VNIR-SWIR Reflectance Spectra of
Top soils for Soil Moisture Mapping in a Tropical
Region. Remote Sens. 11:716.
19. Fabre, S., Briottet, X., Lesaignoux, A., Avenue,
B.P., Belin, E., Cedex, F.-T. (2015). Estimation of Soil
Moisture Content from the Spectral Reflectance of Bare
Soils in the 0.4–2.5 µm Domain. Sensors ISSN 3262–
3281.
92
20. Foody, G. M. (2002) Status of land cover
classification accuracy assessment. Remote Sensing of
Environment. 80:185–201.
21. Foody, G.M. (2013). Ground reference data error
and the mis-estimation of the area of land cover change
as a function of its abundance. Remote Sensing Letters.
4:783-792.
22. Hai-Hoa, N., Lan, T.T.N., An, L.T., Nghia, N.H.,
Linh, D.V.K., Thu, N.H.T., Bohm, S., Premnath, C.F.S.
(2020). Monitoring changes in coastal mangrove extents
using multi-temporal satellite data in selected communes,
Hai Phong city, Vietnam. Forest and Society. 4 256–70.
23. Hai-Hoa, N., Nghia, N. H., Nguyen, H. T. T., A.
L. T., Lan, T. T. N., Linh, D. V. K., Furniss, M. J. (2020).
Classification methods for mapping mangrove extents
and drivers of change in Thanh Hoa province, Vietnam
during 2005-2018. Forest and Society. 4, (1), 225–242.
24. Haubrock, S.N., Chabrillat, S., Lemmnitz, C.,
Kaufmann, H. (2008). Surface soil moisture
quantification models from reflectance data under field
conditions. Int. J. Remote Sens. 29, 3–29.
25. Hong, Y.S., Yu, L., Chen, Y.Y., Liu, Y. (2017).
Prediction of soil organic matter by Vis-NIR
spectroscopy using normalized soil moisture index as a
proxy of soil moisture. Remote Sens. 10(1):28.
26. Jeevalakshmi, D., Narayana Reddy, S., Manikiam,
B. (2017). Land surface temperature retrieval from
LANDSAT data using emissivity estimation. Int. J. Appl.
Eng. Res. 12:9679–9687.
27. Jeevalakshmi, D., Reddy, D.N., Manikiam, B.,
(2017). Land surface temperature retrieval from Landsat
data using emissivity estimation. International Journal of
Applied Engineering Research ISSN 0973- 4562 2(20):
9679- 9687.
28. Jiang, J., Tian, G. (2010). Analysis of the impact
of Land use, land cover change on Land Surface
Temperature with Remote Sensing. Procedia
Environmental Sciences. 2:571–575.
29. Kim, H.J., Ryu, J.H., Seo, M.J., Lee, C.S.,Han,
K.S. (2014). Approximate estimation of soil moisture
from NDVI and land surface temperature over Andong
region, Korean. Korean Journal of Remote Sensing.
30(3):375-381.
30. Kumar, D., Shekhar, S. (2015). Statistical analysis
of land surface temperature-vegetation indexes
relationship through thermal remote sensing. Ecotoxicol
Environ. Saf. 121:39–44.
31.
Luong
Son
Government.
(2016).
luongson.hoabinh.gov.vn
32. Malo, A., Nicholson, S., (1990). A study of
rainfall and vegetation dynamics in the African Sahel
using normalized difference vegetation index. J. Arid
Environ. 19:1–24.
33.
Mavi,
H.S.,
Tupper,
G.J.
(2004).
Agrometeorology: Principles and Application of Climate
Studies in Agriculture. Binghamton, NY, USA: Food
Products Press
JOURNAL OF FORESTRY SCIENCE AND TECHNOLOGY NO. 11 (2021)
Management of Forest Resources and Environment
34. Meng, X., Cheng, J., Zhao, S., Liu, S., Yao, Y.
(2019). Estimating Land Surface Temperature from
Landsat-8 Data using the NOAA JPSS Enterprise
Algorithm. Remote. Sens. 11:155.
35. Meng, X., Zhao, J., Liu, S., Yao, Y., (2019).
Estimating land surface temperature from Landsat-8 data
using the NOAA JPSS enterprise Algorithm. Remote
Sensing. 11:155. doi:10.3390/rs11020155
36. Mohajane, M., Essahlaoui, A., Oudija, F.,
Hafyani, M.E., Hmaidi, A.E., Ouali, A.E. (2018). Land
use/land cover (LULC) using Landsat data series (MSS,
TM, ETM+ and OLI) in Azrou Forest, in the Central
Middle Atlas of Morocco. Environments. 5(12): 131147.
37. Morabito, M., Crisci, A., Messeri, A., Orlandini, S.,
Raschi, A., Maracchi, G., Munafò, M. (2016). The impact of
built-up surfaces on land surface temperatures in Italian
urban areas. Sci. Total Environ. 551–552, 317–326.
38. Mutiibwa, D., Strachan, S., Albright, T. (2015).
Land surface temperature and surface air temperature in
complex terrain. IEEE Journal of Selected Topics in
Applied Earth Observations and Remote Sensing.
8(10):4761–4774.
39. Neinavaz, E., Skidmore, A.K., Darvishzadeh, R.
(2020). Effects of prediction accuracy of the proportion
of vegetation cover on land surface emissivity and
temperature using the NDVI threshold method. Int. J.
Appl. Earth Obs. Geoinf. 85:1–13.
40. Nocita, M., Stevens, A., Noon, C., Van Wesemael,
B. (2013). Prediction of soil organic carbon for different
levels of soil moisture using VIS–NIR spectroscopy.
Geoderma. 199:37–42.
41. Pablos, M., Martínez-Fernández, J., Piles, M.,
Sánchez, N., Vall-llossera, M., Camps, A. (2016). MultiTemporal Evaluation of Soil Moisture and Land Surface
Temperature Dynamics Using in Situ and Satellite
Observations. Remote Sens. 2016, 8, 587.
42. Padró, J.C., Pons, X., Aragonés, D., DíazDelgado, R., García, D., Bustamante, J., Pesquer, L.,
Domingo-Marimon, C., González-Guerrero, O.,
Cristóbal, J., (2017). Radiometric Correction of
Simultaneously Acquired Landsat-7/Landsat-8 and
Sentinel-2A Imagery Using Pseudoinvariant Areas
(PIA): Contributing to the Landsat Time Series Legacy.
Remote Sens. 9:1319.
43. Rajeshwari, A. and Mani, N. (2014) Estimation of
land surface temperature of dindigul district using landsat
8 data. International Journal of Research in Engineering
and Technology, vol. 3, no. 5, pp. 122–126, 2014.
44. Rogan, J., Chen, D. (2004). Remote sensing
technology for mapping and monitoring land-cover and
land-use change. Progress in planning. 61(4):301-325.
45. Saravanan, S., Jegankumar, R., Selvaraj, A.,
Jacinth Jennifer, J., Parthasarathy, K.S.S. (2019). Utility
of landsat data for assessing mangrove degradation in
Muthupet Lagoon, South India. Coastal Zone
Management. 471–484.
46. Schnur, M.T., Hongjie, X., Wang, X. (2010).
Estimating root zone soil moisture at distant sites using
MODIS NDVI and EVI in a semi-arid region of
southwestern USA. Ecol Inform. 5:400–9.
47. Seaquist, J.W., Olsson, L., Ardö, J. (2003). A
remote sensing-based primary production model for
grassland biomes. Ecological Modelling. 169(1):131–
155.
48. Sellers, P.J., Berry, J.A., Collatz, G.J., Field, C.B.,
Hall, G.F. (1992). Canopy reflectance, photosynthesis,
and transpiration. III. A reanalysis using improved leaf
models and a new canopy integration scheme. Remote
Sens Environ. 42(3):187–216.
49. Shimizu, K., Ota, T., Mizoue, N., Yoshida, S.,
(2018). Assessments of preprocessing methods for
Landsat time series images of mountainous forests in the
tropics. Journal of Forest Research.
50. Singh, R.P., Singh, N., Singh, S., Mukheriee, S.
(2016). Normalized Difference Vegetation Index (NDVI)
based classification to assess the change in land use/land
cover (LULC) in lower Assam, India. International
Journal of Advanced Remote Sensing and GIS.
5(10):1963- 1970.
51. Song, C., Woodcock, C.E., Seto, K.C., Lenney,
M.P., Macomber, S.A. (2001). Classification and Change
Detection Using Landsat TM Data: When and How to
Correct Atmospheric Effects? Remote Sens. Environ. 75:
230–244.
52. Thomlinson, J.R., Bolstad, P.V., Cohen, W.B.
(1999). Coordinating methodologies for scaling land
cover classifications from site-specific to global: steps
toward validating global map products. Remote Sensing
of Environment: 70:16 – 28.
53. Tso, B., Mather, P.M. (2001). Classification
Methods for Remotely Sensed Data. London: Taylor &
Francis. 2001.
54. Wang, T., Wedin, D.A., Franz, T.E., Hiller, J.
(2015). Effect of vegetation on the temporal stability of
soil moisture in grass-stabilized semi-arid sand dunes.
Journal of Hydrology. 521:447–59.
55. Xiao, H., Weng, Q. (2007). The impact of land use
and land cover changes on land surface temperature in a
karstarea of China. J. Environ. Manag. 85(1):245–257
56. Xie, Y., Sha, Z., Yu, M. (2008). Remote sensing
imagery in vegetation mapping: a review. Journal of
Plant Ecology. 1(1):9- 23.
57. Xu, Hanqiu. (2015). Retrieval of the reflectance
and land surface temperature of the newly-launched
Landsat 8 satellite. Chinese Journal of Geophysics.
58:741-747.
58. Zhang, Y. Z., Jiang, X. G., Wu, H., Jiang, Y. Z.,
Liu Z. X., Cheng, H. (2017). Land Surface Temperature
and Emissivity Separation from Cross-Track Infrared
Sounder Data with Atmospheric Reanalysis Data and
ISSTES Algorithm. Advances in Meteorology, vol. 2017,
Article ID 7398312, 10 pages.
JOURNAL OF FORESTRY SCIENCE AND TECHNOLOGY NO. 11 (2021)
93
Management of Forest Resources and Environment
MỐI TƯƠNG QUAN GIỮA NHIỆT ĐỘ BỀ MẶT ĐẤT VỚI CHỈ SỐ THỰC
VẬT VÀ ĐỘ ẨM ĐẤT BẰNG DỮ LIỆU ẢNH LANDSAT-8
TẠI HUYỆN LƯƠNG SƠN, TỈNH HỒ BÌNH
Võ Đại Ngun1, Nguyễn Hải Hịa1*, Nguyễn Quyết1, Phạm Duy Quang1
1
Trường Đại học Lâm nghiệp
TÓM TẮT
Nhiệt độ bề mặt đất (LST) là một trong những nhân tố sinh thái quan trong các q trình sinh địa hố tự nhiên.
Dữ liệu viễn thám, bao gồm dữ liệu Landsat-8, cho phép chúng ta nghiên cứu và hiểu rõ hơn các q trình trên
một cách nhanh chóng và hiệu quả. Đề tài đã sử dụng dữ liệu Landsat-8 OLI/TIRS để xây dựng bản đồ sử dụng
đất và độ che phủ đất 2020 bằng ngưỡng phân loại chỉ số NDVI, tính tốn các chỉ số LST (nhiệt độ bề mặt đất),
NSMI (chỉ số độ ẩm đất), NDVI (chỉ số thực vật), NDBI (chỉ số về khác biệt xây dựng) và độ dốc phục vụ việc
xây dựng mơ hình tương quan tại huyện Lương Sơn, tỉnh Hịa Bình. Các mơ hình thể hiện mối quan hệ giữa LST
và các biến độc lập (NDVI, NSMI, NDBI và Độ dốc) bằng phần mềm thống kê R. Kết quả đã xây 37 mơ hình
hồi quy tuyến tính thể hiện mối tương quan giữa LST với các chỉ số và độ dốc, trong đó mơ hình 5 được lựa chọn
và sử dụng để dự đoán LST tại huyện Lương Sơn. Mơ hình được lựa chọn cho thấy sự gia tăng đất xây dựng
(NDBI) và mất lớp phủ thực vật (NDVI) trở thành mối đe dọa nghiêm trọng đối với sự gia tăng nhiệt độ bề mặt
đất ở huyện Lương Sơn. Kết quả của thấy mơ hình cho thấy rằng sự gia tăng lớp phủ thực vật sẽ dẫn đến suy
giảm nhiệt độ bề mặt đất và việc mở rộng đất xây dựng sẽ là một trong những nguyên nhân chính gây ra sự gia
tăng LST. Giải pháp duy nhất để giảm thiểu rủi ro này là tăng cường lớp phủ thực vật bổ sung trong khu vực đơ
thị, dân cư; bảo vệ các diện tích rừng hiện có, thúc đẩy các hoạt động trồng rừng. Các giải pháp sẽ góp phần làm
giảm đáng kể sự gia tăng nhiệt độ bề mặt đất.
Từ khóa: Landsat, mơ hình, NDVI, NSMI, nhiệt độ bề mặt đất.
Received
: 14/5/2021
Revised
: 18/6/2021
Accepted
: 25/6/2021
94
JOURNAL OF FORESTRY SCIENCE AND TECHNOLOGY NO. 11 (2021)