HEMODYNAMICS – NEW DIAGNOSTIC AND THERAPEUTIC APPROACHES potx
Bạn đang xem bản rút gọn của tài liệu. Xem và tải ngay bản đầy đủ của tài liệu tại đây (10.43 MB, 164 trang )
HEMODYNAMICS –
NEW DIAGNOSTIC
AND THERAPEUTIC
APPROACHES
Edited by
A. Seda Artis
HEMODYNAMICS –
NEW DIAGNOSTIC
AND THERAPEUTIC
APPROACHES
Edited by A. Seda Artis
Hemodynamics – New Diagnostic and Therapeutic Approaches
Edited by A. Seda Artis
Published by InTech
Janeza Trdine 9, 51000 Rijeka, Croatia
Copyright © 2012 InTech
All chapters are Open Access distributed under the Creative Commons Attribution 3.0
license, which allows users to download, copy and build upon published articles even for
commercial purposes, as long as the author and publisher are properly credited, which
ensures maximum dissemination and a wider impact of our publications. After this work
has been published by InTech, authors have the right to republish it, in whole or part, in
any publication of which they are the author, and to make other personal use of the
work. Any republication, referencing or personal use of the work must explicitly identify
the original source.
As for readers, this license allows users to download, copy and build upon published
chapters even for commercial purposes, as long as the author and publisher are properly
credited, which ensures maximum dissemination and a wider impact of our publications.
Notice
Statements and opinions expressed in the chapters are these of the individual contributors
and not necessarily those of the editors or publisher. No responsibility is accepted for the
accuracy of information contained in the published chapters. The publisher assumes no
responsibility for any damage or injury to persons or property arising out of the use of any
materials, instructions, methods or ideas contained in the book.
Publishing Process Manager Sasa Leporic
Technical Editor Teodora Smiljanic
Cover Designer InTech Design Team
First published April, 2012
Printed in Croatia
A free online edition of this book is available at www.intechopen.com
Additional hard copies can be obtained from
Hemodynamics – New Diagnostic and Therapeutic Approaches, Edited by A. Seda Artis
p. cm.
ISBN 978-953-51-0559-6
Contents
Preface VII
Chapter 1 The Evaluation of Renal Hemodynamics with
Doppler Ultrasonography 1
Mahir Kaya
Chapter 2 Integrated Physiological Interaction Modeling and
Simulation for Aerobic Circulation with
Beat-by-Beat Hemodynamics 31
Kenichi Asami and Mochimitsu Komori
Chapter 3 Hemodynamics Study Based on Near-Infrared
Optical Assessment 47
Chia-Wei Sun and Ching-Cheng Chuang
Chapter 4 How Ozone Treatment Affects Erythrocytes 69
Sami Aydogan and A. Seda Artis
Chapter 5 Regulation of Renal Hemodyamics by Purinergic Receptors in
Angiotensin II –Induced Hypertension 85
Martha Franco, Rocío Bautista-Pérez and Oscar Pérez-Méndez
Chapter 6 Carnosine and Its Role on the Erythrocyte Rheology 105
A. Seda Artis and Sami Aydogan
Chapter 7 Soluble Guanylate Cyclase Modulators in Heart Failure 121
Veselin Mitrovic and Stefan Lehinant
Chapter 8 Advantages of Catheter-Based Adenoviral Delivery of Genes
to the Heart for Studies of Cardiac Disease 131
J. Michael O’Donnell
Preface
Hemodynamics is study of the mechanical and physiologic properties controlling
blood pressure and flow through the body. The factors influencing hemodynamics are
complex and extensive but include CO, circulating fluid volume, respiration, vascular
diameter and resistance, and blood viscosity. Each of these may in turn be influenced
by various physiological factors, such as diet, exercise, disease, drugs or alcohol,
obesity and excess weight.
A significant majority of all cardiovascular diseases and disorders is related to
systemic hemodynamic dysfunction. Hypertension and congestive heart failure are
two best known systemic hemodynamic disorders. Also microcirculatory alterations
have been repeatedly observed in many physiological conditions and patients with
various pathologies such as cardiovascular diseases. To evaluate cardiac functions and
peripheral vascular physiologic characteristics hemodynamic monitoring is done. In
practice there are both invasive and noninvasive techniques that can be used to
determine the hemodynamic status. Generally more severe and more persistent
alterations are observed in patients with a poor outcome.
Today many scientists and clinicians are trying to better understand the mechanisms
of the hemodynamic changes and to improve the hemodynamic status. So this book is
written by expert researchers to address new diagnostic and therapeutic approaches
under the scope of hemodynamics.
I wish to thank my family for their support and the authors of each individual chapter
for their contribution in summarizing their most relevant findings. I hope that our
efforts will not go down the drain.
A. Seda Artis
Physiology Department, School of Medicine,
Istanbul Medeniyet University,
Istanbul,
Turkey
1
The Evaluation of Renal Hemodynamics with
Doppler Ultrasonography
Mahir Kaya
Department of Surgery, Faculty of Veterinary Medicine, Atatürk University, Erzurum
Turkey
1. Introduction
Gray-scale renal ultrasonography (US) is still performed as a matter of course during the
initial evaluation of both native and transplant renal dysfunction. The results, however,
often fail to impact on the differential diagnosis or management of renal diseases. Despite
major technological advances, gray-scale renal US has remained largely unchanged since the
1970s. It provides only basic anatomical data, such as renal length, cortical thickness, and
collecting system dilatation grades. While these may assist in the analysis of disease
chronicity, ultrasonographic findings are often normal in spite of the presence of severe
renal dysfunction. Clinicians and radiologists are agreed that even the increased renal
echogenicity accompanied by renal failure (medical renal disease) requires greater
specificity and sensitivity to make it clinically relevant. Collecting system dilatation
detection is reliable, though it is not always possible to distinguish between obstructive and
non-obstructive pelvicaliectasis on the basis of gray-scale US alone. This purely anatomic
approach to renal US, combined with other improved and more economical modalities, has
led to nephrologists, internists, and urologists becoming more involved in the field of
radiology (Tublin et al., 2003).
Doppler ultrasonographic examination of vascular structures is a fundamental diagnostic
technique and one that can also be used to examine organs. Doppler ultrasonographic
examination of the kidney, a particularly highly perfused organ, increases the effectiveness
of the technique. Color, power and spectral Doppler also supply additional hemodynamics
data in addition to the morphological analysis. Renal and extrarenal pathologies as well as
other factors also alter renal hemodynamics. Hemodynamic change can be distinguished by
variation in intrarenal arterial waveforms. Color Doppler accelerates and facilitates imaging,
while duplex Doppler US provides quantitative hemodynamic data. Diseases impacting on
organ blood flow may be further characterized by duplex Doppler US. Quantitative Doppler
ultrasonographic data include blood flow velocities and volumes. Semi-quantitative data
include the indices calculated from blood flow velocities obtained from the spectral Doppler
spectrum in renal vessels during the cardiac cycle. These establish resistance to blood flow
in the vascular lumen and are a significant source of information about organ perfusion.
Three major indices are used in clinical practice: the Systole - Diastole (S/D) ratio, the
Pulsatility Index (PI) and the Resistive Index (RI) (also known as the Pourcelot index,
resistivity index or resistance index).
Hemodynamics – New Diagnostic and Therapeutic Approaches
2
S /D = Peak Systolic Velocity / End Diastolic Velocity
PI = (Peak Systolic Velocity – End Diastolic Velocity) / Mean Velocity
RI = (Peak Systolic Velocity – End Diastolic Velocity) / Peak Systolic Velocity
Under normal homeostatic conditions the renal circulation offers low impedance to blood
flow throughout the cardiac cycle with continuous antegrade flow during diastole.
However, during conditions associated with increased renal vascular resistance, the
decrease in renal diastolic blood flow is more pronounced than the decrease in the systolic
component. During extreme elevations of renal vascular resistance diastolic flow may be
nondetectable or may even show retrograde propagation. Therefore, Doppler ability to
characterize altered waveforms in response to elevations of renal vascular resistance may be
used to calculate the RI and PI. They were initially introduced for the purpose of
determining peripheral vascular diseases. They are also used for the analysis of pathological
blood flow patterns and may possibly be used to discriminate among various
pathophysiological conditions of the kidney. Resistive index is more widely used than the
S/D ratio and PI. Doppler waveform studies are noninvasive, painless, readily available,
and relatively easy to perform and learn. Moreover, Doppler ultrasound obviates the need
for ionizing radiation and intravenous contrast material administration in situations in
which they may be undesirable, such as pregnancy, allergy and renal insufficiency
(Rawashdeh et al., 2001).
2. The renal doppler US technique
2.1 Human medicine
The patient has to fast for 8 h prior to the Doppler ultrasonographic examination of the
native kidney. The transducer must be positioned so as to visualize the lateral or
posterolateral aspect of the kidney. In this position, Doppler examination can be performed
with the lowest appropriate angle (0-60
0
), establishing an appropriate approach toward
vascular structures in the periphery of the hilus and permitting visualization of the kidney
without obstruction by gases present in the segments of the intestine and causing artifact.
Doppler analysis is then performed.
In intrarenal Doppler ultrasonographic examination, the majority of studies of the potential
that have used Doppler US for renal disease evaluation emphasize the importance of
applying the most careful technique. It is important to use the highest frequency probe gives
that measurable waveforms, with the additional use of color or power Doppler US as
appropriate for vessel localization. The arcuate arteries (at the corticomedullary junction) or
inter pyelocaliectasic lobar arteries (adjacent to the medullary pyramids) are subsequently
insonated with a 2-4 mm Doppler gate. The spectral samples/specimens from the arteries
must be analyzed once they have been obtained from three different sites (the cranial,
middle and caudal poles). Waveforms should be optimized for measurement by the use of
the lowest pulse repetition frequency without aliasing (to maximize waveform size), the
highest gain without obscuring background noise, and the lowest degree of wall filter. Three
to five reproducible waveforms from each kidney are obtained. Subsequently, the renal
Doppler values from these are averaged to establish mean RI and PI values for each kidney.
The Evaluation of Renal Hemodynamics with Doppler Ultrasonography
3
Once intrarenal Doppler evaluation of the kidney on the investigated side has been
completed, the main renal artery and/or veins are analyzed directly. Because of their
dimensions, colored Doppler imaging yields no significant contribution to the analysis of
these structures, in contrast to intrarenal examination, and gray-scale US is generally
employed. However, color Doppler examination is necessary in renal vein thrombosis.
The patient is placed in the decubitus or semi-decubitus position, with the kidney to be
examined on top, thus permitting transversal visualization of the kidney and including an
image of the abdominal aorta. The lateral tip of the transducer is angled slightly toward
the caudal aspect, permitting appropriate imaging of the course of the main arterial artery
or vein.
It is easier to investigate graft (transplanted) kidneys in the caudal abdomen, located close to
the abdominal wall and retroperitoneally, with gray-scale and Doppler US than native
kidneys. The hilus must be positioned posteromedially as the transplant kidney is
visualized. Gray-scale and intrarenal Doppler evaluations are then performed. Renal artery
and vein examination are performed with Doppler mode in the final stage of transplant
kidney examination (Platt, 1992; Rawashdeh et al., 2001; Ruggenenti et al., 2001; Tublin et
al., 2003; Zubarev, 2001).
2.2 Veterinary medicine
The main renal artery and vein in dogs and cats can be imaged from the hilus of the kidneys
as far as their point of origin from the aorta and to the caudal vena cava, respectively. Renal
artery diameters are calculated in systole on the basis of gray-scale echo mode. Doppler
measurements are performed at the same point (Fig. 1A). In intrarenal Doppler, interlobar
branches can be imaged in the proximity of the central echocomplex, since these radiate
from the pelvis in the direction of the corticomedullary junction. After branching into
arcuate arteries, interlobar arteries flow in the corticomedullary junction. Color Doppler
ultrasound can be used to observe the interlobular arteries originating from the arcuate
arteries in the cortex. The veins run parallel to the arteries. They are usually wider than the
adjacent arteries. The renal arteries exhibit a typical parabolic flow velocity profile (i.e.,
systolic peaks with broad velocity distribution and no spectral window). The systolic peak is
always broad, and it is sometimes possible to observe an early systolic peak. Low resistance
flow can be determined from a high, continuous diastolic flow, gradually declining during
diastole. Following the systolic peak, there is a slight fall in velocity, and then another
increase (diastolic peak velocity), gradually decreasing in the rest of the diastole (Fig. 1B).
Renal vein flow may exhibit minor changes because of changes in the right atrial and intra-
abdominal pressure. An increased forward flow wave follows each heartbeat. If the
contractions are in sufficiently close proximity, the next wave (on the Doppler tracing) is
superimposed on the previous one, resulting in faster flow. In the event of a more protracted
pause between ventricular contractions, the velocity slowly declines in the renal veins
superimposed on the previous one, again resulting in faster flow. If the pause between two
ventricular contractions is longer, velocity in the renal veins gradually declines; 3.5-7.5 MHz
linear or convex transducers can be used. Equipment settings are standardized, and should
include a minimum wall filter setting of 50 Hz and a Doppler sample volume between 1 and
3 mm (Szatmari et al., 2001).
Hemodynamics – New Diagnostic and Therapeutic Approaches
4
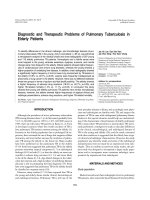
Fig. 1. Duplex Doppler ultrasound images of the left renal artery (A) and the left kidney (B),
exhibiting peak systolic blood flow velocity (S), end-diastolic blood flow velocity (D) and
early systolic peak (ESP) in a healthy dog.
3. Renal resistive index
3.1 Theory
Recent in vitro experiments at the University of Michigan have demonstrated the importance
of vascular compliance in RI analysis (Tublin et al., 2003, as cited in Bude & Rubin, 1999).
Compliance may be defined as the rate of volume change of a vessel as a function of
pressure. A pulsating artery expanding in systole and contracting in diastole is a visual
manifestation of the effect of compliance. The aim of the in vitro experiments was to assess
the impact on RI of changes in vascular resistance and compliance. RI was dependent on
vascular compliance and resistance. As compliance increased, it became increasingly less
dependent on resistance. With zero compliance it was totally independent of vascular
resistance. The same team performed another in vitro study in which RI decreased with
increases in the cross-sectional area of the distal arterial bed. This was again independent
from compliance and vascular resistance. Similar ex vivo results were produced in a series of
experiments from Albany Medical College (Tublin et al., 2003, as cited in Tublin et al., 1999).
A pulsatile perfusion system was used to perfuse rabbit kidneys ex vivo. Renal vascular
resistance, systole, diastole, pulse pressure, and pulse rate were controlled and monitored,
while RI was measured simultaneously. A linear relationship was determined between the
RI and changes in renal vascular resistance of a pharmacological nature. However, elevation
in RI could be related to non-physiological factors that cause in renal vascular resistance.
Changes in the RI observed with intense vasoconstriction were only very slightly greater
than RI measurement variability. However, RI was significantly affected by alterations in
driving pulse pressures. The experiments revealed a linear relationship between RI and the
pulse pressure index. The Albany group then performed a series of follow-up ex vivo
experiments intended to indirectly explore the effect on RI of changes in vascular
distensibility (Tublin et al., 2003, as cited in Murphy & Tublin, 2000). They subjected isolated
rabbit kidneys to pulsatile perfusion while the renal pelvis was pressurized via the ureter.
The team’s hypothesis was that subsequent increases in renal interstitial pressure would
reduce arterial distensibility and that this would be most apparent during diastole. Arterial
distensibility was indirectly assessed on the basis of changes in vascular conductance (flow
The Evaluation of Renal Hemodynamics with Doppler Ultrasonography
5
/ pressure). They determined that graded increases in renal pelvic pressures led to
heightened renal vascular resistance, and that lowered mean conductance led to a higher
conductance index (systolic conductance – diastolic conductance / systolic conductance)
and increased RI. Their findings emphasize the importance of the interaction among
vascular distensibility, resistance, and pulsatile flow in RI analysis. Claudon et al. (1999)
replicated many of these findings in a study assessing changes in pig renal blood flow
during acute urinary obstruction using contrast-enhanced harmonic sonography. The results
of these trials confirm that disease phenomena impacting on vascular distensibility, such as
renal artery interstitial fibrosis and vascular stiffening, may also substantially affect the RI.
The unsatisfactory nature of the results obtained using the RI to evaluate ureteral
obstruction may perhaps be ascribed to this body of experimental research. The high false-
negative rate attendant upon the technique may be due, in some cases, to low-grade,
extremely early obstruction or forniceal rupture. At the settings involved and with severe
long-standing obstruction, arterial distensibility will only be very slightly affected, since
interstitial pressures are relatively normal. The increased reliability of Doppler US in the
event of a furosemide challenge being used might also suggest the impact on renal blood
flow and the RI of acutely elevated interstitial pressures.
The complex interaction between renal vascular resistance and compliance may also partly
account for Doppler US’s inability to consistently differentiate types of intrinsic renal
disease. It is possible that early reports of elevated RIs with vascular–interstitial disease (but
without glomerulopathies) are primarily due to the lower levels of tissue and vascular
compliance associated with renal diseases of these kinds (and not only associated with
increased renal vascular resistance). Subsequent rather pessimistic reports may also be
ascribed to differing patient populations and mixed renal diseases; one isolated RI on its
own may not help in the differential diagnosis of intrinsic renal disease because of mixed
histology and varying effects on vascular compliance and resistance (Alterini et al., 1996;
Pontremoki et al., 1999; Shimizu et al., 2001).
3.2 Resistive index of normal kidneys
3.2.1 Human
3.2.1.1 Adults
A number of studies have cited a value of approximately 0.60 for a normal mean intrarenal
RI. The largest series so far (58 patients) reported a mean (± SD) RI of 0.60 ± 0.01 for subjects
without pre-existing renal disease (Keogan et al., 1996). Three previous studies cited similar
normal mean RI values of 0.64 ± 0.05 (21 patients) (Norris et al. 1984), 0.58 ± 0.05 (109
kidneys) (Platt et al., 1989a), and 0.62 ± 0.04 (28 patients) (Kim et al., 1992). The renal
vascular bed in a normal kidney exhibits low blood flow impedance, as reflected by
continuous forward flow in diastole in normal adult kidneys (Shokeir et al., 1997a). Most
sonographers now regard the upper threshold of the normal intrarenal RI in adults to be
0.70 (Platt et al., 1991a; Platt, 1992).
3.2.1.2 Children and the elderly
Recent studies have shown that mean intrarenal RI is age-dependent, particularly in infants
(Kuzmic et al., 2000; Murat et al., 2005; Sigirci et al., 2006; Vade et al., 1993; Wong et al.,
Hemodynamics – New Diagnostic and Therapeutic Approaches
6
1989). In children, the mean RI frequently exceeds 0.70 during the first year of life. A mean RI
of over 0.70 can be observed during the first four years of life at least (Andriani et al., 2001;
Bude et al., 1992). In humans, active plasma renin levels are sharply elevated at birth and
decrease gradually with age (Fiselier et al., 1984). By 4–8 years, active renin levels exceed those
in adults only very slightly. Other renal functional parameters also differ at birth from the
corresponding levels in adults. Renal blood flow rate, glomerular filtration rate and tubular
excretory capacity for sodium para-aminohippuric acid are lower at birth but generally assume
adult levels by the age of two. They usually do not mature concurrently. Maturation of renal
blood flow rate is, to some extent at least, due to a decrease in renal vascular resistance (Murat
et al., 2005). Sigirci et al. (2006) suggested that intrarenal RI was higher for children up to 54
months old than for adults. Therefore, the adult mean intrarenal RI criterion of 0.70 should be
applicable to children 54 months old and older. The age dependency of the intrarenal RI is
directly related to that of plasma renin and aldosterone levels in healthy children whom
Doppler parameters and blood analysis are evaluated synchronously.
The intrarenal RI values in patients aged over 60 tend to be higher than those in younger
adults (Rawashdeh et al., 2001; Terry et al., 1992). This may be ascribed to true renal
dysfunction in senescent kidneys and that is not solely due to misleading variations or an
age-dependent variability in the RI (Platt et al., 1994a). This suggestion is based on the fact
that elevated values in patients over 60 are correlated with compromised creatinine
clearance. Another study demonstrated that average RI levels increases by 0.002 on an
annual basis (Keogan et al., 1996). This is possibly due to a progressive decrease per decade
of some 10%, the result of functional and anatomical changes in the renal vasculature with
increasing age (Rawashdeh et al., 2001).
3.2.2 Animals
In a study involving 20 healthy young pigs, Rawashdeh et al. (2000) demonstrated a normal
RI range of 0.48 to 0.85 (0.63 ± 0.09). Pope et al. (1996) reported a 95% confidence interval
(CI) from 0.43 to 0.63 (0.53 ± 0.05) in another porcine study. Baseline values in studies on
rabbits vary between 0.51 ± 0.04 and 0.54 ± 0.11 (Chu et al., 2011; Kaya et al., 2010; Kaya et
al., 2011). An intrarenal RI range of 0.52 - 0.73 have been reported for healthy dogs (Nyland
et al., 1993), and of 0.44 – 0.71 for healthy cats (Rivers et al., 1996). Another study reported
an intrarenal RI was 0.61 ± 0.06 in 22 normal kidneys in dogs (Morrow et al., 1996). In 11
mongrel dogs, the RI range was 0.54 to 0.75 (0.64 ± 0.05) (Dodd et al., 1991a). However,
Ulrich et al. (1995) reported a 95% CI of 0.46 - 0.62 (0.54 ± 0.04) in six mongrel dogs. In a
study of healthy Persian cats, main renal artery RI values for the right kidney were 0.52 ±
0.07 and 0.55 ± 0.07 for the left kidney, with an intrarenal RI value obtained from the
interlobar arteries of 0.51± 0.07 (Carvalho & Chammas, 2011). Another study reported
intrarenal RI values for normal cats as 0.59 ± 0.05 for the right kidney and 0.56 ± 0.06 for the
left kidney, with no statistically significant differences observed between them (Nyland et
al., 1993). In another study, intrarenal RI values for mixed-breed cats were 0.61 ± 0.04, and
0.60 ± 0.07 for Turkish angora cats (Gonul et al., 2011). There is no considerable difference
among breeds, but species. Such findings may simply reflect the varied nature of the species
and breed studies’ inherent physiological qualities (Rawashdeh et al., 2001). Renal
dimensions and intrarenal RI have been correlated to the body weight of cats (Park et al.,
2008). Studies comping with the age-intrarenal RI relationship and renin–angiotension–
The Evaluation of Renal Hemodynamics with Doppler Ultrasonography
7
aldosterone system are limited. Mechanism by renin–angiotension–aldosterone system
plays a role has not been clearly established in dogs and its effect in clinic application is not
yet completely understood. In a study by Chang et al. (2010), the intrarenal RI in dogs
younger than 4 months was higher than in older dogs. Therefore, the use of 0.73 as the
upper limit for intrarenal RI in normal dogs is not appropriate for dogs younger than 4
months. They also stated that plasma renin activity was an important factor in the age
dependency of the RI in dogs <4 months of age (Chang et al., 2010).
An elevation in the mean intrarenal RI (>0.70) has been determined for the clinical diagnosis
of canine acute renal failure and congenital dysplasia. Considering RI greater than 0.70
abnormal, the sensitivity and specificity of the RI in differentiating between normal and
abnormal kidneys were shown to be 38 and 96%, respectively (Morrow et al., 1996). When
vascular resistance rises, diastolic blood flow is reduced to a greater degree than systolic
blood flow (Rifkin et al., 1987). The relatively greater decrease in end diastolic velocity
compared to peak systolic velocity then causes an elevation in RI and PI. The upper
threshold for RI and PI need to be established in order to identify an abnormally increased
vascular resistance. There are slight differences in the upper threshold (calculated as means
+ 2 standard deviations) for RI between various studies. Some suggest an upper value of
0.70 for cats and dogs (Morrow et al., 1996; Rivers et al., 1996). This is the same value as that
proposed as a limit for normal mean intrarenal RI in humans. Other studies have suggested
an upper value of 0.73 for dogs and 0.71 for cats (Nyland et al., 1993; Rivers et al., 1997a).
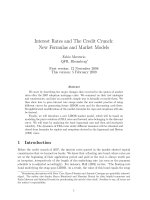
Fig. 2. Duplex Doppler ultrasound image of hydronephrotic kidney developed after the
right ureter ligation in an ovariohysterectomized cat. Increased intrarenal RI (0.88) in
intrarenal arterial flow pattern is shown.
Hemodynamics – New Diagnostic and Therapeutic Approaches
8
Novellas et al. (2007) suggested a similar upper threshold for the RI of 0.72 for dogs and 0.70
for cats (Fig. 2.). The same study suggests an upper level for intrarenal PI of 1.52 in dogs and
1.29 in cats. However, an earlier study suggested a mean intrarenal PI value of 0.80 ± 0.13
(Morrow et al., 1996) and emphasized that the upper threshold value should be 1.06 (Novellas
et al., 2007). However, no sensitivity and specificity were reported in these studies.
4. Factors affecting renal resistive index
4.1 Pulse and blood pressure
Tublin et al. (1999) reported a significant direct linear relationship between intrarenal RI and
pulse pressure. This suggests that RI increases in line with the widening of the pressure
difference between systole and diastole. In the event of an elevated RI being observed in a
patient with presumed normal kidneys, the data should be correlated with the patient’s
heart rate and blood pressure. Heart rate and blood pressure at physiological extremes can
alter the intrarenal RI without renal pathology being present. It is therefore important to
establish these two variables in order to interpret the intrarenal RI accurately. Significant
hypotension and a low heart rate can produce an elevation of RI without a true change in
renal vascular impedance (Mostbeck et al., 1990). Hypotension reduces diastolic volume in
the spectrum. This, in turn, leads to a significant elevation in RI value. Bradycardia and
hypertension also lead to elevated intrarenal RI. If blood pressure and heart flow are stable,
an increase in heart level causes intrarenal RI to fall. Tachycardia also leads to a fall in
intrarenal RI (Shokeir et al., 1997a).
4.2 Dehydration
The intrarenal RI values ≥0.70 have been reported in 54% of non-obstructed kidneys in
fasting children. The intrarenal RI resumes its normal value after hydration, indicating the
importance of oral hydration at least for the proper interpretation of Doppler studies
(Shokeir et al., 1996, 1997a).
4.3 Anesthesia
Doppler US is used in human medicine to determine blood flow without sedation.
However, sedation may be required prior to imaging in veterinary medicine for purposes of
restraint because poor patient cooperation, high respiratory and heart rates and voluntary
movement may interfere with the outcome, particularly in cases involving detailed
investigation, such as abdominal vascular US. Anesthetic agents may change systemic and
renal hemodynamics and subsequently impact on vascular resistance. Extensive data on the
cardiovascular effects of drugs can be obtained through Doppler flow technology using
high-resolution vessel images together with hemodynamic monitoring. A combination of
atropine, diazepam, acepromazine, and ketamine has been shown to reduce the intrarenal
RI in healthy dogs (Rivers et al., 1997b). Sedation with a combination of atropine,
acepromazine, and ketamine did not alter the intrarenal RI in cats (Rivers et al., 1996). Yet,
anesthesia with isofluorane did increase both the intrarenal RI and PI in cats (Mitchell et al.,
1998). In one study coping with the effects of short-term anesthetics on renal hemodynamics
it was shown that while propofol had a minimal effect, a xylazine-ketamine combination
and thiopental caused a significant drop in intrarenal RI (Kaya et al., 2011).
The Evaluation of Renal Hemodynamics with Doppler Ultrasonography
9
4.4 Extrarenal factors
The effect of vascular compliance on RI may account for the positive nature of studies
investigating the usefulness of Doppler US in assessing end-organ damage in patients with
hypertension and arteriosclerosis. Several recent studies showed that an elevated RI was
correlated with left ventricular hypertrophy and carotid intimal thickening (Alterini et al.,
1996; Pontremoki et al., 1999; Shimizu et al., 2001). Studies have also identified compression
as an extraneous factor capable of elevating intrarenal RI. Compression may result from the
effects of hematoma or another lesion occupying space and exerting pressure in the area
surrounding the kidney. Subcapsular or perinephric fluid collection has also been associated
with increased intrarenal RI in humans. Manual compression transmitted through the
ultrasound transducer may lead to false iatrogenic increases in intrarenal RI, as well
(Pozniak et al., 1988).
4.5 Renal medical diseases
Nephrologists and radiologists have long been frustrated by the lack of specificity inherent
in gray-scale examination in evaluating intrinsic renal disease. Although renal size, cortical
thickness, and echogenicity may be helpful in assessing disease chronicity, these are
typically of no assistance in the differential diagnosis or management of renal disease.
Doppler US possibly being able to serve as a useful adjunct for the gray-scale assessment of
renal disease was proposed in a series of papers by the University of Michigan team. In Platt
et al. (1990)’s preliminary research, 41 patients’ renal biopsy results were correlated with RI
analysis. In this study, normal RI values were determined in patients with isolated
glomerular disease (mean, 0.58), whereas subjects with vascular or interstitial disease had
significantly elevated RI values (means, 0.87 and 0.75, respectively).
Patriquin et al. (1989) reported an elevated RI during the anuric-oliguric phase of acute renal
failure in 17 children. Intrarenal RI has also been thought to exhibit strong correlation with
renal involvement in progressive systemic sclerosis (Aikimbaev et al., 2001). Hepatorenal
failure is a well-known complication associated with established liver disease. It is
characterized by early renal hemodynamic changes (vasoconstriction) prior to clinically
recognized kidney disease. It should be possible to detect this renal vasoconstruction
(increased renal vascular resistance) noninvasively by the use of Doppler US. It is also
possible to identify nonazotemic patients with liver disease, a subgroup at significantly
greater risk for subsequent kidney dysfunction and the hepatorenal syndrome using renal
duplex Doppler US (Platt et al., 1994b). Doppler US’s ability to identify latent hepatorenal
syndrome before liver transplantation was again demonstrated by the University of
Michigan group (Platt et al., 1992). Doppler US was useful outcome predictor in patients
with lupus nephritis: an elevated RI value was shown to predict poor renal outcome in a
prospective series involving 34 patients with various degrees of nephritis, including in
subjects with normal baseline renal functions (Platt et al., 1997). Doppler US has also been
proposed as a useful tool for the analysis of non-obstructive acute renal failure; an RI greater
than 0.07 was determined as a reliable discriminator between acute tubular necrosis and
prerenal failure (Platt et al., 1991b). Diabetes also affects intrarenal RI values; intrarenal RI is
particularly elevated in established diabetic nephropathy. The intrarenal RI may actually fall
to levels significantly below normal during the early stages of preclinical diabetic
nephropathy, which is probably associated with the state of decreased renal vascular
Hemodynamics – New Diagnostic and Therapeutic Approaches
10
resistance accompanying preglomerular vasodilatation in the early stages of diabetic kidney
involvement (Derchi et al., 1994; Platt et al., 1994a). The intrarenal RI has also found
adherents as a useful marker of diabetic nephropathy (Frauchiger et al., 2000; Soldo et al.,
1997). In contrast, other studies have suggested that Doppler US provides little more than
serum creatinine levels and creatinine clearance rates in patients with early diabetic
nephropathy and normal renal functions (Marzano et al., 1998; Okten et al., 1999; Sari et al.,
1999). The intrarenal RI is significantly greater in pregnant patients with pyelonephritis than
in pregnant women without pyelonephritis (Keogan et al., 1996b). Biopsy correlated studies
have verified these findings and assessed the role of the intrarenal RI for differentiating
among various renal medical diseases with encouraging results (Platt et al., 1990; Platt et al.,
1991b). Therefore, it may be difficult to diagnose unilateral obstruction in patients with a
known renal medical condition. However, renal medical disease is usually a bilateral
symmetrical affliction (Rawashdeh et al., 2001).
Earlier studies reported elevated renal vascular impedance with chronic hypertension
(Norris et al., 1989) and acute renal failure (Wong et al., 1989). The intrarenal PI and RI
would appear to be closely related to renal hemodynamic parameters and creatinine
clearance in patients with chronic renal failure and hypertension (Petersen et al., 1995). Platt
et al. (1989b) found elevated intrarenal RI in half of 50 patients with renal medical diseases.
An elevated intrarenal RI could therefore be due to renal disease or obstruction, in the
context of known medical renal disease and pyelocaliectasis, thus limiting the value of an
abnormal intrarenal RI in this particular situation.
In a dog with acute tubular necrosis intrarenal RI values were observed to be greater than
0.73, normalizing after effective treatment (Daley et al., 1994). One retrospective study
investigated intrarenal RI levels in 67 dogs with spontaneous non-obstructive renal disease.
Histopathological or cytological findings were present in 12 of these, four of which had
tubulointerstitial disease with or without glomerular disease, and three had glomerular
disease alone. Three of the four dogs with tubulointerstitial disease had intrarenal values
greater than 0.73, while lower values were observed in the three animals with glomerular
disease alone. The authors suggested that increased intrarenal RI was compatible with
tubulointerstitial, as opposed to glomerular disease (Marrow et al., 1996). In our clinical
observations, intrarenal RI may increase in dogs with pyelonephritis (Fig. 3.). The
correlation between serum creatinine concentration and intrarenal RI in humans is positive,
but weak. Proteinuria has not been associated with increased intrarenal RI in humans (Platt
et al., 1990, Platt 1992). Similarly, no statistically significant correlation between individual
dog and cat intrarenal RI and serum creatinine concentration was determined. Neither was
any statistically significant correlation identified between individual dog intrarenal RI and
urine protein-to-creatinine ratio in that study. Intrarenal RI values broadly overlapped
compared with urine output in cats with non-obstructive renal disease. The sensitivity was
reported to be 57%in dogs with increased intrarenal RI in determining non-obstructive renal
disease (tubulointerstitial or glomerular disease) (Rivers et al., 1997a). Another study
reported a sensitivity of 38% for increased intrarenal RI (>0.70) in the detection of non-
obstructive renal disease in 67 dogs. Sensitivity of 90% has been reported for increased
intrarenal RI in the determination of non-obstructive renal disease in azotemic cats.
Increased intrarenal RI has a 40% level of detection of renal obstruction in cats with
pelvicoureteral dilation during gray-scale US (Morrow et al., 1996). Increased intrarenal Rl
The Evaluation of Renal Hemodynamics with Doppler Ultrasonography
11
in dogs and cats with higher relative renal cortex echogenicity may be the result of renal
disease, as opposed to normal variation; further studies involving clinicopathological
analysis of such subjects are now required. Increased intrarenal RI values observed in
azotemic dogs with spontaneous non-obstructive renal disease are probably associated with
active tubulointerstitial, as opposed to glomerular disease. However, increased intrarenal RI
alone does not rule out the presence of glomerular disease. Renal Doppler evaluation of
intrarenal RI is useful as an ancillary diagnostic technique in azotemic dogs and cats with
non-obstructive renal disease. This is particularly the case when gray-scale US findings are
not definitive. Increased intrarenal RI can only be of restricted use in evaluating the severity
of concurrent renal dysfunction. Intrarenal RI may subsequently return to normal following
the administration of appropriate treatment in dogs with non-obstructive renal disease and
in cats with both non-obstructive and obstructive disease (Rivers et al., 1997a).
Fig. 3. Arterial and venous flow patterns in the right kidney of a dog with acute
pyelonephritis. The peak venous flow signal (A) and the least flow signal (B), used in
intrarenal venous impedance index, as well as elevated intrarenal arterial indexes are shown.
4.6 Renal neoplasias
Renal Doppler US does not contribute anything to gray-scale US in the diagnosis of simple
cysts representing the great majority of renal masses. In contrast, the blood flow spectrum
cannot be determined in septum cysts or in the presence of other solid components using
Doppler US. In malign renal neoplasias, a high-velocity and low-resistance arterial flow
spectrum associated with the hemodynamic characteristics of neovascularization originating
from arteriovenous relations and the high pressure difference caused by them can be
Hemodynamics – New Diagnostic and Therapeutic Approaches
12
observed. In benign neoplasia, on the other hand, no specific and measurable Doppler flow
spectrum has been reported. Blood flow velocities similar to those in the abdominal aorta
were reported in blood flow specimens obtained from renal cell carcinomas. Malign renal
neoplasia, and particularly renal cell carcinoma, exhibit vascular and especially venous
invasion. Thrombus in the renal vein or lumen of the inferior vena cava prevents the
formation of blood flow-associated colorization. In contrast to benign hemorrhagic
thrombus, blood flow signals can be determined by Doppler US in neoplastic thrombus.
When the renal vein is completely obstructed by thrombosis, the finding to be determined
with Doppler US is low, zero or below baseline diastolic volume in the intrarenal arterial
structures, in other words, elevated blood flow. Renal Doppler US is also useful in the
evaluation of masses inside the collecting system, such as renal parenchymal masses.
Determination of the vascular flow spectrum or Doppler signals obtained from such
neoplasia tumoral masses permits differentiation of non-neoplasia lesions such as coagulum
or debris, from collecting system neoplasias. However, Doppler signals may not be observed
in cases of deep localization or in which the lesions are small, or because the device or
transducer are not set at the optimal level (Kier et al., 1990; Ramos et al., 1988).
5. Renal pathologies affecting renal hemodynamics
5.1 Renal vascular pathologies
5.1.1 Renal artery stenosis and occlusion
Renal artery stenosis is most commonly caused by either fibromuscular dysplasia or
atherosclerosis. It may develop alone or in association with hypertension, renal insufficiency
(ischemic nephropathy), or both. As a cause of hypertension and renal ischemia, renal artery
stenosis resulting from atherosclerotic changes in the renal artery is now a serious concern,
as it often leads to end-stage renal failure (Scoble, 1999). Hemodynamically, significant
narrowing of the renal artery (a decrease in renal artery diameter ≥ 60%) leads to treatable
hypertension. Since renal angiography is invasive and requires the use of contrast material,
it is not widely used. In recent years, research has been focused on non-invasive diagnostic
techniques, which might reliably predict the outcome of blood pressure and renal function
after revascularization of renal artery stenosis. Renal artery stenosis is one of the most
frequent indications for renal Doppler ultrasonographic examination, and renal Doppler US
with a considerable reliability has been used in the diagnosis of renal artery stenosis and
occlusion since 1984 (Avasthi et al., 1984).
An elevated flow rate is one of the hemodynamic findings in renal artery stenosis. Studies
have shown that blood flow velocity is greater in the point of stenosis than normal renal
artery velocities. In addition to blood flow velocity, turbulence in the blood flow spectrum
post-stenosis is another important finding. The first studies regarded a blood flow velocity
of 100 cm/s as the upper limit, while later research suggested the limit should be 170 - 200
cm/s. In these studies sensitivity was 81% - 92% and specificity was 87% - 96% (Gottlieb et
al., 1995; House et al., 1999; Krumme et al., 1996; Miralles et al., 1996). However, the renal-
aortic ratio obtained by dividing the renal artery flow velocity by the abdominal aorta flow
velocity can be used to eliminate individual differences. A level ≥3.5 is regarded as
diagnostic for renal artery stenosis, and has a sensitivity of 92% and specificity of 76% in
renal artery stenosis diagnosis (Miralles et al., 1996). Various factors, such as the experience
of the physician performing the examination, patient cooperation, meteorism and obesity
The Evaluation of Renal Hemodynamics with Doppler Ultrasonography
13
improve the practicality of the technique. Because of these limitations, technical imaging is
easier in the diagnosis of renal artery stenosis, hemodynamic changes in the intrarenal
arteries are used. Changes in the acceleration parameters of the blood flow spectra obtained
from the level of the renal hilus can be used in the diagnosis of renal artery stenosis.
Accordingly, a delayed rise in peak systolic velocity, low flow velocity and a blunt peak
(pulsus tardus et parvus) and renal hemodynamic change in this vascular pathology make
the Doppler spectrum diagnostically important (Handa et al., 1986). Intrarenal Doppler
parameters such as decreased flow velocity, low RI (<0.50) and PI values, decreased
acceleration (<3 m/s
2
) and increased acceleration time (>70 m/s) are also considered in
renal artery stenosis (Bude and Rubin 1995). Comparison of intrarenal RI and PI values on
the side with pathology with the contralateral kidney also improves diagnostic success in
unilateral renal artery stenosis (Krumme et al., 1996; Riehl et al., 1997). Another study
suggested that the normal early systolic peak that should normally be observed disappears
(Stavros et al., 1992). The sensitivity of intrarenal Doppler parameters declines in cases with
high vascular resistance (RI > 0.70) (Stavros & Harshfield, 1994). Renal Doppler indices
return to normal following treatment of renal artery stenosis (Ozbek et al., 1993). When
renal artery and intrarenal Doppler parameters are considered together, sensitivity in the
diagnosis of renal artery stenosis is 89%, and specificity of 92% (Krumme et al., 1996).
Various renal pathologies, such as atherosclerosis, and trauma or iatrogenic causes may lead
to renal artery occlusion. In renal artery occlusions exhibiting acute development or with
insufficient collateralization, blood flow in the renal arteries cannot be imaged with color or
power Doppler, and the Doppler spectrum cannot be determined. At the same time, either a
very weak blood flow spectrum is obtained from the intrarenal arteries, or else arterial flow
cannot be established at all. For these reasons, the use of ultrasonographic contrast material
in the diagnosis of renal artery stenosis enhances the success of renal Doppler US. The
ultrasonographic contrast materials may make it easier to distinguish the renal arteries by
increasing the Doppler signal intensity and that the inadequacy stemming from the inability
to identify these arteries can thus be eliminated. Claudon et al. (2000) reported the sufficient
investigation level rose from 64 to 84% with the use of ultrasonographic contrast material.
Missouris et al. (1996) reported that with the use of SH U 508 A (Levovist ®), sensitivity in
diagnosis of renal artery stenosis rose from 85 to 94%, and specificity from 79 to 88%. At the
same time, while a shortening in investigation time has been reported with the use of these
contrast materials, the high price of ultrasonographic contrast materials means they are not
economical. Moreover, ultrasonographic contrast materials make a positive contribution in
the presence and evaluation of accessory arteries, which represent a significant limitation in
renal Doppler ultrasonographic examination and levels of observation of renal artery
stenosis rose to 77% (Melany et al., 1997).
5.1.2 Renal vein thrombosis
Renal vein thrombosis is a known cause and complication of renal diseases. The acute form
of this vascular pathology may arise in association with such causes as sudden water loss,
hypercoagulopathies, trauma, malignity and sepsis in children. One specific finding in gray-
scale ultrasonographic examination of renal vein thrombosis is an increased thickness in
renal parenchymal thickness. Decreased echogenicity in the renal cortex or a heterogeneous
appearance observed together with cystic areas are other findings determined in gray-scale
US. Increased renal cortex echogenicity is a finding that can appear in advance stages of
Hemodynamics – New Diagnostic and Therapeutic Approaches
14
pathology. Despite not being specific, increased dimension in the renal vein is regarded as a
non-specific finding. Thrombus inside the vein can be monitored in this pathology using
gray-scale US. No blood flow findings being determined at renal Doppler US is sufficient for
a diagnosis of renal vein thrombosis. Blood flow in the renal vein however may not be to
established due to faulty devices or settings. All device settings must therefore be optimal
for diagnosis. In addition, factors such as collapse of the renal vein due to inappropriate
Doppler angle or probe pressure or blood flow being too decreased to measure due to
valsalva can also have a negative impact on flow hemodynamics obtained from the renal
vein. In cases in which no results can be obtained from Doppler examination of the renal
vein, for reasons such as obesity or meteorism or in which direct imaging needs to be
supported, intrarenal Doppler examinations can be performed. Elevated flow resistance is
noteworthy among the intrarenal Doppler US findings for acute renal vein thrombosis. This
develops in association with insufficient venous drainage and/or intrarenal edema. This, in
turn, leads to high intrarenal RI and PI values. With a decrease in diastolic flow component,
or it being below the baseline, forward and backward blood flow specimens may arise in the
Doppler spectrum. These findings may lose specificity as a result of venous collaterals, such
as capsular veins in the native kidney, becoming involved. Diagnosis of chronic renal vein
thrombosis is more difficult than that of acute renal vein thrombosis. As with acute renal
vein thrombosis, the observation of thrombus inside the vein at gray-scale US, or no or only
partial blood flow findings from Doppler US can establish pathology. However, the kidney
and renal vein frequently being normal size and intrarenal Doppler findings not emerging
due to collateralization are factors complicating the diagnosis of chronic renal vein
thrombosis (Chen et al., 1998; Helenon et al., 1995; Zubarev, 2001)
5.1.3 Arteriovenous fistulas
Renal arteriovenous fistulas frequently arise as a result of renal biopsy or other medical
procedures. Renal Doppler US is quite successful in determining this pathology.
Arteriovenous fistulas of clinically insignificant size may even be identified in a noninvasive
form as a result of hemodynamic effects established by renal arteriovenous fistulas. High
velocity flow at the fistula level, a consequent color artifact in the surrounding tissue, high-
velocity and low-resistance arterial flow in the artery, and high-velocity and pulsatile
(observed with arterial spectrum) flow in the vein are some Doppler US findings of
arteriovenous fistulas. The focus of the high blood flow velocities determined from the level
of the arteriovenous fistula itself is a prominent finding (Helenon et al., 1995; Ozbek et al.,
1995). In color Doppler, adjustment of the color filter to high velocities and the elimination
of low velocities facilitate the diagnosis of arteriovenous fistulas (Edwards & Beggs 1987).
5.1.4 Aneurism and pseudoaneurism
Renal arterial aneurisms can easily be diagnosed in cases where the lesion is determined
with gray-scale ultrasound. A Doppler wave form is determined within the cystic structure
identified. Like arteriovenous fistulas, pseudoaneurisms are frequently of iatrogenic origin
and generally co-exist. Pseudoaneurisms are generally seen as cystic cavities within the
renal parenchyma that cause an arterial spectrum at Doppler analysis. Cystic structures may
gradually thrombose, either partly or completely (Chen et al., 1998; Zubarev, 2001).
The Evaluation of Renal Hemodynamics with Doppler Ultrasonography
15
5.2 Ureteral obstruction (obstructive uropathy)
Ureteral obstruction is one of the most important pathologies of the urinary system. Caused
by a number of factors, it may lead to kidney failure and is characterized by irreversible and
reversible destruction in the kidneys and ureter. Etiological factors include congenital,
acquired, and predisposing elements. As well as distinguishing between obstructive and
non-obstructive dilatation, the localization and extent of the obstructed area must also be
determined in order to avoid unnecessary surgery. The early diagnosis and release of
obstruction are essential if irreversible damage in the affected kidneys is to be prevented.
Various imaging methods are used in the diagnosis of ureteral obstruction, including
radiography, excretory urography, gray-scale US, Doppler US, computed tomography,
magnetic resonance imaging and percutaneous antegrade pyelography. The majority of
studies regarding renal Doppler US have concentrated the potential role of Doppler US in
evaluating ureteral obstruction.
5.2.1 Complete obstruction
Gray-scale examination for potential acute and chronic obstruction has been known to have
attendant limitations since the mid-‘80s. Ultrasonography provides purely anatomical data,
and these may be incomplete or absent: non-obstructive conditions (residual dilatation from
previously existing relieved obstruction, pyelonephritis, congenital malformation, reflux
and diuresis) may also give rise to collecting system dilatation. While conventional gray-
scale US only supplies an anatomical image of the changes (e.g., pelviureteric dilatation) in
ureteral obstruction, it may not be possible to distinguish between these potential causes using
gray-scale US alone. In other words, there may be non-obstructive dilatations, while collective
system dilatation may not be observable despite the presence of obstruction. Moreover, in an
acute context, obstruction may persist for several hours prior to collecting system dilatation. A
number of teams in the early 1990s hypothesized that urinary obstruction pathophysiology
could be reliably revealed by changes in arterial Doppler spectra (Platt et al., 1989a; 1989b;
Platt, 1992; Rodgers et al., 1992). This was the result of exhaustive animal studies
demonstrating unique biphasic hemodynamic response to complete ureteral obstruction.
5.2.1.1 Acute obstruction
Immediately after obstruction, renal blood flow increases in response to the elevation in
ureteric pressure. This generally lasts less than 1.5–2 h. It is thought to be the result of
preglomerular vasodilatation. This period of likely prostaglandin-mediated vasodilatation,
lasting less than 2 h, occurs immediately after obstruction. The following 2–4 h sees a
gradual fall in renal blood flow with continued elevation of pelvic and ureteric pressures,
which are probably the result of postglomerular vasoconstriction. Kim et al. (1997) used
unilateral lamb model an acutely obstructed and reported 29% decrease in total blood flow
in the obstructed side, compared to an increase in total blood flow in the unobstructed
kidney. Karaguzel et al. (2011) obtained similar findings using power Doppler in a study of
partial unilateral ureteral obstruction in rabbits (Fig. 4.). This implies that resistance is
increased on the obstructed side and reduced on the unobstructed side and that
contralateral obstruction on the unobstructed kidney produces a notable effect. Renal blood
flow thus declines, while renal vascular resistance increases. Initial research suggested that
this vasoconstriction response was to a large extent a mechanical one, the result of increases
in collecting system pressures. However, more recent studies suggest that complex
Hemodynamics – New Diagnostic and Therapeutic Approaches
16
interactions between several regulatory pathways (renin–angiotensin, kallikrein–kinin, and
prostaglandin–thromboxane) are in fact responsible for intense, postobstructive renal
vasoconstriction. Whatever the mediation involved, this vasoconstriction response appeared
ideal for by changes in the RI. Researchers from University of Michigan obtained RIs from
21 hydronephrotic kidneys prior to nephrostomy. The mean RI levels in 14 kidneys with
confirmed obstruction (0.77 ± 0.04) were higher compared to those from seven kidneys with
non-obstructive pelvicaliectasis (0.64 ± 0.04). Additionally, intrarenal RI values returned to
normal post-nephrostomy (Platt et al., 1989a). A subsequent larger study involving 229
kidneys largely corroborated these results. That study employed a discriminatory RI
threshold of 0.70; sensitivity and specificity of the Doppler diagnosis of obstruction were
determined as 92 and 88%, respectively (Platt et al., 1989b).
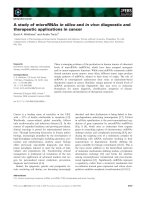
Fig. 4. Power Doppler ultrasound images of experimentally induced unilateral ureteral
obstruction in a rabbit. Colorization in the non-obstructed right kidney (A) is clear, whereas
in colorization of the interlobar vessels decreased and cortical colorization is absent in the
obstructed left kidney (B) at 3 hr post-obstruction.
5.2.1.2 Ureteral obstruction severely dilating the collecting system
Severe hydronephrotic kidney was shown to not exhibit any elevation in intrarenal RI,
despite the presence of what the authors regarded as obvious urinary obstruction (Platt et
The Evaluation of Renal Hemodynamics with Doppler Ultrasonography
17
al., 1989b). The lack of response might have been due to a marked decrease in absolute
blood flow in chronic high-grade obstruction, decreased filtration pressure produced by a
renal cortex functioning at a minimal level or elevated compliance in a capacious dilated
collecting system (Ulrich et al., 1995).
5.2.2 Partial ureteral obstruction
A number of reports (Brkljacic et al., 1994; Opdenakker et al., 1998; Rodgers et al., 1992;
Shokeir & Abdulmaaboud, 2001) have encourage various institutions to include RI analysis
in the sonographic evaluation of collecting system dilatation. However, anecdotal reports,
follow-up clinical trials, and animal studies have all had a negative effect on the clinical
impact of Doppler US (Chen et al., 1993; Cole et al., 1997; Coley et al., 1995; Deyoe et al.,
1995; Rawashdeh et al., 2001; Tublin et al., 1994). Doppler US was found to be of especially
limited use in the evaluation of partial ureteral obstruction. Chen et al. (1993), for example,
reported a sensitivity of Doppler US for the diagnosis of obstruction of only 52%. Although
the results of the examination were often positive with high-grade obstruction, most
patients with partial obstruction had normal RIs. Doppler US’s failure to reliably detect low-
grade obstruction was confirmed later in pig and rabbit models (Cole et al., 1997; Coley et
al., 1995; Kaya et al., 2010).
5.2.3 Comparison with the contralateral kidney without diuresis in obstuctive
uropathy
The accuracy of the discriminatory value of RI (0.70) can be improved by evaluating the
contralateral kidney. This is particularly the case in acute obstruction in which RI may still
be below the limit of 0.70. A difference of ≥0.10 between the obstructed and the contralateral
kidney further suggests the accuracy of the diagnosis (Platt et al., 1991a). Sensitivity rose
from 57 to 71% in acute obstruction with comparison of RI in the two kidneys in one study
(Rodgers et al., 1992). The obstructed to normal kidney RI ratio can also be helpful. Ulrich et
al. (1995) cited a ration of 1.15 as a diagnostic criterion of acute obstruction. Keller et al.
(1989) showed that with the RI ratio of ≥1.11, the sensitivity for determining obstruction was
77%, while the specificity for excluding obstruction was 81%, in a study involving 48
patients with unilateral obstruction and 34 healthy controls. Comparison with the
contralateral kidney is not naturally used an option in patients with bilateral renal
obstruction or with only one kidney (Shokeir et al., 1997a).
5.2.4 Diuresis in obstuctive uropathy (diuretic Doppler US)
A number of researchers have shown that it is possible to enhance the sensitivity of Doppler
US for the detection of partial obstruction by performing the evaluation after forced diuresis
(diuretic Doppler US) (Akata et al., 1999; Lee et al., 2001; Ordorica et al., 1993). Experimental
research has provided a theoretical basis for the use of diuretic Doppler US in the evaluation
of obstructive uropathy. An increase of RI of ≥15% after furosemide injection is regarded as
a diagnostic criterion of obstruction (Ordorica et al., 1993). Infusion of normal saline and
administration of furosemide have been shown to significantly enhance the sensitivity,
specificity and general accuracy of the use of RI in the diagnosis of obstructed kidneys in
children (Shokeir et al., 1996). Following induction of complete left-side ureteral obstruction,