Báo cáo " Calculation of Lindemann’s melting Temperature and Eutectic Point of bcc Binary Alloys " pot
Bạn đang xem bản rút gọn của tài liệu. Xem và tải ngay bản đầy đủ của tài liệu tại đây (102.57 KB, 8 trang )
VNU Journal of Science, Mathematics - Physics 26 (2010) 147-154
147
Calculation of Lindemann’s melting Temperature
and Eutectic Point of bcc Binary Alloys
Nguyen Van Hung
*
, Nguyen Cong Toan, Hoang Thi Khanh Giang
Department of Physics, University of Science, VNU
334 Nguyen Trai, Thanh Xuan, Hanoi, Vietnam
Received 1 June 2010
Abstract. Analytical expressions for the ratio of the root mean square fluctuation in atomic
positions on the equilibrium lattice positions and the nearest neighbor distance and the mean
melting curves of bcc binary alloys have been derived. This melting curve provides information on
Lindemann’s melting temperatures of binary alloys with respect to any proportion of constituent
elements and on their euctectic points. Numerical results for some bcc binary alloys are found to
be in agreement with experiment.
Keywords: Lindemann’s melting temperature, eutectic point, bcc binary alloys.
1. Introduction
The melting of materials has great scientific and technological interest. The problem is to
understand how to determine the temperature at which a solid melts, i.e., its melting temperature. The
atomic vibrational theory has been successfully applied by Lindemann and others [1-5]. The
Lindemann’s criterion [1] is based on the concept that the melting occurs when the ratio of the root
mean square fluctuation (RMSF) in atomic positions on the equilibrium lattice positions and the
nearest neighbor distance reaches a critical value. Hence, the lattice thermodynamic theory is one of
the most important fundamentals for interpreting thermodynamic properties and melting of materials
[1-6, 8-15]. The binary alloys have phase diagrams containing the liquidus or melting curve going
from the point corresponding the melting temperature of the host element to the one of the doping
element. The minimum of this melting curve is called the eutectic point. The melting is studied by
experiment [7] and by different theoretical methods. X-ray Absorption Fine Structure (XAFS)
procedure in studying melting [8] is focused mainly on the Fourier transform magnitudes and
cumulants of XAFS. The melting curve of materials with theory versus experiments [9] is focused
mainly on the dependence of melting temperature of single elements on pressure. The
phenomenological theory (PT) of the phase diagrams of the binary eutectic systems has been
developed [10] to show the temperature-concentration diagrams of eutectic mixtures, but a complete
“ab initio” theory for the melting transition is not available [11,16]. Hence, the calculation of melting
temperature curve versus proportion of constituent elements of binary alloy and its eutectic point still
remains an interesting problem.
______
*
Corresponding author. E-mail:
N.V. Hung et al. / VNU Journal of Science, Mathematics - Physics 26 (2010) 147-154
148
The purpose of this work is to develop a thermodynamic lattice theory for analytical calculation of
the mean melting curves and eutectic points of bcc binary alloys. This melting curve provides
information on Lindemann’s melting temperatures of binary alloys with respect to any proportion of
constituent elements and on the eutectic points. Numerical results for some bcc binary alloys are found
to be in agreement with experiment [7].
2. Formalism
The binary alloy lattice is always in an atomic thermal vibration so that in the lattice cell n the
atomic fluctuation function, denoted by number 1 for the 1
st
element and by number 2 for the 2
nd
element composing the binary alloy, is given by
(
)
(
)
∑∑
−−
+=+=
q
n
i
q
n
i
q
q
n
n
i
q
n
i
qn
eeee
q.Rq.Rq.Rq.R
uuUuuU
*
222
*
111
2
1
,
2
1
, (1)
t
i
t
i
q
q
q
q
ee
ω
ω
2211
, uuuu == , (2)
where
q
ω is the lattice vibration frequency and q is the wave number.
The atomic oscillating amplitude is characterized by the mean square displacement (MSD) or
Debye-Waller factor (DWF) [3, 12-15] which has the form
2
2
1
∑
=
q
q
W uK. , (3)
where K is the scattering vector equaling a reciprocal lattice vector, and
q
u is the mean atomic
vibration amplitude.
It is apparent that 1/8 atom on the vertex and one atom in the center of the bcc are localized in an
elementary cell. Hence, the total number of atoms in an elementary cell is 2. Then if on average s is
atomic number of type 1 and (2 - s) is atomic number of type 2, the quantity
q
u is given by
(
)
2
2
21 qq
q
ss uu
u
−
+
= . (4)
The potential energy of an oscillator is equal to its kinetic energy so that the mean energy of atom
k vibrating with wave vector q has the form
2
kqkq
uM
&
=ε . (5)
Hence, using Eqs. (2, 5) the mean energy of the crystal consisting of N lattice cells is given by
(
)
∑
−+=
∑
=
q
qqqqq
uMsusMN
q
2
2
2
2
2
1
2
1
)2( ωωεE
, (6)
where, M
1
, M
2
are the masses of atoms of types 1 and 2, respectively.
Using the relation between
q
u
2
and
q
u
1
[13], i.e.,
2112
/, MMmmuu
== , (7)
and Eqs. (5, 6) we obtain the mean energy for the atomic vibration with wave vector q
N.V. Hung et al. / VNU Journal of Science, Mathematics - Physics 26 (2010) 147-154
149
( )
[
]
2
211
2
2
2
msMsMuN
qqq
−+= ωε . (8)
The mean energy for this qth lattice mode calculated using the phonon energy with
q
n as the mean
number of oscillators is given by
qqq
n ωε h
+=
2
1
2 . (9)
Hence, comparing Eq. (8) to Eq. (9) we obtain
[ ]
s)m(sωNM
n
u
q
q
q
−+
+
=
2
2
1
2
1
2
1
h
. (10)
Using Eq. (4) and Eq. (7) the mean atomic vibration amplitude has the form
22
2
1
1
2
4
ussmu
. (11)
To study the MSD Eq. (3) we use the Debye model, where all three vibrations have the same
velocity [3]. Hence, for each polarization with taking Eq. (11) into account we get the mean value
( )
[ ]
2
1
2
2
2
2
2
1
2
12
1
3
1
qqq
umssKuKKu −+== . (12)
When taking all three polarizations the factor 1/3 is omitted, so that using Eq. (10) the MSD or
DWF Eq. (3) with all three polarizations is given by
[ ]
( )
[ ]
mssNM
n
mssKuKW
q
q
q
−+
+
−+==
∑∑
2
2
1
)2(
4
1
2
1
1
2
2
2
2
ω
h
. (13)
Transforming the sum over q into the corresponding integral [3], Eq. (13) is changed into the
following form
[ ]
ω
ωω
ω
ω
ω
d
e
M
mssKW
D
D
B
Tk
∫
+
−
−+=
0
3
3
1
2
2
3
2
1
1
1
)2(
4
1
/
h
h
h
. (14)
Denoting
DDBB
kTkz ωθω hh == ,/ with
DD
θω , as Debye frequency and temperature,
respectively, we obtain
[ ]
dzz
ekM
T
mssKW
T
z
DB
D
∫
+
−
−+=
/
0
3
1
22
2
2
1
1
1
)2(
4
3
θ
θ
h
. (15)
Since we consider the melting, it is sufficient to take the hight temperatures (
D
T θ>> ) so that
1
1
≈
−
z
e
z
, and 0
2
→
z
, then the DWF Eq. (15) with using Eq. (7) is given by
[
]
2
21
22
12
)2(
4
3
DB
kMM
TKMssM
W
θ
h−+
=
, (16)
which is linearly proportional to the temperature T as it was shown already [3, 14].
From Eq. (12) with using Eq. (3) for W we obtain
N.V. Hung et al. / VNU Journal of Science, Mathematics - Physics 26 (2010) 147-154
150
[ ]
∑
−+
=
q
q
mssK
W
u
2
2
2
1
)2(
24
. (17)
The mean crystal lattice energy has been calculated
∑ ∑∑
==
nk nk q
knqqkknk
UMUM
, ,
2
2
2
ω
&
E
. (18)
Using this expression and Eqs. (6, 7) we obtain the atomic MSF in the form
∑∑
=
q
q
n
n
umU
N
2
1
2
2
2
1
, (19)
which by using Eq. (17) is given by
[]
2
2
2
2
2
)2(
24
1
mssK
Wm
U
N
n
n
−+
=
∑
. (20)
Using W from Eq. (16) this relation is resulted as
[ ]
2
1
22
2
2
)2(
18
1
DB
n
n
kmssM
Tm
U
N
θ−+
=
∑
h
. (21)
Hence, at
D
T θ>> the MSF in atomic positions about the equilibrium lattice positions is
determined by Eq. (21) which is linearly proportional to the temperature T.
Therefore, at a given temperature T the quantity R defined by the ratio of the RMSF in
atomic positions about the equilibrium lattice positions and the nearest neighbor distance d is
given by
[ ]
22
1
22
)2(
18
dkmssM
Tm
R
DB
θ−+
=
h
. (22)
Based on the Lindemann’s criterion the binary alloy will be melted when this value R
reaches a threshold value R
m
, then the Lindemann’s melting temperature
m
T for a bcc binary
alloy is defined as
[
]
χ
m
MssM
T
m
18
)2(
12
−+
= ,
∑
==
n
nm
DBm
U
Nd
R
dkR
2
2
2
2
2
222
1
,
h
θ
χ . (23)
If we denote x as proportion of the mass of the element 1 in the binary alloy, then we have
( )
21
1
2 MssM
sM
x
−+
= . (24)
From this equation we obtain the mean number of atoms in the element 1 for each binary alloy
lattice cell
xxm
x
s
+−
=
)1(
2
. (25)
We consider one element to be the host and another dopant. If the tendency to be the host is equal
for both constituent elements, we can take averaging the parameter m with respect to the atomic mass
proportion of the constituent elements in alloy as follows
N.V. Hung et al. / VNU Journal of Science, Mathematics - Physics 26 (2010) 147-154
151
( )
−+=
2
1
1
2
2
2
1
M
M
s
M
M
sm
. (26)
This equation can be solved using the successive approximation. Substituting the zero-order with s
from Eq. (25) in this equation we obtain the one of the 1
st
order
( ) ( )
011
1
2
2
1
2
=−
−−+−
M
M
xm
M
M
xxmx
, (27)
which provides the following solution
( )
( )
( ) ( )
1
2
2
1
2
1
141,
12
1
M
M
xx
M
M
xx
x
M
M
xx
m −+
−−=∆
−
∆+
−−−
= , (28)
replacing m in Eq. (23) for the calculation of Lindemann’s melting temperatures.
The threshold value R
m
of the ratio of RMSF in atomic positions on the equilibrium lattice
positions and the nearest neighbor distance at the melting is contained in
χ
which will be obtained by
an averaging procedure. The average of
χ
can not be directly based on
1
χ and
2
χ because it has the
form of Eq. (23) containing
2
m
R , i.e., the second order of
m
R , while the other averages have been
realized based on the first order of the displacement as Eq. (22). That is why we have to perform
average for
2/1
χ and then obtain
( )
[
]
4/2
2
21
χχχ ss −+= , (29)
containing
1
χ for the 1
st
element and
2
χ for the 2
nd
element, for which we use the following limiting
values
2,/9;0,/9
1)1(12)2(2
==== sMTsMT
mm
χχ (30)
with T
m(1)
and T
m(2)
as melting temperatures of the first or doping and the second or host element,
respectively, composing the binary alloy.
Therefore, the melting temperature of bcc binary alloys has been obtained actually from our
calculated ratio of RMSF in atomic positions on the equilibrium lattice positions and nearest
neighbour distance Eq. (22), which contains contribution of different binary alloys consisted of
different pairs of elements with the masses M
1
and M
2
of the same bcc structure.
The eutectic point is calculated using the condition for minimum of the melting curve, i.e.,
0=
dx
dT
m
. (31)
3. Numerical results and comparison to experiment
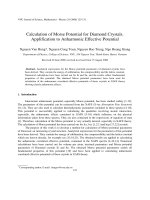
Now we apply the derived theory to numerical calculations for bcc binary alloys. According to the
phenomenological theory (PT) [10] Figure 1 shows the typical possible phase diagrams of a binary
alloy formed by the components A and B, i.e., the dependence of temperature T on the proportion x of
N.V. Hung et al. / VNU Journal of Science, Mathematics - Physics 26 (2010) 147-154
152
0 0.2 0.4 0.6 0.8 1
280
285
290
295
300
305
310
315
320
325
Proportion x of Rb
Temperature T (K)
Melting curve, present
Eutectic point, present
Melting curve, Expt., Ref. 7
Eutectic point, Expt., Ref. 7
Melting temperature, Cs, Ref. 6
Melting temperature, Rb, Ref. 6
Cs
1-x
Rb
x
0 0.2 0.4 0.6 0.8 1
2100
2200
2300
2400
2500
2600
2700
2800
2900
3000
Proportion x of Mo
Temperature T (K)
Melting curve, present
Melting temperature of Cr, Ref. 6
Melting temperature of Mo, Ref. 6
Eutectic point, present
Melting temperature, Expt., Ref. 7
Eutectic point, Expt., Ref. 7
Cr
1-x
Mo
x
element B doped in the host element A. Below isotropic liquid mixture L, the liquidus or melting
curve beginning from the melting temperature T
A
of the host element A passes through a temperature
minimum T
E
known as the eutectic point E and ends at the melting temperature T
B
of the doping
element B. The phase diagrams contain two solid crystalline phases α and β. The eutectic point is
varied along the eutectic isotherm T = T
E
. The eutectic temperature T
E
can be a value lower T
A
and T
B
(Figure 1a) or in the limiting cases equaling T
A
(Figure 1b) or T
B
(Figure 1c). The mass proportion x
characterizes actually the proportion of doping element mixed in the host element to form binary alloy.
(a) (b) (c)
Fig. 1. Possible typical phase diagrams of a binary alloy formed by components A and B.
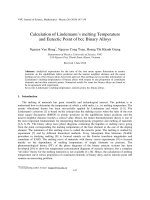
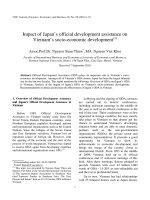
Fig. 2. Calculated melting curves and eutectic points of binary alloys Cs
1-x
Rb
x
, Cr
1-x
Mo
x
compared to
experimental phase diagrams [7].
Our numerical calculations using the derived theory are focused mainly on the mean melting
curves providing information on the Lindemann’s melting temperatures and eutectic points of bcc
binary alloys. All input data have been taken from Ref. 6. Figure 2 illustrates the calculated melting
curves of bcc binary alloys Cs
1-x
Rb
x
and Cr
1-x
Mo
x
compared to experiment [7]. They correspond to the
case of Figure 1a of the PT. For Cs
1-x
Rb
x
the calculated eutectic temperature T
E
= 288 K and the
eutectic proportion x
E
= 0.3212 are in a reasonable agreement with the experimental values T
E
= 285.8
K and x
E
= 0.35 [7], respectively. For Cr
1-x
Mo
x
the calculated eutectic temperature T
E
= 2125 K agrees
N.V. Hung et al. / VNU Journal of Science, Mathematics - Physics 26 (2010) 147-154
153
0 0.2 0.4 0.6 0.8 1
1800
1850
1900
1950
2000
2050
2100
2150
2200
2250
2300
Mass proportion x of V
Temperature T(K)
Melting curve, present
Melting temperature of Fe, Ref. 6
Melting temperature of V, Ref. 6
Eutectic point, present
Fe
1-x
V
x
0 0.2 0.4 0.6 0.8 1
500
1000
1500
2000
2500
Proportion x of Cs
Temperature T(K)
Melting curve, present
Melting temperature of Cr, Ref. 6
Melting temperature of Cs, Ref. 6
Eutectic point, present
Cr
1-x
Cs
x
well with the experimental value T
E
= 2127 K [7] and the calculated eutectic proportion x
E
= 0.15 is in
a reasonable agreement with the experimental value x
E
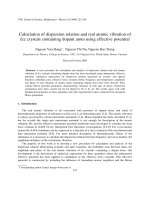
= 0.20 [7]. Figure 3 shows that our calculated
melting curve for Fe
1-x
V
x
corresponds to the phase diagram of Figure 1b and for Cr
1-x
Cs
x
to those of
Figure 1c of the PT. Table 1 shows the good agreement of the Lindemann’s melting temperatures
taken from the calculated melting curve with respect to different proportions of constituent elements of
binary alloy Cs
1-x
Rb
x
with experimental values [7].
Fig. 3. Calculated melting curve and eutectic point of binary alloys Fe
1-x
V
x
and Cr
1-x
Cs
x
.
Table 1. Comparison of calculated Lindemann’s melting temperatures T
m
(K) of Cs
1-x
Rb
x
to experiment [7] with
respect to different proportions x of Rb doped in Cs to form binary alloy
Proportion x of Rb 0.10 0.30 0.50 0.70 0.90
T
m
(K), Present 292.6 287.5 290.0 295.0 305.0
T
m
(K), Exp. [7] 291.4 286.0 287.4 293.5 304.0
4. Conclusions
In this work a lattice thermodynamic theory on the melting curves, eutectic points and eutectic
isotherms of bcc binary alloys has been derived. Our development is derivation of analytical
expressions for the melting curves providing information on Lindemann’smelting temperatures with
respect to different proportions of constituent elements and eutectic points of the binary alloys.
The significance of the derived theory is that the calculated melting curves of binary alloys
correspond to the experimental phase diagrams and to those qualitatively shown by the
phenomenological theory. The Lindemann’s melting temperatures of a considered binary alloy change
from the melting temperature of the host element when the whole elementary cell is occupied by the
atoms of the host element to those of binary alloy with respect to different increasing proportions of
the doping element and end at the one of the pure doping element when the whole elementary cell is
occupied by the atoms of the doping element.
N.V. Hung et al. / VNU Journal of Science, Mathematics - Physics 26 (2010) 147-154
154
Acknowledgments. This work is supported by the research project QG.08.02 and by the research
project No. 103.01.09.09 of NAFOSTED.
References
[1] F.A. Lindemann, Z. Phys. 11 (1910) 609.
[2] N. Snapipiro, Phys. Rev. B 1 (1970) 3982.
[3] J.M. Ziman, Principles of the Theory of Solids, Cambrige University Press, London, 1972.
[4] H.H. Wolf, R. Jeanloz, J. Geophys. Res. 89 (1984) 7821.
[5] R.K. Gupta, Indian J. Phys. A 59 (1985) 315.
[6] Charles Kittel, Introduction to Solid State Physics, 3rd Edition (Wiley, New York, 1986).
[7] T.B. Massalski, Binary Alloy Phase Diagrams, 2
nd
ed. (ASM Intern. Materials Parks, OH, 1990).
[8] E.A. Stern, P. Livins, Zhe Zhang, Phys. Rev B, Vol. 43, No.11 (1991) 8850.
[9] D. Alfè, L. Vočadlo, G.D. Price, M.J. Gillan, J. Phys.: Condens. Matter 16 (2004) S937.
[10] Denis Machon, Pierre Toledano, Gerhard Krexner, Phys. Rev. B 71 (2005) 024110.
[11] H. Löwen, T. Palberg, R. Simon, Phys. Rev. Lett. 70 (1993) 15.
[12] N.V. Hung, J.J. Rehr, Phys. Rev. B 56 (1997) 43.
[13] M. Daniel, D.M. Pease, N.V. Hung, J.I. Budnick, Phys. Rev. B 69 (2004) 134414.
[14] N.V. Hung, Paolo Fornasini, J. Phys. Soc. Jpn. 76 (2007) 084601.
[15] N.V. Hung, T.S. Tien, L.H. Hung, R.R. Frahm, Int. J. Mod. Phys. B 22 (2008) 5155.
[16] Charusita Chakravaty, Pablo G. Debenedetti, Frank H. Stillinger, J. Chem. Phys. 126 (2007) 204508.