Systematic bias in estimates of reproductive potential of an Atlantic cod (Gadus morhua) stock: implications for stock–recruit theory and management pptx
Bạn đang xem bản rút gọn của tài liệu. Xem và tải ngay bản đầy đủ của tài liệu tại đây (871.29 KB, 15 trang )
Systematic bias in estimates of r eproductive
potential of an Atlantic cod (Gadus morhua) stock:
implications for stock–r ecruit theory and
management
C. Tara Marshall, Coby L. Needle, Anders Thorsen, Olav Sigurd Kjesbu, and
Nathalia A. Yaragina
Abstract: Stock–recruit relationships that use spawning stock biomass (SSB) to represent reproductive potential assume
that the proportion of SSB composed of females and the relative fecundity (number of eggs produced per unit mass)
are both constant over time. To test these two assumptions, female-only spawner biomass (FSB) and total egg produc
-
tion (TEP) were estimated for the Northeast Arctic stock of Atlantic cod (Gadus morhua) over a 56-year time period.
The proportion of females (FSB/SSB) varied between 24% and 68%, and the variation was systematic with length such
that SSB became more female-biased as the mean length of spawners increased. Relative fecundity of the stock
(TEP/SSB) varied between 115 and 355 eggs·g
–1
and was significantly, positively correlated with mean length of
spawners. Both FSB and TEP gave a different interpretation of the recruitment response to reductions in stock size
(overcompensatory) compared with that obtained using SSB (either compensatory or depensatory). There was no differ
-
ence between SSB and FSB in the assessment of stock status; however, in recent years (1980–2001) TEP fell below
the threshold level at which recruitment becomes impaired more frequently than did SSB. This suggests that using SSB
as a measure of stock reproductive potential could lead to overly optimistic assessments of stock status.
Résumé : Les relations stock–recrues qui utilisent la biomasse du stock reproducteur (SSB) pour représenter le poten-
tiel reproductif présupposent que la proportion de SSB représentée par les femelles et que la fécondité relative (nombre
d’oeufs produits par unité de masse) sont toutes deux invariables dans le temps. Afin d’évaluer ces deux présupposi-
tions, nous avons estimé la biomasse des reproducteurs femelles seuls (FSB) et la production totale d’oeufs (TEP) chez
un stock de morues franches (Gadus morhua) de l’Arctique sur une période de 56 ans. La proportion de femelles
(FSB/SSB) varie de 24 à 68 % et elle change systématiquement en fonction de la longueur de telle manière que SSB
favorise de plus en plus les femelles à mesure que la longueur moyenne des reproducteurs augmente. La fécondité rela-
tive du stock (TEP/SSB) varie de 115 à 355 oeufs·g
–1
et elle est en corrélation positive significative avec la longueur
moyenne des reproducteurs. FSB et TEP fournissent toutes deux une interprétation différente de la réaction du recrute
-
ment à la réduction de la taille du stock (surcompensation) par comparaison à la réaction du recrutement obtenue à
partir de SSB (compensation ou bien effet d’Allee). Il n’y a pas de différence entre SSB et FSB pour ce qui est de
l’évaluation du statut du stock; cependant, ces dernières années (1980–2001), TEP est tombée sous le seuil sous lequel
le recrutement se détériore plus fréquemment que SSB. Cela laisse croire que l’utilisation de SSB comme mesure du
potentiel reproductif du stock pourrait mener à des évaluations trop optimistes du statut du stock.
[Traduit par la Rédaction] Marshall et al. 994
Introduction
Stock–recruit models, representing the fundamental rela
-
tionship between the parental population and the number of
offspring produced (recruitment), are familiar to population
ecologists (Krebs 1994) and are an important tool for the
management of harvested populations (Ricker 1975). Empir
-
ical support for the existence of a stock–recruit relationship
is notably weak (Peters 1991), making it difficult to discern
the functional form of the relationship with certainty. In the
case of harvested populations, the requirement for a ratio
-
nale basis for management often dictates that a stock–recruit
Can. J. Fish. Aquat. Sci. 63: 980–994 (2006) doi:10.1139/F05-270 © 2006 NRC Canada
980
Received 17 May 2005. Accepted 6 October 2005. Published on the NRC Research Press Web site at on
22 March 2006.
J18700
C.T. Marshall.
1
University of Aberdeen, School of Biological Sciences, Zoology Building, Tillydrone Avenue, Aberdeen,
AB24 2TZ, Scotland, UK.
C.L. Needle. Fisheries Research Services Marine Laboratory, P.O. Box 101, 375 Victoria Road, Aberdeen, AB11 9DB, Scotland, UK.
A. Thorsen and O.S. Kjesbu. Institute of Marine Research, P.O. Box 1870, N-5817 Bergen, Norway.
N.A. Yaragina. Polar Research Institute of Marine Fisheries and Oceanography, 6 Knipovich St., Murmansk, 1837763, Russia.
1
Corresponding author (e-mail: ).
model be fit, irrespective of the degree of noise in the data.
This is especially true of fisheries management that, under
the precautionary approach, fits statistical models to stock–
recruit data to define the stock size at which recruitment is
impaired and then seeks to keep the stock well above that
threshold level (Caddy and Mohn 1995). A high degree of
variability in the stock–recruit relationship impedes the ac
-
curate estimation of that threshold level. Underestimating
the threshold level is of particular concern, as it will poten
-
tially lead to overly optimistic assessments of stock status.
One potential source of variability in the stock–recruit
relationship is an imprecise definition of the independent
variable. In fisheries, most stock–recruit relationships use
spawning stock biomass (SSB) as the measure of reproduc
-
tive potential, thereby assuming that SSB is directly propor
-
tional to the annual total egg production by the stock. This
requires firstly that the proportion of SSB that is composed
of females is constant over time and secondly that the rela
-
tive fecundity of the stock (number of eggs produced per
unit mass) is constant over time (Quinn and Deriso 1999).
Intuitively, these two constancy assumptions are unlikely to
be valid for fish species that exhibit strong dimorphism in growth,
maturation, and mortality (Ajiad et al. 1999; Lambert et al.
2003), a high degree of interannual variation in relative fe
-
cundity of individuals (Kjesbu et al. 1998; Marteinsdottir
and Begg 2002), and (or) large shifts in the age–size compo-
sition of the stock (Marteinsdottir and Thorarinsson 1998).
Rigorous tests of both constancy assumptions are warranted
given the ubiquitous and largely uncritical use of SSB in re-
cruitment research and fisheries management.
If the constancy assumptions are shown to be invalid, then
the next step is to replace SSB with an alternative index that
can be reliably estimated in the current year as well as re-
constructed for the time period depicted in the stock–recruit
relationship used by management. Many fish stocks have
relatively long time series of basic demographic information
including, age–size composition, maturation, and sex ratios
(Tomkiewicz et al. 2003). Fecundity data are in more limited
supply (Tomkiewicz et al. 2003), although contemporary fe
-
cundity data have been used to develop statistical models
that can hindcast values for the historical period (Kraus et al.
2002; Blanchard et al. 2003). Thus, by combining historical
and contemporary data, it is becoming increasingly feasible
to estimate alternative indices of reproductive potential, such
as female-only spawner biomass (FSB) and total egg pro
-
duction (TEP). Atlantic cod (Gadus morhua) stocks are at
the forefront of these efforts (Marshall et al. 1998; Köster et
al. 2001), stimulated by research quantifying the sources and
magnitude of variability in individual fecundity (Kjesbu et
al. 1998; Marteinsdottir and Begg 2002) and by the growing
recognition of the implications of this variability for stock
management (Scott et al. 1999).
While alternative indices of stock reproductive potential
are being actively developed, they have yet to be formally
incorporated into fisheries management (Marshall et al. 2003).
The socio-economic implications of introducing such a fun
-
damental change requires (i) compelling evidence that the
status quo cannot be justified and (ii) a detailed evaluation
of the consequences of replacing SSB with a new index of
reproductive potential. To undertake the latter, two key ques
-
tions must be answered. (i) Does the alternative index funda
-
mentally change the functional form of the recruitment re
-
sponse to stock depletion? (ii) Does the threshold level of
recruitment impairment estimated for the alternative index
change the classification of stock status as being inside or
outside safe biological limits?
With respect to the first question, the observations near
the origin of the stock–recruit relationship are of particular
interest, as they describe the stock as it approaches extinc
-
tion. This region is critical to determining whether the func
-
tional form is classified as compensatory (recruits per
spawner increases with increasing depletion) or depensatory
(recruits per spawner decreases with increasing depletion)
(Fig. 1a). Depensatory production dynamics potentially re
-
sult from a wide variety of factors, including increased per
capita predation risk on species that continue to aggregate at
low population levels (Allee et al. 1949), reduced reproduc
-
tive success (Gilpin and Soulé 1986), predator saturation
(Shelton and Healey 1999), and genetic deterioration and in
-
breeding (Taylor and Rojas-Bracho 1999). If depensation is
present in the stock–recruit relationship, then the stock is
prone to sudden collapse, and fisheries management must be
suitably cautious (Liermann and Hilborn 1997; Shelton and
Healey 1999). Depensation could possibly explain the failure
© 2006 NRC Canada
Marshall et al. 981
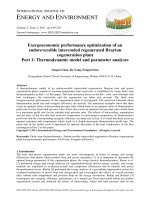
Fig. 1 . Schematic diagrams illustrating the two different models that
were used to describe the stock–recruit relationship. (a) Depensation
(
γ
> 1), compensation (
γ
= 1), and overcompensation (
γ
< 1). The
unique maximum, occurring at (S
p,
R
p
), is indicated. Below this
point, recruitment decreases in either a depensatory or compensatory
fashion. (b) Piecewise regression model with the change point
(
δ
) indicated.
of collapsed cod stocks to recover despite the cessation of
commercial fishing (Shelton and Healey 1999).
With respect to the second question, the precautionary ap
-
proach to fisheries management, as implemented by the In
-
ternational Council for the Exploration of the Sea (ICES),
states that “in order for stocks and fisheries exploiting them
to be within safe biological limits, there should be a high
probability that 1) the spawning stock biomass is above the
threshold where recruitment is impaired” (ICES Advisory
Committee on Fishery Management 2003). Management ad
-
vice for the upcoming fishing year is formulated according
to the probability of staying above this threshold by a pre
-
specified margin of error. For highly indeterminate stock–
recruit relationships, estimating the level of SSB at which
recruitment is impaired is more art than science. Within
ICES, piecewise linear regression (Barrowman and Myers
2000) is increasingly being used to objectively identify a
change point representing the level of impaired recruitment
(Fig. 1b). An evaluation of alternative indices of reproduc
-
tive potential should therefore determine whether the change
point estimated for the alternative index gives a divergent as
-
sessment of whether the stock is inside (above the change
point) or outside (below the change point) safe biological
limits compared with the assessment made using the conven
-
tional SSB change point.
These two questions represent fundamentally different
approaches to representing the stock–recruit relationship.
Depicting the stock–recruit relationship using a nonlinear,
density-dependent model (Fig. 1a) is an ecological approach
that assumes a mechanistic basis for the relationship. The
piecewise linear regression model approach is entirely statis-
tical (Fig. 1b). If the stock–recruit relationship is noisy, then
the change point is often very close to the origin, and the
stock–recruit relationship is horizontal for most of the range
in stock size. This is nearly equivalent to the null hypothesis
of no relationship between spawning stock and recruitment,
a hypothesis that is categorically rejected as a basis for sus
-
tainable management. Clearly, the piecewise linear regression
model approach is oversimplified compared with ecological
models. While it would be preferable to use an ecological
model to identify threshold levels of recruitment impair
-
ment, in practice the piecewise linear regression model is
used because it can be applied objectively to highly indeter
-
minate stock–recruit relationships. Whether this is an appro
-
priate strategy for fisheries management is beyond the scope
of this study. However, the two contrasting approaches (eco
-
logical and statistical) are used here to assess the alternative
indices of reproductive potential (FSB and TEP) relative to
the conventional one (SSB) that is used by management.
In this study, FSB and TEP were estimated for the North
-
east Arctic stock of Atlantic cod using the same databases
and time periods that are used to estimate SSB, thus ensur
-
ing that the two alternative indices of reproductive potential
are directly comparable with the conventional index. The as
-
sumptions of constant proportion of females and constant
relative fecundity of the stock were tested by inspecting time
trends in the ratios FSB/SSB and TEP/SSB. The stock–
recruit relationships obtained using SSB, FSB, and TEP as
indices of stock reproductive potential were compared to
determine whether they differed with respect to providing
evidence of depensatory or compensatory production dynam
-
ics. Additionally, change points were estimated for the alter
-
native stock–recruit relationships to determine whether they
assessed stock status differently from or consistently with
the SSB change point. Implications of the results for the
management of the Northeast Arctic stock of Atlantic cod,
stock–recruit theory, and research into maternal effects on
population dynamics are discussed.
Material and methods
The Northeast Arctic stock of Atlantic cod inhabits the
Barents Sea, an arcto-boreal shelf sea that is situated north
of Norway and northwestern Russia between 70°N and 80°N.
Both Norway and Russia have extensive long-term databases
describing the biological characteristics of the Northeast
Arctic stock of Atlantic cod. Selected age-specific data are
reported annually by Russia and Norway to the ICES Arctic
Fisheries Working Group (ICES AFWG). The annual report
of the ICES AFWG (e.g., ICES ACFM 2002) contains time
series for several demographic parameters (e.g., numbers-at-
age, proportion mature-at-age, and weight-at-age) that have
been estimated by combining the Russian and Norwegian
data into a single time series. Other data (e.g., length com
-
position, sex ratios) are only available by directly accessing
the Russian and Norwegian databases.
Alternative indices of reproductive potential
For the Northeast Arctic stock of Atlantic cod, SSB is es-
timated by the ICES AFWG as
(1)
SSB =⋅⋅
=
+
∑
nmw
a
a
aa
3
13
where n
a
, m
a
, and w
a
are the numbers-at-age, proportion
mature-at-age, and weight-at-age, respectively (table 16 of
ICES Advisory Committee on Fishery Management 2002).
By convention, the notation 13+ indicates that all age classes
age 13 and older have been combined into a single age class.
Values of n
a
are determined using a version of cohort analy
-
sis known as extended survivors analysis (Shepherd 1999).
The values of m
a
and w
a
represent arithmetic averages of the
Norwegian and Russian values of m
a
and w
a
(ICES Advisory
Committee on Fishery Management 2001).
For slow-growing stocks such as the Northeast Arctic stock
of Atlantic cod, reproductive traits such as fecundity are pri
-
marily length-dependent, and the substantial variation in
length-at-age that has occurred over the study period (Mar
-
shall et al. 2004) would invalidate an exclusively age-based
approach to estimating reproductive potential. A length-based
estimate of SSB (len-SSB) would be estimated as
(2)
len-SSB =⋅⋅
∑
nmw
l
l
ll
where n
l
, m
l
, and w
l
are the numbers-at-length, proportion
mature-at-length, and weight-at-length, respectively. A length-
based estimate of FSB (len-FSB) would be obtained using
(3)
len-FSB
|
=⋅⋅⋅
∑
nsm w
l
l
llfl
where s
l
is the proportion of females at length and
m
lf|
is the
proportion of females that are mature-at-length. Length-based
total egg production (len-TEP) could be estimated using
© 2006 NRC Canada
982 Can. J. Fish. Aquat. Sci. Vol. 63, 2006
(4)
len-TEP
|
=⋅⋅⋅
∑
nsm e
l
l
llfl
where e
l
is the number of eggs produced by mature females
of a given length.
Female-only spawner biomass
To estimate len-FSB for the years 1946 to 2001 using
eq. 3, length-based equivalents for n
a
, w
a
, and m
a
were de
-
rived as described below.
Numbers-at-length (n
l
)
Estimates of n
a
(ICES Advisory Committee on Fishery
Management 2002) were transformed to n
l
using the com
-
bined (Russian and Norwegian) age–length keys (ALK) that
are described in detail in Marshall et al. (2004). These com
-
bined ALK were estimated for each year in the time period
1946–2001 using Russian and Norwegian data and described
the aggregate stock (immature and mature combined, males
and females combined). They were constructed for 5 cm
length groups ranging from 0 to 140+ cm and ages 3 to 13+,
and each element in the matrix gives the proportion of fish at
that age and length combination. The vector representing the
values of n
a
(ages 3 to 13+, from table 3.23 of ICES Advi
-
sory Committee on Fishery Management 2002) for a given
year was then multiplied by the ALK for that year to obtain
a vector of n
l
values for that year.
Proportion females at length (s
l
)
Only Norwegian data were used to estimate the s
l
for each
5 cm length class. The observed values of s
l
for all years are
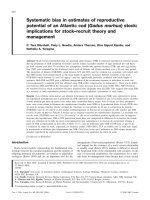
shown (Fig. 2a, excluding 1980–1984, which had data qual-
ity problems). At lengths >80 cm, the data show a clear
trend towards increasing values of s
l
with increasing length,
reflecting the differential longevity of females relative to
males. At lengths <60 cm, values of s
l
fluctuate about 0.5,
with values of 0 and 1 being observed when the sample size
used to estimate the proportion is low. Between 60 and
80 cm, there is some suggestion of values of s
l
being less
than 0.5. However, this tendency is possibly an artefact re
-
sulting from the differential behaviour and (or) distribution
of mature males (Brawn 1962) that could predispose them to
capture.
The values of s
l
that were used for estimating len-FSB
(eq. 3) and len-TEP (eq. 4) assumed that the proportion of
females was constant and equal to 0.5 for cod <80 cm. For
lengths >80 cm, the data were re-expressed as the total count
of females (p
l
) and males (q
l
), with the response variable of
the model (z
l
) being equal to the odds (i.e., p
l
/q
l
). The model
(5)
zabL
l
=+exp( )
was fit to data for each year using a logit link function and
assuming a binomial error distribution, with L being the
midpoint of the 5 cm length class. The response variable was
back-transformed from logits to proportions (s
l
= p
l
/p
l
+ q
l
)
by
(6)
sz
ll
=+11 1/[ / exp( )]
The predicted proportions show that above 80 cm, the pro
-
portions of females increases with increasing length; how
-
ever, there is a considerable amount of interannual
variability in sex ratios (Fig. 2b). Modelled values for s
l
(Fig. 2b) were used to estimate the len-FSB (eq. 3) and len-
TEP (eq. 4). For the years 1980–1984, the average of the
modelled values for 1979 and 1985 were used.
Proportion mature-at-length (m
l
)
The ALK described above were also used to estimate m
l
as follows. For each year, the numbers of mature (n
a,mat
) and
immature (n
a,imm
) cod at age vectors were estimated by mul
-
tiplying the virtual population analysis numbers at age vec
-
tor (n
a
)bythem
a
and1–m
a
vectors, respectively. The
resulting vectors of n
a,mat
and n
a,imm
were then multiplied by
the corresponding year-specific ALK to give the numbers of
mature and immature cod at length (n
l,mat
and n
l,imm
, respec
-
tively). The proportion mature-at-length (m
l
) was therefore
estimated as n
l,mat
/(n
l,mat
+ n
l,imm
).
There were several years for which observations for the
127.5, 132.5, and 137.5 cm length classes were equal to 0.
Such observations could be valid (i.e., created by a single
individual that was skipping spawning). However, given that
these observations were based on relatively few observa
-
tions, a value of 1.0 was assumed instead. The resulting val
-
ues of m
l
show a high degree of variation across the entire
56-year time period (Fig. 3a). For example, the values of m
l
for 72.5 cm range from 0.01 to 0.67, with a abrupt shift to
higher values occurring around 1980. The estimated values
© 2006 NRC Canada
Marshall et al. 983
Fig. 2. The proportion of females in each 5 cm length class plot
-
ted against the midpoint of that length class. (a) Estimated val
-
ues for 1946–2001. (b) Models used to estimate female-only
spawner biomass and total egg production for all 56 years in the
time period.
of m
l
were used to estimate len-SSB, len-FSB, and len-TEP
instead of modelled values to be consistent with the ap
-
proach used by the ICES AFWG to estimate SSB.
Proportion of females that are mature-at-length
()m
l
f|
The approach taken to estimating
m
l
f|
was to correct the
m
l
values described above, which were estimated for males
and females combined, to account for the slower maturation
of females compared with males (Lambert et al. 2003). To
develop a correction factor, only Norwegian data for 1985
and onwards were available. For each of these years, logistic
models were fit to data for males and females combined and
to data for females only using generalized linear models and
assuming a binomial error distribution. The difference be
-
tween the two ogives at the midpoint of each 5 cm length
class (
∆m
l
) was then estimated. Values of
∆m
l
consistently
peaked at length classes having midpoints of 62.5 or
67.5 cm (Fig. 4), indicating that in the intermediate length
range the values of m
l
for male and female combined are
consistently greater than values for female only.
For each year in the time period 1985–2001, the value of
m
l
f|
was estimated as m
l
minus the estimated value of
∆m
l
for that year. Values of
m
l
f|
were assumed to be zero if m
l
minus
∆m
l
was negative. No correction was applied for
lengths greater than 100 cm. For years prior to 1985, a two-
step approach was taken. Firstly, a polynomial model was fit
to values of
∆m
l
pooled for 1985 to 2001 using nonlinear
regression in SPLUS. The resulting model is given by
(7)
ln( ) ( ) ln( )∆mLL
l
=− + ⋅ − ⋅318.81 154.28 ln 18.79
2
where L is the midpoint of the 5 cm length class. The fitted
quadratic model (Fig. 4) was used to give a standard value
of
∆m
l
for each midpoint in the range 42.5–97.5 cm (outside
of that length range
∆m
l
was assumed to be 0). The
m
l
f|
was
estimated as the year-specific value of m
l
for males and fe
-
males combined minus the model value of
∆m
l
.
Weight-at-length (w
l
)
This study used the year-specific length–weight relation
-
ships that were derived from the weight-at-age time series
that are provided annually to the ICES AFWG by Norway
and Russia. These data describe length–weight relationship
in the first quarter as described in detail in Marshall et al.
(2004). The length–weight relationships show considerable
interannual variation (Fig. 5) and for cod that are larger than
70 cm, there has been a distinct long-term trend towards
higher values of w
l
(Marshall et al. 2004).
Total egg production
Given that fecundity determinations were made for only a
small number of years, it was necessary to develop a statisti
-
cal model that could hindcast e
l
for the full time period. Dur
-
ing the full time period, there has been considerable variation
in condition (sensu energy reserves) of cod that resulted from
fluctuations in the abundance of capelin (Yaragina and Mar
-
shall 2000). Consequently, model development included test
-
ing whether relative condition explained a significant portion
of the residual variation in the length–fecundity relationship.
© 2006 NRC Canada
984 Can. J. Fish. Aquat. Sci. Vol. 63, 2006
Fig. 3. Time series for (a) proportion mature-at-length (m
l
) and
(b) weight-at-length (w
l
). The length classes shown in each panel
have midpoints 52.5, 72.5, 92.5, 112.5, and 132.5 cm, with the
lowest and highest values belonging to the smallest (52.5 cm)
and largest (132.5 cm) length class, respectively.
Fig. 4. The difference between length-based maturity ogives for
males + females and females only (
∆ m
l
) plotted by length class
for the years 1985–2001. These observed values were used to
convert m
l
to
m
l
f|
in those years. The solid line shows the poly
-
nomial model (eq. 9) that was used to estimate values for the
years 1946 to 1984. Different symbols correspond to different
years (1985–2001).
Fecundity-at-length (e
l
)
A data set was available for fecundity determinations made
for the Northeast Arctic stock of Atlantic cod in the years
1986–1989, 1991, 1999, and 2000 (see Kjesbu et al. 1998
for sampling details). The subset of this data set that was
used here omitted observations if they were from coastal cod
(distinguished by otolith type), from cod having oocyte di-
ameters <400
µm
, or from cod that were assessed visually as
having begun spawning. Using this subset of observations,
the following steps were taken as part of model develop-
ment.
Estimation of condition of prespawning females in the
fecundity data set
The prespawning females exhibited a temporal trend in
condition that mirrored that observed in the stock generally
(Fig. 6). To represent the condition of the individual
prespawning females in the fecundity data set, relative con
-
dition (Kn) was estimated as the observed weight of the fe
-
male divided by a standard weight, which was estimated
using a length–weight relationship developed using data for
all of the prespawning females pooled for all 7 years. This
relationship is given by
(8)
wL=− + ⋅exp[ ln( )]5.472 3.171
which was obtained by fitting a generalized linear model
(assuming a gamma error distribution with a log–link func
-
tion, df = 478, p < 0.001) to the length and weight data for
the prespawning females pooled for all 7 years. Thus, Kn
expresses condition of the individual female relative to the
mean condition of all of the females in the pooled data set
for the 7 years.
Fortuitously, the 7 years in which fecundity was sampled
was marked by strong variation in the condition of cod
(Fig. 6). Consequently, the variability observed in the length
and weight data for the fecundity data set is similar to the
magnitude of variability observed in the length–weight re
-
gressions developed for the stock over the full time period
(Fig. 5). The variability in condition of the prespawning fe
-
males in the fecundity data set was therefore considered to
mimic, to a reasonable degree, the variability occurring at
the stock level over the full time period.
Development of a fecundity model for hindcasting
For the fecundity data set, both length and Kn of the
prespawning females were significantly correlated with fe
-
cundity (Table 1). The resulting model for e
l
(in millions)
was
(9)
eL
l
=− + +exp{ [ln( )] [ln( )]}15.090 3.595 1.578 Kn
© 2006 NRC Canada
Marshall et al. 985
Fig. 5. The year-specific length–weight regressions (dotted lines)
used to generate values for weight-at-length for the stock (w
l
)
through the time period 1946–2001. The observed values of
weight and length for the prespawning females (circles) used to
develop the length–fecundity model are shown for comparison.
Fig. 6. (a) Monthly values of the liver condition index (LCI =
liver weight/total body weight × 100) for 51–60 (open circles),
61–70 (open triangles), and 71–80 (crosses) cm Atlantic cod
(Gadus morhua) from 1986 to 2001. (b) Boxplots showing the
range of values of Fulton’s K condition index for the pre
-
spawning females used in the fecundity study, plotted by year.
The model adequately captures the range of variability in
observed fecundity (Fig. 7a), and the residuals showed no
pattern with either L or Kn.
Estimation of Kn at the stock level
To apply eq. 9 to the stock level, year- and length-specific
values of Kn were required for the full time period (1946–
2001). The year-specific length–weight relationships described
above (see Fig. 5) were used to predict w
l
ranging in 5 cm
increments between 50 and 140 cm for each year. These
model-derived values of w
l
were then treated as the observed
weights for the prespawning females in the stock for that
year (note these values of w
l
were also used to estimate len-
SSB and len-FSB).
To express condition in a specific year relative to long-
term (1946–2001) trends in condition, the long-term weight
was estimated by pooling all of the observed weights for
standard lengths for all years and fitting a length–weight re-
lationship to those data. The resulting equation was
(10)
WL=− + ⋅exp( ln )4.836 3.014
and was fit using a generalized linear model (assuming a
gamma error distribution with a log–link function, df =
1007, p < 0.001). For each year, Kn was then estimated by
the ratio of the observed weight to the long-term weight ob
-
tained from eq. 10.
Application of the fecundity model to estimating TEP of
the stock
For each year, e
l
was estimated for lengths ranging in
5 cm increments between 50 and 140 cm using eq. 9. The
degree of variability in values of e
l
over the full time period
(Fig. 7b) was similar to the level of variability observed in
the fecundity data set (Fig. 7a). This indicated that the dy
-
namic range in the hindcast values is comparable with that
observed in the 7 years of highly variable condition that
were represented in the fecundity data set. The hindcast val
-
ues of e
l
were then used to estimate len-TEP from eq. 4.
Representing the size structure of the spawning stock
To represent the length composition of the spawning stock
in a given year, the mean length of the spawning stock
(SS
len
) was estimated as
(11)
SS
len
42.5
137.5
42.5
137.5
=
⋅⋅
⋅
=
+
=
+
∑
∑
l
l
ll
l
l
l
nm
nm
where l is the midpoint of 5 cm length classes spanning 40
to 140+ cm. This value describes mean length composition
of spawners based on their numerical abundance (n
l
·m
l
) rather
than on the basis of their biomass (i.e., n
l
·m
l
·w
l
).
Representing the stock–recruit relationship
Separate stock–recruit relationships were developed using
SSB, len-FSB, and len-TEP as indices of reproductive po
-
tential. In all cases, the recruitment index used was the
number at age 3 (ICES Advisory Committee on Fishery
Management 2002) corresponding to the 1946–1998 year
classes. Depensation cannot be resolved using the standard
two-parameter Beverton–Holt nor Ricker models (Quinn and
© 2006 NRC Canada
986 Can. J. Fish. Aquat. Sci. Vol. 63, 2006
df
Deviance
residual
Residual
df
Residual
deviance F Pr(F)
Null — — 479 272.2433 — —
ln(length) 1 232.8794 478 39.3639 4562.342 <0.0001
ln(Kn) 1 14.8693 477 24.4946 291.305 <0.0001
Note: Data are from Kjesbu et al. (1998) and O.S. Kjesbu and A. Thorsen (unpublished data).
Table 1. Summary statistics to a generalized linear model fit (family = gamma, link = log) to fe
-
cundity data for the Northeast Arctic stock of Atlantic cod (Gadus morhua).
Fig. 7. (a) The observed fecundity of prespawning females (open
circles) and fecundity predicted using eq. 11 for the minimum
(0.5), unity (1.0), and maximum (1.4) values of Kn. (b) The val
-
ues of fecundity-at-length (e
l
) predicted for all midpoints for the
time period 1946–2001 using eq. 11.
Deriso 1999). Therefore, the functional form of the stock–
recruit relationships was described by fitting a three-
parameter Saila–Lorda model (Needle 2002) that is formu
-
lated as
(12)
RS S=⋅ −αβ
γ
exp( )
where S denotes the index of reproductive potential (here
SSB, len-FSB, or len-TEP), and R denotes recruitment. In
the Saila–Lorda model,
α
measures density independence as
modulated by depensation,
β
measures density-dependent
factors, and
γ
is a scale-independent shape parameter
(Fig. 1a). The
γ
parameter in the Saila–Lorda model is a
direct measure of depensation that is independent of the
scale of the data sets, a property that facilitates comparisons
among the different data sets. When
γ
> 1, the relationship
between R and S is depensatory. For the special case where
γ
= 1, the relationship is perfectly compensatory and equiva
-
lent to the standard Ricker curve. When
γ
< 1, the relation
-
ship is considered to be overcompensatory. For the Saila–Lorda
model, a unique maximum (R
p
and S
p
) occurs at
(13)
( , ) exp( ),RS
pp
=
⎛
⎝
⎜
⎞
⎠
⎟
−
⎛
⎝
⎜
⎜
⎞
⎠
⎟
⎟
α
γ
β
γ
γ
β
γ
Conceptually, this point can be considered as the level of S
below which R decreases in either a depensatory or compen-
satory fashion (Fig. 1a).
In this study, the Saila–Lorda model was fit through a
lognormal transformation of eq. 12 to
(14)
ln lnRabSc S=+⋅+⋅
where
α
is equal to exp(a),
β
is equal to –b, and
γ
is equal to
c. The model was fit in SPLUS as a linear model, and 95%
confidence intervals were approximated as ±2 standard er-
rors of the prediction.
Depensation in a stock can only be tested for properly if
there are observations in the stock–recruit scatterplot that are
sufficiently close to the origin. To ensure that was the case
here, the following criteria were applied. For fits that were
deemed to potentially be depensatory (
γ
> 1), the lower in
-
flection point of the Saila–Lorda curve (S
inf
=(
γγβ− )/ )
was compared with the minimum observed value (S
min
). If
S
inf
was greater than the minimum S
min
, then the fit was ac
-
cepted as being depensatory.
Estimation of change points
Piecewise linear regression (Barrowman and Myers 2000)
was used to estimate change points for the stock–recruit
relationships developed using the two alternative indices of
reproductive potential (len-FSB and len-TEP) as well as the
conventional index (SSB). The piecewise linear regression
model is given as
(15)
R
SS
SS
=
+⋅ ≤≤
+⋅ ≤
⎧
⎨
⎩
αβ δ
αβ δ
11
22
0,
,
where
δ
represents the change-point value. For stock and re
-
cruitment data, the model is constrained to pass through the
origin (i.e.,
α
1
= 0) and beyond
δ
, the line is horizontal (i.e.,
β
2
= 0). Thus, eq. 15 simplifies to
(16)
R
SS
S
=
⋅≤≤
≤
⎧
⎨
⎩
βδ
αδ
1
2
0,
,
which can be re-expressed on a lognormal scale as
(17)
ln
ln ,
,
R
SS
S
=
+≤≤
≤
⎧
⎨
⎩
ln 0
ln
1
2
βδ
αδ
All possible two-line models were fit iteratively (i.e., values
of
α
2
and
β
1
were assumed), and their intersection point (
δ
)
was then estimated. The algorithm of Julious (2001) for fit
-
ting a model with one unknown change point was used. The
model that minimized the residual sum of squares was se
-
lected to give a final value of
δ
and the associated value of
α
2
, indicating the level at which R plateaus for values of S
that are greater than
δ
.
Results
Comparison of SSB and len-SSB
To confirm that the conversion from age- to length-based
descriptors of the stock did not result in major distortion, the
values of SSB (eq. 1) and len-SSB (eq. 2) were compared.
The two values were close (average difference between len-
SSB and SSB expressed as a percentage of SSB: 1.8%), and
the mean of the difference between them was not signifi-
cantly different from 0 (paired t test, df = 55, p = 0.13).
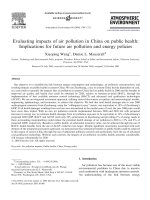
Time trends in the proportion of females
The proportion of SSB consisting of females (i.e., len-
FSB/SSB) is not constant and equal to 0.5 (Fig. 8a). Instead,
len-FSB/SSB ranges between a maximum of 0.68 in 1948
and a minimum of 0.24 in 1987. Values of len-FSB/SSB
were below 0.5 in approximately 57% of the years, indicat-
ing that the spawning stock has been dominated by males for
a majority of the full time period. In extreme years (e.g., the
late 1980s), males comprise approximately three-quarters of
the SSB. Over the full time period, there have also been dra
-
matic changes in the size composition of the spawning
stock. Values of SS
len
were generally high (>75 cm) until the
mid-1970s when they decreased by more than 30 cm, from a
maximum of 91.7 cm in 1974 to a minimum of 60.9 cm in
1988 (Fig. 8a). There is a statistically significant, positive
correlation between SS
len
and len-FSB/SSB (r = 0.71, df =
55, p < 0.001), indicating that SSB becomes progressively
male-biased as the length composition shifts towards
smaller-sized fish.
Time trends in relative fecundity of the stock
Relative fecundity of the stock exhibits a threefold level
of variation, ranging from a maximum of 355 eggs·g
–1
in
1974 to a minimum of 115 eggs·g
–1
in 1987 (Fig. 8b). Note
that because SSB includes noncontributing males, these
values of relative fecundity of the stock are much lower than
values of relative fecundity estimated for an individual fe
-
male. As was the case for len-FSB/SSB, interannual varia
-
tion in relative fecundity of the stock is being driven by
variation in size composition of the spawning stock, as rep
-
resented by SS
len
(Fig. 8b), and there is a significant, posi
-
tive correlation between them (r = 0.70, df = 55, p < 0.001).
Since 1980, a majority of years (15 out of 22) have been be
-
© 2006 NRC Canada
Marshall et al. 987
low the long-term (1946–2001) mean relative fecundity of
235 eggs·g
–1
.
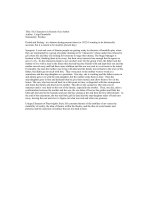
Depensatory vs. compensatory production dynamics
Using SSB as an index of reproductive potential for the
1946–1998 year classes, the fitted Saila–Lorda model had a
γ
value of 1.044 (Table 2), which is very close to 1 and sug
-
gests that the functional form of the relationship between R
and SSB for the full time period is approximately compensa
-
tory (Fig. 9a ). The Saila–Lorda models for both len-FSB
(Fig. 9b) and len-TEP (Fig. 9c) gave values of
γ
that were
less than 1 (Table 2), suggesting that there was overcompen
-
sation in the stock–recruit relationship. The values of S
p
for
SSB, len-FSB, and len-TEP were 705 000 t, 563 000 t, and
2.93 × 10
14
eggs, respectively. There were only small differ
-
ences among the three indices in values of R
p
, which ranged
from 7.19 × 10
8
to 7.41 × 10
8
(Table 2).
In approximately 1980, the spawning stock shifted to
-
wards a smaller-sized stock having reduced relative fecun
-
dity (Fig. 8). This reduction in productivity could have
repercussions for the stock–recruit relationship. Accordingly,
the stock–recruit relationships for the recent time period (re
-
presenting the year classes spawned in 1980–1998) were ex
-
amined separately. There was clearer evidence of a nonlin
-
ear stock–recruit relationship for the recent time period
(Figs. 9d–9f), and unlike the full time period (Figs. 9a–9c),
the scatterplots did not feature as many observations having
high values of R and low values of stock reproductive poten
-
tial. The fundamental changes to the stock dynamics (e.g.,
size composition, growth, and maturation) that took place
around 1980 in combination with the distinct improvement
to the fit of the stock–recruit relationship for the recent time
period prompted the ICES AFWG to consider using only the
recent time period for estimating biological reference points
(ICES Advisory Committee on Fishery Management 2003).
However, it was decided to base the estimation of the bio
-
logical reference points on the full time period. Recognizing
that this debate is not likely ended, results for both the full
and recent time periods are presented here. Using SSB as the
index of reproductive potential, the value of
γ
for the recent
time period was estimated to be 1.689, which is suggestive
of depensation (Fig. 9d). Because the lower inflection point
(123 000 t) exceeds the value of S
min
(108 000 t), there was
sufficient data near the origin to support the conclusion of
depensation. The stock–recruit relationships that used len-
FSB and len-TEP as indices of reproductive potential had
values of
γ
that were consistently less than 1 (Table 2), once
again suggesting overcompensation (Figs. 9e,9f). There
were relatively small differences among R
p
values (6.82 ×
10
8
,6.63×10
8
, and 6.47 × 10
8
for SSB, len-FSB and len-
TEP, respectively; Table 2). However, these R
p
values were
consistently lower than those for the full time period, sug-
gesting that there has been a decline in the maximum level
of recruitment.
Change points
δ
values were determined for the same six sets of stock–
recruit data that were used to fit Saila–Lorda models. For the
full time period, the values of
δ
for SSB, len-FSB, and len-
TEP were 186 570 t, 61 679 t, and 3.26 × 10
13
eggs, respec
-
tively (Table 3). Visually, the piecewise linear regression
models for the full time period were indistinguishable from
each other in terms of the relative position of
δ
(Figs. 10a–
10c). The R values associated with the horizontal line seg
-
ment (i.e.,
α
2
in eq. 16) ranged between 5.07 × 10
8
and
5.27 × 10
8
, which amounts to a small difference (~4%) be
-
tween them (Table 3). The three different indices of repro
-
ductive potential gave similar assessments of the proportion
of years in the 56-year time series when the stock was above
or below
δ
. Agreement between SSB and len-FSB about
whether stock status was inside (above
δ
) or outside (below
δ
) safe biological limits was achieved in 48 (85.7%) of the
56 years (Table 4). Similarly, there was agreement between
SSB and len-TEP in 49 (87.5%) of the 56 years (Table 4).
The value of
δ
for SSB in the recent time period (1980–
1998 year classes) was very close (within 3.8%) to the value
of
δ
estimated for the full time period (Table 3). For len-
FSB, the values of
δ
for the full and recent time periods were
exactly equivalent (Table 3). This was because for both the
full and recent time periods, the model-fitting procedures
used the same assumed values of
α
2
and
β
1
to iteratively fit
piecewise linear regression models. The value of
δ
for len-
TEP in the recent time period (6.33 × 10
13
) was nearly dou
-
© 2006 NRC Canada
988 Can. J. Fish. Aquat. Sci. Vol. 63, 2006
Fig. 8. (a) Time series of mean length of the spawning stock
(solid line) and the estimate of the ratio of female-only spawning
stock biomass (FSB) to total spawning stock biomass (SSB) (bro
-
ken line). (b) Time series of mean length of the spawning stock
(solid line) and the estimate of the ratio of total egg production
(TEP) to total spawning stock biomass (SSB) (broken line).
ble the value estimated for the full time period (3.26 × 10
13
),
and the R value associated with the horizontal line segment
in the recent time period was 6.17 × 10
8
compared with 5.14 ×
10
8
for the full time period (Table 3). As was the case for
the full time period, there was considerable agreement be
-
tween SSB and len-FSB in assessing stock status; the two
change points gave the same assessment of stock status in
20 (90.9%) of the 22 years (Table 4). The greatest difference
between the full and recent time periods was a lower level of
agreement between SSB and len-TEP about whether stock
status was inside or outside safe biological limits. In 5
(22.7%) of the 22 years, stock status was inside safe biologi
-
cal limits according to the change point for SSB, whereas
using the change point for len-TEP, the stock was judged to
be outside safe biological limits (Table 4). Thus, in over
20% of the years in the recent time period, len-TEP gives a
more pessimistic view of stock status than did SSB. There
were no years for which SSB judged stock status to be out
-
side safe biological limits and len-TEP inside safe biological
limits.
Discussion
This study has clearly shown that the dimorphic growth
and maturation that is characteristic of cod (Lambert et al.
2003) combined with size-dependent harvesting causes sex
ratios to become increasingly female-biased when the stock
has a high proportion of large individuals and increasingly
male-biased when the size composition is shifted towards
smaller sizes. By being selective with respect to size, fishing
mortality is changing the demographic composition with re-
spect to sex. Skewed sex ratios are likely to occur in other
commercially harvested fish stocks given that size dimor-
phism (either females or males being larger at maturity) is
widespread and often indicative of the reproductive strategy
of the species (Henderson et al. 2003). This result is consis
-
tent with other studies, indicating that at the population level,
sex ratios fluctuate to a considerable degree (Caswell and
Weeks 1986; Lindström and Kokko 1998; Pettersson et al.
2004). In some populations, variability in sex ratios is an
adaptive response that matches the proportional abundance
of males and females to current and expected fitness payoffs
(Trivers and Willard 1973; Clutton-Brock 1986). For other
populations, sex ratios are modified by externally applied se
-
lection pressures that are gender specific and variable in
time and (or) space. For example, female-biased sex ratios
have been noted for species that experience sport hunting for
male trophy animals (Milner-Gulland et al. 2003; Whitman
et al. 2004) and gender-specific mortality (Dyson and Hurst
2004).
Implications for conservation of cod stocks
There are several implications of skewed sex ratios for
fisheries management. Systematic variation in both the pro
-
portion of mature females contributes to variation in the rel
-
ative fecundity of the stock (i.e., TEP/SSB). Consequently,
the constancy assumptions that underlie the use of SSB in
stock–recruit relationships are invalid. As a result, SSB un
-
derestimates reproductive potential when the stock is domi
-
nated by large cod and overestimates reproductive potential
when the stock is dominated by small cod. The efficacy of
© 2006 NRC Canada
Marshall et al. 989
Full time Recent time
SSB FSB TEP SSB FSB TEP
α
1.61 (7.95) 4.78×10
2
(1.57×10
3
) 1.01×10
–2
(9.70×10
–2
) 7.82×10
–4
(5.18×10
–3
) 97.38 (447.46) 5.33×10
–5
(6.78×10
–4
)
β
1.48×10
–6
(1.03×10
–6
) 1.07×10
–6
(1.40×10
–6
) 1.91×10
–15
(3.09×10
–15
) 3.17×10
–6
(1.58×10
–6
) 1.87×10
–6
(2.75×10
–6
) 4.10×10
–15
(5.42×10
–15
)
γ
1.04 (0.42) 0.60 (0.30) 0.56 (0.31) 1.68 (0.56) 0.74 (0.43) 0.73 (0.41)
df 50 50 50 16 16 16
RSS 19.44 20.43 20.80 2.49 3.31 3.54
r
2
0.22 0.18 0.16 0.56 0.41 0.38
P 0.002 0.007 0.011 0.001 0.014 0.023
R
p
7.19×10
8
7.39×10
8
7.41×10
8
6.82×10
8
6.63×10
8
6.47×10
8
S
p
(t or no. eggs) 705 440 562 730 2.93×10
14
533 180 396 990 1.78×10
14
Note: Spawning stock biomass (SSB), female-only SSB (FSB), and total egg production (TEP) were used as the independent variable in the model. RSS denotes residual sum of squares. Standard er-
rors for parameter estimates are given in parentheses.
Table 2. Summary statistics for the Saila–Lorda model fit to data from the full time period (year classes 1943–1998) and the recent time period (year classes 1980–1998).
management protocols is impacted by a systematic bias, and
the magnitude of that bias is partly determined by the inten
-
sity and duration of fishing mortality, because stocks domi
-
nated by smaller-sized individuals often result from
sustained high fishing mortality. For example, in 1987 the
mean length of the spawning stock declined to 62.9 cm, just
slightly higher than the minimum for the full time period
(60.9 cm in 1988). This decline was largely due to the high
levels of fishing mortality sustained by the stock; from 1946
to 1988, the average fishing mortality on cod ages 5–10 in
-
creased steadily from 0.18 to 0.98 (ICES Advisory Commit
-
tee on Fishery Management 2002). In 1987, approximately
one-quarter of the SSB was female, and the relative fecun
-
dity of the stock was 115 eggs·g
–1
, which is approximately
one-half of the long-term mean value (235 eggs·g
–1
). Rus
-
sian and Norwegian authorities sharply reduced fishing mor
-
tality from 0.98 in 1989 to 0.27 in 1990 (ICES Advisory
Committee on Fishery Management 2002). As a result, the
relatively strong 1983 year class of cod was protected and
allowed to develop into a year class that sustained high total
egg production by the stock for 5 years starting in 1990
(Marshall et al. 1998). This stock recovery was fortuitous
© 2006 NRC Canada
990 Can. J. Fish. Aquat. Sci. Vol. 63, 2006
Full time Recent time
SSB FSB TEP SSB FSB TEP
δ
(t or no. eggs) 186 570 61 679 3.26×10
13
193 794 61 679 6.33×10
13
α
2
(thousands) 527 009 507 432 514 433 496 655 483 921 617 226
–2 ln likelihood 100.52 106.09 104.42 24.58 28.67 24.47
Note: Spawning stock biomass (SSB), female-only SSB (FSB), and total egg production (TEP) were used as the in
-
dependent variable in the model. Note that
δ
and
α
2
correspond to the S* and R*, respectively, as used in Barrowman
and Myers (2000). The value –2 ln likelihood is analogous to a measure of residual deviance and is included here as
a measurement of goodness of fit.
Table 3. Parameter estimates and summary statistics for the different change-point models.
Fig. 9. Stock–recruit relationships using different indices of reproductive potential and different time periods. (a) Spawning stock bio
-
mass (SSB) and full time period. (b) Female-only spawning stock biomass (FSB) and full time period. (c) Total egg production (TEP)
and full time period. (d) SSB and recent time period. (e) FSB and recent time period. (f) TEP and recent time period. The Saila–Lorda
model fit is shown (solid line) with 95% confidence intervals (dotted lines). The solid vertical lines indicate S
p
(eq. 15).
because it is clear from this study that management was un
-
aware of the true magnitude of the decline that had occurred,
because the index that was used (SSB) failed to accurately
account for the effect that variation in length composition
had on the reproductive potential of the stock.
Since the late 1980s, there have been substantial increases
in knowledge pertaining to the reproductive potential of indi
-
vidual cod (Kjesbu et al. 1998) and stocks (Köster et al.
2001; Marteinsdottir and Begg 2002). Incorporating a higher
degree of biological information into fisheries management
is therefore regarded as essential (Marteinsdottir and Begg
2002; Köster et al. 2003; Berkeley et al. 2004). This study
illustrates that there are no technical impediments to incor
-
porating alternative indices of reproductive potential into the
framework of the precautionary approach (e.g., change points).
However, fisheries management places a premium on using
management protocols that can be universally applied,
which makes it difficult to implement change. Failing to use
the best available knowledge puts data-rich stocks at a dis
-
advantage by constraining them to approaches that are suit
-
able for data-poor stocks. Furthermore, the data on sex ratios
and maturity required for estimating FSB are readily avail
-
© 2006 NRC Canada
Marshall et al. 991
Full time Recent time
SSB and FSB SSB and TEP SSB and FSB SSB and TEP
Both agree inside 42 (75.0%) 42 (75.0%) 16 (72.7%) 11 (50%)
Both agree outside 6 (10.7%) 7 (12.5%) 4 (18.2%) 6 (27.3%)
SSB inside, alternative outside 1 (1.8%) 1 (1.8%) 0 (0%) 5 (22.7%)
SSB outside, alternative inside 7 (12.5%) 6 (10.7%) 2 (9.1%) 0 (0%)
Note: Data correspond to the total number of years in the time period; data in parentheses correspond to the per
-
centage of years in the time period.
Table 4. A summary of the agreement between the two alternative indices of reproductive potential
(female-only spawning stock biomass (FSB) and total egg production (TEP)) and spawning stock bio
-
mass (SSB) about whether stock status is inside safe biological limits (value of S greater than change-
point value) or outside safe biological limits (value of S less than change-point value).
Fig. 10. Stock–recruit relationships using different indices of reproductive potential and different time periods. (a) Spawning stock bio
-
mass (SSB) and full time period. (b) Female-only spawning stock biomass (FSB) and full time period. (c) Total egg production (TEP)
and full time period. (d) SSB and recent time period. (e) FSB and recent time period. (f) TEP and recent time period. The piecewise
linear regression model fit is shown (solid line).
able for many stocks and species (Tomkiewicz et al. 2003).
Fecundity data are considerably more scarce (Tomkiewicz et
al. 2003). The approach taken in this study was to use a sta
-
tistical model developed using relatively recent (post-1980)
data to hindcast e
l
. Improved methods for measuring the fe
-
cundity of wild stocks have been developed (Murua et al.
2003) and in the future should encourage the acquisition of
new data on this key life history parameter.
For some species, a more biological approach to repre
-
senting reproductive potential in management has already
been adopted. In the northwest Atlantic, FSB is being used
to estimate threshold levels for spiny dogfish (Squalus acan
-
thias), and fecundity data, in terms of number of pups per
female at length, has been used in population projections
(Northeast Fisheries Science Center 2003). Because small
females produce smaller pups that may have a lower survival
rate, the population projections account for differential sur
-
vival rates (Northeast Fisheries Science Center 2003). Stock
projections for this depleted stock indicate that it will take
considerably longer to rebuild FSB compared with rebuild
-
ing SSB, because the former requires substantial increases in
the proportional representation of large individuals (North
-
east Fisheries Science Center 2003).
Implications for stock–recruit theory
Cod stocks that approach (e.g., Northeast Arctic stock of
Atlantic cod in 1987–1988) or reach (e.g., northern cod in
the early 1990s) a state of collapse provide valuable oppor-
tunities to delineate the origin of the stock–recruit relation-
ship more clearly and determine whether the underlying
production dynamics are compensatory or depensatory.
Using SSB as the index of reproductive potential for the
Northeast Arctic stock of Atlantic cod, the recent time pe-
riod suggested depensation, whereas the full time period
suggested compensation. However, if either len-FSB or len-
TEP was used as an index of reproductive potential, then
both the full or recent time periods exhibited overcompensa
-
tion. Other studies have found compensatory production
dynamics to be the norm among marine groundfish stocks
(Myers et al. 1995; Liermann and Hilborn 1997). All other
factors being equal, overcompensation should promote a
faster stock recovery given that production rate of recruits is
highest at the lowest levels of stock reproductive potential.
The trend near the origin of the stock–recruit relationship
is also important for determining change-point values that,
under the precautionary approach, indicate the level at which
recruitment becomes impaired. Comparing change points for
both the full and recent time periods showed that the assess
-
ments of stock status (in the sense of being inside or outside
safe biological limits) did not differ substantially using ei
-
ther SSB or len-FSB as the index of reproductive potential.
Accounting for both the considerable degree of interannual
variation in the sex ratios and the differential maturation
rates for males and females had relatively little impact on
the overall assessment of stock status. However, the change
point for len-TEP was more conservative than the change
point for SSB in the recent time period when the stock was
dominated by smaller-sized spawners; in 22.7% of the years,
the len-TEP change point classified the stock as being out
-
side safe biological limits and the SSB change point classi
-
fied the stock as being inside safe biological limits. This
result indicates that replacing a weight term (w
l
; eq. 3) with a
fecundity term (e
l
; eq. 4) that was sensitive to interannual
variation in relative condition (eq. 9) caused the change point
to behave more conservatively. To support the precautionary
approach, which advocates using a more risk-averse approach
where knowledge is limiting, a detailed sensitivity analysis
is required to estimate the relative effects the individual
components of reproductive potential have on the assess
-
ment of stock status.
The alternative indices of reproductive potential did not
substantially increase or decrease the explanatory power of
the stock–recruit relationship when compared with SSB. This
result contrasts with that for the Baltic stock of Atlantic cod,
which showed incremental improvements in the amount of
recruitment variation explained as increasing levels of bio
-
logical detail were incorporated into the alternative estimates
of reproductive potential (Köster et al. 2001; Marshall et al.
2003). The customary explanation of the weakness of the
stock–recruit relationship for fish stocks generally is that
there is a high degree of interannual variability in mortality
during early life history stages (Wooster and Bailey 1989).
For the Northeast Arctic stock of Atlantic cod, year-class
strength is frequently established during the egg and larval
stages (Sundby et al. 1989; Mukhina et al. 2003) when mor
-
tality rates are at a maximum. Indices describing the abun-
dance of settled juveniles show a higher degree of
correlation with subsequent recruitment, indicating that the
periods that are critical for establishing year-class strength
occur prior to settlement (Mukhina et al. 2003).
Given the importance of mortality during early life stages
for recruitment, it would be inappropriate to require the al-
ternative indices of reproductive potential to explain a sub-
stantially higher degree of recruitment variability than SSB
(notwithstanding that they do so for the Baltic stock of At-
lantic cod). They should not, however, explain substantially
less recruitment variation. For both the full and recent time
periods, the r
2
values obtained using the two alternative indi
-
ces of reproductive potential were slightly lower than that
obtained using SSB. However, given that the formulations of
both FSB (eq. 3) and TEP (eq. 4) include four terms rather
than the three terms that are used to estimate SSB (eq. 1),
the reductions in r
2
are small. The slight reduction in explan
-
atory power that would accompany replacing SSB with ei
-
ther of the two alternatives is a cost that must be judged
against the benefit of correcting for a systematic source of
bias and eliminating the need for the two constancy assump
-
tions that underlie the use of SSB.
A larger improvement in the explanatory power of the
stock–recruit relationship occurred when the time series for
the Northeast Arctic stock of Atlantic cod was restricted to
the recent time period only (1980–1998 year classes) and a
clearer density-dependent signal emerged. This observation
is consistent with the splitting of the stock–recruit relation
-
ship for the Baltic stock of Atlantic cod at 1980 to differenti
-
ate between the period when oxygen conditions were
favourable to egg and larval survival (1966–1980) and the
period when oxygen conditions were unfavourable (1981–
present) (ICES Advisory Committee on Fishery Manage
-
ment 1998). Given that discontinuities in the stock–recruit
dynamics for both cod stocks occurred circa 1980, it is pos
-
sible that large-scale changes in climate were responsible.
© 2006 NRC Canada
992 Can. J. Fish. Aquat. Sci. Vol. 63, 2006
While it remains to be shown if climate may have contrib
-
uted to a shift in the recruitment dynamics of the Northeast
Arctic stock of Atlantic cod circa 1980, several fundamental
demographic changes took place in the stock at the same
time. Comparing the pre- and post-1980 periods, it is evi
-
dent that the spawning stock in the former time period was
both larger and older compared with the more recent time
period, when the stock was dominated by smaller and youn
-
ger individuals. However, a large and relatively abrupt in
-
crease in length-at-age and weight-at-length (Marshall et al.
2004) and in the proportion mature-at-length occurred near
1980. Thus, the negative effect of a decline in the propor
-
tional abundance of large fish on reproductive potential was
partially compensated for by the positive effect of higher
growth and maturation rates of smaller fish.
In conclusion, the exceptionally high fecundity of many ma
-
rine fish species engendered a belief in their inexhaustibility
that was used to justify excessive rates of exploitation
(Kurlansky 1999). A trace of this naive belief persists in our
current approach to quantifying the reproductive potential of
fish stocks that assumes that relative fecundity of the stock
is constant over time. This study is one of several recent in
-
vestigations that have illustrated the fallibility of oversimpli
-
fied assumptions about reproductive potential of cod stocks.
The factors contributing to bias in SSB (excessive fishing
mortality, variable size composition, variable fecundity, di-
morphic growth) apply to other cod stocks and possibly
many other species. For many stocks, sufficient data are
available to correct for the bias, and there are no technical
impediments to using the alternative indices of reproductive
potential within the framework of the precautionary approach
(Morgan and Brattey 2004). Thus, the continued use of a
flawed estimator of stock reproductive potential is not scien-
tifically defensible. Incorporating greater biological realism
into the metrics that are used by cod stock management to
assess stock status will enhance our ability to quantify the
true effect of fishing on reproductive potential.
Acknowledgements
X. Lambin, B. Bogstad, and two anonymous referees are
thanked for their comments on earlier drafts. A. MacLay fa
-
cilitated the collaboration between CTM and CLN. CTM
was partially supported by funding from the Norwegian Re
-
search Council (Project No. 130197/130). AT and OSK were
partially supported by funding from the European Union
(Q5RS-2002-01825).
References
Ajiad, A., Jakobsen, T., and Nakken, O. 1999. Sexual difference in
maturation of Northeast Arctic cod. J. Northwest Atl. Fish. Sci.
25: 1–15.
Allee, W.C., Emerson, A.E., Park, O., Park, T., and Schmidt, K.P.
1949. Principles of animal ecology. W.B. Saunders Co., Phila
-
delphia, Penn.
Barrowman, N.J., and Myers, R.A. 2000. Still more spawner–
recruitment curves: the hockey stick and its generalizations.
Can. J. Fish. Aquat. Sci. 57: 665–676.
Berkeley, S.A., Chapman, C., and Sogard, S.M. 2004. Maternal age
as a determinant of larval growth and survival in a marine fish,
Sebastes melanops. Ecology, 85: 1258–1264.
Blanchard, J.L., Frank K.T., and Simon, J.E. 2003. Effects of condi
-
tion on fecundity and total egg production of eastern Scotian
Shelf haddock (Melanogrammus aeglefinus). Can. J. Fish. Aquat.
Sci. 60: 321–332.
Brawn, V.M. 1962. Reproductive behaviour of the cod (Gadus
callarias L.). Behaviour, 18: 177–198.
Caddy, J.F., and Mahon, R. 1995. Reference points for fisheries
management. Food and Agriculture Organization, Rome, Italy.
FAO Fish. Tech. Pap. No. 347.
Caswell, H., and Weeks, D.E. 1986. Two-sex models: chaos, ex
-
tinction, and other dynamic consequences of sex. Am. Nat. 128:
707–735.
Clutton-Brock, T.H. 1986. Sex ratio variation in birds. Ibis, 128:
317–329.
Dyson, E.A., and Hurst, G.D.D. 2004. Persistence of an extreme
sex-ratio bias in a natural population. Proc. Natl. Acad. Sci.
U.S.A. 101: 6520–6523.
Gilpin, M., and Soulé, M. 1986. Minimum viable populations: pro
-
cesses of species extinctions. In Conservation biology: the science
of scarcity and diversity. Edited by M. Soulé. Sinauer Associates
Inc., Sunderland, Mass. pp. 19–35.
Henderson, B.A., Collins, N., Morgan, G.E., and Vaillancourt, A.
2003. Sexual size dimorphism of walleye (Stizostedion vitreum
vitreum). Can. J. Fish. Aquat. Sci. 60: 1345–1352.
ICES Advisory Committee on Fishery Management. 1998. Report
of the Baltic Fisheries Assessment Working Group. ICES C.M.
1998/ACFM 16.
ICES Advisory Committee on Fishery Management. 2001. Report of
the Arctic Fisheries Working Group. ICES C. M. 2001/ACFM:19.
ICES Advisory Committee on Fishery Management 2002. Report of
the Arctic Fisheries Working Group. ICES C. M. 2002/ACFM 18.
ICES Advisory Committee on Fishery Management 2003. Report
of the Study Group on biological reference points for Northeast
Arctic cod. ICES C. M. 2003/ACFM 11.
Julious, S.A. 2001. Inference and estimation in a change point re-
gression problem. Statistician, 50: 51–61.
Kjesbu, O.S., Witthames, P.R., Solemdal, P., and Greer Walker, M.
1998. Temporal variations in the fecundity of Arcto-Norwegian
cod (Gadus morhua) in response to natural changes in food and
temperature. J. Sea Res. 40: 303–321.
Kraus, G., Tomkiewicz, J., and Köster, F.W. 2002. Egg production
of Baltic cod in relation to variable sex ratio, maturity, and fe
-
cundity. Can. J. Fish. Aquat. Sci. 59: 1908–1920.
Krebs, C.J. 1994. Ecology: the experimental analysis of distribu
-
tion and abundance. 4th ed. HarperCollins College Publishers,
New York.
Kurlansky, M. 1999. Cod: a biography of the fish that changed the
world. Vintage, Viborg, Denmark.
Köster, F.W., Hinrichsen, H H., St. John, M.A., Schnack, D., Mac
-
Kenzie, B.R., Tomkiewicz, J., and Plikshs, M. 2001. Developing
Baltic cod recruitment models. II. Incorporation of environmen
-
tal variability and species interaction. Can. J. Fish. Aquat. Sci.
58
: 1534–1566.
Köster, F.W., Schnak, D., and Möllmann, C. 2003. Scientific knowl
-
edge of biological processes that are potentially useful in fish
stock predictions. Sci. Mar. 67(Suppl. 1): 101–127.
Lambert, Y., Yaragina, N.A., Kraus, G., Marteinsdottir, G., and
Wright, P.J. 2003. Using environmental and biological indices as
proxies for egg and larval production of marine fish. J. North
-
west Atl. Fish. Sci. 33: 115–159.
Liermann, M., and Hilborn, R. 1997. Depensation in fish stocks: a
hierarchic Bayesian meta-analysis. Can. J. Fish. Aquat. Sci. 54:
1976–1984.
© 2006 NRC Canada
Marshall et al. 993
Lindström, J., and Kokko, H. 1998. Sexual reproduction and popu
-
lation dynamics: the role of polygyny and demographic sex dif
-
ferences. Proc. R. Soc. Lond. B Biol. Sci. 265: 483–488.
Marshall, C.T., Kjesbu, O.S., Yaragina, N.A., Solemdal, P., and
Ulltang, Ø. 1998. Is spawner biomass a sensitive measure of the
reproductive and recruitment potential of Northeast Arctic cod?
Can. J. Fish. Aquat. Sci. 55: 1766–1783.
Marshall, C.T., O’Brien, L., Tomkiewicz, J., Marteinsdottir, G., Mor
-
gan, M.J., Saborido-Rey, F., Köster, F.W., Blanchard, J.L., Secor,
D.H., Kraus, F., Wright, P., Mukhina, N.V., and Björnsson, H.
2003. Developing alternative indices of reproductive potential for
use in fisheries management: case studies for stocks spanning an
information gradient. J. Northwest Atl. Fish. Sci. 33: 161–190.
Marshall, C.T., Needle, C.L., Yaragina, N.A., Ajiad, A.M., and Gusev,
E. 2004. Deriving condition indices from standard fisheries data
-
bases and evaluating their sensitivity to variation in stored energy
reserves. Can. J. Fish. Aquat. Sci. 61: 1900–1917.
Marteinsdottir, G., and Begg, G.A. 2002. Essential relationships in
-
corporating the influence of age, size and condition on variables
required for estimation of reproductive potential in Atlantic cod
Gadus morhua. Mar. Ecol. Progr. Ser. 235: 235–256.
Marteinsdottir, G., and Thorarinsson, K. 1998. Improving the stock–
recruitment relationship in Icelandic cod (Gadus morhua L.) by
including age diversity of spawners. Can. J. Fish. Aquat. Sci. 55:
1372–1377.
Milner-Gulland, E.J., Bukreeva, O.M., Coulson, T., Lushchekina,
A.A., Kholodova, M.V., Bekenov, A.B., and Grachev, I.A. 2003.
Reproductive collapse in saiga antelope harems. Nature (Lon-
don), 422: 135.
Morgan, M.J., and Brattey, J. 2004. The use of indices of reproduc-
tive potential in the setting of reference points and stock projec-
tions. Northwest Atlantic Fisheries Organization, Dartmouth, N.S.
Sci. Res. Doc. 04/39.
Mukhina, N.V., Marshall, C.T., and Yaragina, N.A. 2003. Tracking
the signal in year-class strength of Northeast Arctic cod through
multiple survey estimates of egg, larval and juvenile abundance.
J. Sea Res. 50: 57–75.
Murua, H., Kraus, G., Saborido-Rey, F., Witthames, P.R., Thorsen,
A., and Junquera, S. 2003. Procedures to estimate fecundity of
marine fish species in relation to their reproductive strategy. J.
Northwest Atl. Fish. Sci. 33: 33–54.
Myers, R.A., Barrowman, N.J., Hutchings, J.A., and Rosenberg,
A.A. 1995. Population dynamics of exploited fish stocks at low
population levels. Science (Washington, D.C.), 269: 1106–1108.
Needle, C.L. 2002. Recruitment models: diagnosis and prognosis.
Rev. Fish Biol. Fish. 11: 95–111.
Northeast Fisheries Science Center. 2003. Report of the 36th
Northeast Regional Stock Assessment Workshop (37th SAW):
Advisory Report [online]. Available from sc.
noaa.gov/nefsc/publications/crd/crd0317/ [accessed 14 Novem
-
ber 2003; updated 13 April 2005]. Northeast Fisheries Science
Center, Woods Hole, Mass. Ref. Doc. 03-17.
Peters, R.H. 1991. A critique for ecology. Cambridge University
Press, Cambridge, UK.
Pettersson, L.B., Ramnarine, I.W., Becher, S.A., Mahabir, R., and
Magurran, A.E. 2004. Sex ratio dynamics and fluctuating selec
-
tion pressures in natural populations of the Trinidadian guppy,
Poecilia reticulate. Behav. Ecol. Sociobiol. 55: 461–468.
Quinn, T.J., II, and Deriso, R.B. 1999. Quantitative fish dynamics.
Oxford University Press, New York.
Ricker, W.E. 1975. Computation and interpretation of biological sta
-
tistics of fish populations. Bull. Fish. Res. Board Can. No. 191.
Scott, B., Marteinsdottir, G., and Wright, P. 1999. Potential effects
of maternal factors on spawning stock–recruitment relationships
under varying fishing pressure. Can. J. Fish. Aquat. Sci. 56:
1882–1890.
Shelton, P.A., and Healey, B.P. 1999. Should depensation be dis
-
missed as a possible explanation for the lack of recovery of the
northern cod (Gadus morhua) stock? Can. J. Fish. Aquat. Sci.
56: 1521–1524.
Shepherd, J.G. 1999. Extended survivors analysis: an improved
method for the analysis of catch-at-age data and abundance indi
-
ces. ICES J. Mar. Sci. 56: 584–591.
Sundby, S., Bjørke, H., Soldal, A.V., and Olsen, S. 1989. Mortality
rates during the early life stages and year-class strength of North
-
east Arctic cod (Gadus morhua L.). Rapp. P V. Reun. Cons. Int.
Explor. Mer, 191: 351–358.
Taylor, B., and Rojas-Bracho, L. 1999. Examining the risk of in-
breeding depression in a naturally rare cetacean, the vaquita
(Phoceana sinus). Mar. Mamm. Sci. 15: 1004–1028.
Tomkiewicz, J., Morgan, M.J., Burnett, J., and Saborido-Rey, F.
2003. Available information for estimating reproductive poten-
tial of northwest Atlantic groundfish stocks. J. Northwest Atl.
Fish. Sci. 33: 1–21.
Trivers, R.L., and Willard, D.E. 1973. Natural selection of parental
ability to vary the sex ratio of offspring. Science (Washington,
D.C.), 191: 249–263.
Whitman, K., Starfield, A.M., Quadling, H.S., and Packer, C. 2004.
Sustainable trophy hunting of African lions. Nature (London),
428: 175–178.
Wooster, W.S., and Bailey, K.M. 1989. Recruitment of marine fishes
revisited. In Effects of ocean variability on recruitment and an
evaluation of parameters used in stock assessment. Edited by R.J.
Beamish and G.A. McFarlane. Can. Spec. Publ. Fish. Aquat. Sci.
Vol. 108. pp. 153–159.
Yaragina, N.A., and Marshall, C.T. 2000. Trophic influences on
interannual and seasonal variation in the liver condition index of
Northeast Arctic cod. ICES J. Mar. Sci. 57: 42–55.
© 2006 NRC Canada
994 Can. J. Fish. Aquat. Sci. Vol. 63, 2006