Spatial Variation of Metal Concentrations in Watercourses of an Urban River Basin in Southeastern Brazil
Bạn đang xem bản rút gọn của tài liệu. Xem và tải ngay bản đầy đủ của tài liệu tại đây (2.72 MB, 14 trang )
Journal of Water and Environment Technology, Vol. 7, No. 4, 2009
- 317 -
Spatial Variation of Metal Concentrations in
Watercourses of an Urban River Basin in Southeastern
Brazil
Cristiano CHRISTOFARO, Mônica M.M.D. LEÃO
Department of Environmental and Sanitary Engineering, Federal University of Minas Gerais,
Escola de Engenharia, - Bloco II sala 4627. Av. Antônio Carlos, 6627 – Campus Pampulha.
Belo Horizonte-MG. CEP 31270-901. Brazil
ABSTRACT
Spatial patterns of water quality at 29 sites, in a mixed land use watershed located in
southeastern Brazil, were examined for eight metals, sampled over nine years —Arsenic,
Cadmium, Copper, Lead, Mercury, Nickel, Selenium, and Zinc. Data analysis included
delineation of the area of influence of each monitoring station, based on GIS analysis of Shuttle
Radar Topography Mission (SRTM) images, estimation of the upper prediction limit 95%
(UPL95) with censored data by the Kaplan-Meier technique, hierarchical cluster analysis (CA),
Kruskal-Wallis and Friedman test. The locations of the groups generated by CA agreed with land
and soil use and impact of anthropogenic activities. Use of UPL95 as entry data in CA allowed
better use and interpretation of monitoring data. Areas with natural background
metal-concentration levels in the drainage basin and areas of concern were identified.
Keywords: Water Quality; Urban basin; Censored data; Cluster Analysis; Heavy metals.
INTRODUCTION
Water quality of rivers reflects the interaction between natural (lithology, weathering,
precipitation, and erosion) and anthropogenic agents (urbanization, industrial and
agricultural activities, and water consumption) in the drainage area (Simeonov et al.,
2003; Shrestha and Kazama, 2007). Metals and metalloids can originate from natural
and anthropogenic sources and are important parameters in water-quality assessment.
They occur in the environment in a variety of forms, and their speciation and, hence
their bioavailability, is controlled by conditions such as pH and ligands, which can be
highly impaired by human activities (Chapman and Wang, 2000; Mendiguchia et al.,
2007).
Because of spatial and temporal variations in the concentrations of chemical species, a
monitoring program must provide reliable and representative estimation of the water
quality. A program of this kind must include water samples obtained from many sites at
a regular frequency during a long interval of time, thus resulting in a large data matrix
(Chapman, 1992). These datasets are often difficult to interpret, and the identification of
the possible factors that can influence the occurrence and concentration of a specific
metal is reasonably difficult (Simeonov et al., 2003). It becomes even harder when
different metals are considered and other quality parameters are included in the
monitoring program. The use of multivariate techniques and data reduction is almost
mandatory to achieve satisfactory results (Wuderlin et al., 2001).
Multivariate techniques include factor analysis, principal component analysis, cluster
analysis (CA), discriminant analysis, and neural networks. Each technique presents
different features and is accordingly used for achieving specific objectives (Wuderlin et
Address correspondence to Cristiano Christofaro,
Email:
Received July 10, 2009, Accepted October 30, 2009.
Journal of Water and Environment Technology, Vol. 7, No. 4, 2009
- 318 -
al., 2001). CA is a group of multivariate techniques used to assemble objects based on
the characteristics they possess. Hierarchical agglomerative clustering is the most
common approach, which provides intuitive similarity relationships between any of the
samples and the entire dataset, typically illustrated by a dendrogram (McKenna, 2003).
Hierarchical CAs are widely used in ecological work, and many applications in ground-
and surface-water quality assessment have been reported (Wuderlin et al., 2001; Astel et
al., 2007; Hussain et al., 2008). CA is also carried out to identify any analogous
behavior among different sampling stations or among measured variables in a dataset
from a monitoring program (Mendiguchía et al., 2007; Shrestha and Kazama, 2007).
Multivariate methods can also be used to optimize the number and the respective
locations of monitoring sites, thus reducing datasets and costs (Simeonov et al., 2003;
Shrestha and Kazama, 2007), and even to outline metalloregions (Fairbrother and
Mclaughlin, 2002).
Identification of the spatial variation patterns of surface-water quality must be
considered when establishing pollutant load–reduction goals and water-quality
management strategies. In this study, data from the Velhas River basin monitoring
program have been analyzed through hierarchical CA to (i) classify different areas of
the basin according to the concentration of metals and metalloids and (ii) establish
natural background levels for the basin.
MATERIALS AND METHODS
Study area
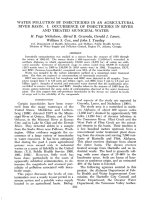
The Velhas River basin monitored is located at the central area of the Brazilian state of
Minas Gerais, between the coordinates 17°15’ and 20º25’, latitude south, and between
43º25’ and 44º50’, longitude west (Fig 1), and is the largest tributary of the São
Francisco River. The São Francisco basin is the largest river basin entirely contained
within Brazilian territory. The area of the Velhas River basin is 29.173 km², and the
length of the main river, which runs in a south-north direction, is 802 km. The basin
area includes 51 counties, with a population of nearly 4.8 million inhabitants (Fig. 1)
(Camargos, 2004).
Journal of Water and Environment Technology, Vol. 7, No. 4, 2009
- 319 -
Fig. 1 – Location of the study area and monitoring stations. Population size of adjacent
cities in the year 2000 is indicated by different colors (IBGE, 2002).
The upper Velhas river basin in the south includes Belo Horizonte, the sixth largest
Brazilian city (2.4 million people). Major economic activities are industry and mining.
Significant pollution loads are discharged into the tributary rivers, mainly from
domestic sewage and mining effluents. In the middle and lower sectors of the basin,
population density is lower, and agricultural activities and livestock production are
prevalent (Camargos, 2004).
Monitoring
The monitoring program, carried out by Minas Gerais Environmental Authority
(Instituto Mineiro de Gestão das Águas or IGAM), has 29 water-quality monitoring
stations in the Velhas river basin. Sampling, with frequency varied from quarterly to
half-yearly, was conducted in two periods (wet season and dry season), from 1998 to
2006, to account for the seasonal variation in the Velhas basin. The metals selected for
the present study were arsenic, cadmium, lead, copper, mercury, nickel, selenium, and
Journal of Water and Environment Technology, Vol. 7, No. 4, 2009
- 320 -
zinc. Sampling, preservation, and analysis were carried out according to APHA (1995)
(Table 1).
Table 1 - Metals, units and methods used for water quality analysis of the Velhas River
basin, 1998 to 2006 (IGAM, 2007).
Metal Unit Determination
Analytical
method
Detection
limit
As mg/L Atomic absorption spectroscopy – hydride generator APHA 3114B 0.0003
Cd mg/L Atomic absorption spectroscopy – graphite furnace APHA 3113B 0.0005
Pb mg/L Atomic absorption spectroscopy – graphite furnace APHA 3113B 0.005
Cu mg/L Atomic absorption spectroscopy – plasma APHA 3120B 0.007
Hg mg/L Atomic absorption spectroscopy – cold vapor APHA 3112B 0.0002
Ni mg/L Atomic absorption spectroscopy – graphite furnace APHA 3113B 0.004
Se mg/L Atomic absorption spectroscopy – hydride generator APHA 3114B 0.0005
Zn mg/L Atomic absorption spectroscopy – plasma APHA 3120B 0.002
Samples were collected using one-liter plastic bottles that had been cleaned with
detergents, soaked in 10% nitric acid and previously rinsed several times with distilled
water. Water samples were preserved by acidification with concentrated nitric acid to
pH < 2 (for Cd, Cu, Ni, Pb and Zn), potassium dichromate and sulphuric acid (Hg) or at
4ºC (As and Se) and stored in polythene bottles. Sampling bottles were kept in large
airtight plastic ice-cold containers at 4°C and transported to the laboratory within 6 h
from sampling for further processing.
In the laboratory, 10 ml samples were pipetted into a previously cleaned labeled tube.
The sampled aliquots and the standard solutions were digested with nitric acid (for Cd,
Pb, Ni, Zn, and Cu), acidic potassium persulphate (for As and Se), or sulphuric acid,
potassium permanganate, and potassium persulphate (for Hg). The digested samples
were then diluted to the initial volume of 10 ml with metal-free water and stored at 4°C.
The concentration of metals in water was analyzed using an atomic absorption
spectrometer. The quantification of metals was based upon calibration curves of
standard solutions of each metal. The precision of the analytical procedure, expressed as
the relative standard deviation (RSD), ranged from 1 to 10% (APHA, 1995).
Data analysis
Estimation of the 95% upper prediction limit
Censored data present a serious interpretation problem for statistical analysis, unless
previous manipulation is carried out (Helsel, 2005). Several methods to estimate the
population mean and the standard deviation based on left-censored datasets exist in
environment-related literature. The influence of censored data on statistical summary
has been discussed and evaluated in the studies by Helsel (1990, 2005), Singh and
Nocerino (2002), and Singh et al. (2006).
In this study, the upper prediction limit of 95% (UPL95) was used for each metal at
each monitoring point. UPL95 was chosen as the entry level for metal data in CA to
allow the inclusion of the worst water-quality conditions and to minimize the influence
of censored data. UPL95 should approximately provide the 95% probability interval of
future values of a set of samples and can be used to estimate the exposure-point
contamination of the areas of concern, determine the achievement of cleanup standards,
and finally estimate the natural background level for contaminant concentrations (Singh
Journal of Water and Environment Technology, Vol. 7, No. 4, 2009
- 321 -
et al., 2007).
The UPL95 for datasets with censored values was estimated using the Kaplan-Meier
method and resampling bootstrap procedure using PROUCL 4.0 software (Singh et al.,
2007). Detection limit was considered as UPL95 when 100% of the values were
censored and the UPL95 was estimated from the student’s t-distribution when all values
were greater than the detection limit.
CA of monitoring sites
CA was carried out with the software Minitab 15.0. Dendrograms were constructed
using the Euclidean distance, to measure similarity between samples, and by the Ward
method, to establish different clusters. The Ward method uses the analysis of variance
approach to evaluate the distance between the clusters. CA was applied after the data
was normalized to zero mean and unit variance (standardized data) in order to avoid
misclassifications arising from the different orders of magnitude of both numerical
value and variance of the parameters analyzed (Wunderlin et al., 2001; Simeonov et al.,
2003).
Data were classified and grouped according to their Euclidean distances, and the UPL95
values from each metal-monitoring site were depicted in box-and-whisker plots. A
Kruskal-Wallis and a Friedman test, a multiple comparison test between treatments
(Conover, 1999), were carried out using the R package 'agricolae' (R Development Core
Team, 2008; Mendiburo, 2009) to test for significant differences between groups (p <
0.05). The groups originated from the CA were then plotted in the basin map according
to incremental areas of influence of the monitoring stations.
Delineation of the areas of influence of monitoring stations
Delineation of the area of influence of each monitoring station was based on the basin
relief. Relief can be digitally represented as a pixel matrix with topographic values for
each cell. This matrix is known as terrain numeric model and can be obtained by
satellite and radar images (Burrough and Mcdonnell, 1998). In this study, images from
the Shuttle Radar Topographic Mission (SRTM) were used. For South America, SRTM
images have a resolution of 90 meters (Miranda, 2005).
Georeferenced water-monitoring stations, the Velhas River basin hydrographic network,
and the limiting areas were coupled with SRTM images. Influence areas were delineated
automatically by image treatment (Tarboton, 2005). Sub-basin boundaries were
established by the software MapWindow GIS 4.5.