Volatile Organic Compound (VOC) measurements in the Pearl River Delta (PRD) region, China pdf
Bạn đang xem bản rút gọn của tài liệu. Xem và tải ngay bản đầy đủ của tài liệu tại đây (2.34 MB, 15 trang )
Atmos. Chem. Phys., 8, 1531–1545, 2008
www.atmos-chem-phys.net/8/1531/2008/
© Author(s) 2008. This work is distributed under
the Creative Commons Attribution 3.0 License.
Atmospheric
Chemistry
and Physics
Volatile Organic Compound (VOC) measurements in the Pearl
River Delta (PRD) region, China
Ying Liu
1
, Min Shao
1
, Sihua Lu
1
, Chih-chung Chang
2
, Jia-Lin Wang
3
, and Gao Chen
4
1
State Joint Key Laboratory of Environmental Simulation and Pollution Control, College of Environmental Sciences and
Engineering, Peking University, Beijing, China
2
Research Center of Environment Change, Academia Sinica, Nankang, Taipei 115, Taiwan
3
Department of Chemistry, National Central University, Chungli 320, Taiwan
4
NASA Langley Research Center, Hampton, VA 23681, USA
Received: 3 September 2007 – Published in Atmos. Chem. Phys. Discuss.: 16 October 2007
Revised: 6 February 2008 – Accepted: 13 February 2008 – Published: 13 March 2008
Abstract. We measured levels of ambient volatile organic
compounds (VOCs) at seven sites in the Pearl River Delta
(PRD) region of China during the Air Quality Monitoring
Campaign spanning 4 October to 3 November 2004. Two of
the sites, Guangzhou (GZ) and Xinken (XK), were intensive
sites at which we collected multiple daily canister samples.
The observations reported here provide a look at the VOC
distribution, speciation, and photochemical implications in
the PRD region. Alkanes constituted the largest percentage
(>40%) in mixing ratios of the quantified VOCs at six sites;
the exception was one major industrial site that was domi-
nated by aromatics (about 52%). Highly elevated VOC lev-
els occurred at GZ during two pollution episodes; however,
the chemical composition of VOCs did not exhibit notice-
able changes during these episodes. We calculated the OH
loss rate to estimate the chemical reactivity of all VOCs. Of
the anthropogenic VOCs, alkenes played a predominant role
in VOC reactivity at GZ, whereas the contributions of reac-
tive aromatics were more important at XK. Our preliminary
analysis of the VOC correlations suggests that the ambient
VOCs at GZ came directly from local sources (i.e., automo-
biles); those at XK were influenced by both local emissions
and transportation of air mass from upwind areas.
1 Introduction
The Pearl River Delta (PRD) is located in Southern China,
extends from the Hong Kong metropolitan area to the north-
west, and encompasses 9 cities in the Guangdong Province
(Fig. 1). The PRD region has an area of about 41 698 km
2
Correspondence to: Min Shao
()
and a population of about 45.5 million. It has been the most
economically dynamic region of mainland China over the
last two decades, with a per capita GDP of US$ 6583 in
2004. The average annual rate of GDP growth in the PRD
from 2000 to 2004 was 13.6%, which is well above the na-
tional GDP growth rate (8.6%) (China Yearbook of Statistics,
2004). Guangzhou (GZ), the capital of Guangdong Province,
had the highest GDP value (US $ 496billion) in the PRD re-
gion in 2004. Dongguan (DG) is the city with the fastest
growth rate GDP (18.7% per year from 2002–2006); it is
a major manufacturing base for a wide range of products,
including electronics, communication, paper, garments and
textiles, food, shoes, and plastic.
Associated with the rapid economic development are the
high levels of PM
2.5
and ozone that have been observed in
the PRD region over the past decade (Wang et al., 2003).
Concentrations of ozone at GZ rose dramatically during the
1990s. For example, daily average O
3
concentrations ex-
ceeded the second level criterion (80 ppbv, hourly) of the
Chinese National Ambient Air Quality Standard (NAAQS)
on at least 5 days in October 1995 (Zhang et al. 1998). Be-
tween October and December 2001, the highest hourly O
3
average reached 142 ppbv at Tai O, a rural/coastal site in
southwest Hong Kong on the north–south centerline of the
Pearl Estuary (Wang et al., 2003). The daily concentrations
of PM
2.5
observed in downtown of GZ reached 111 µg/m
3
in 2002, which is nearly twice the level recommended by the
US EPA (65 µg/m
3
, daily) (Li et al., 2005). Such high levels
of air pollutants present a serious public health issue.
NO
x
and volatile organic compounds (VOCs) are im-
portant precursors of ground-level ozone. The VOC im-
pact on ozone is closely related to the magnitude and the
species emitted from various sources. For instance, lique-
fied petroleum gas (LPG) leakage played an important role
Published by Copernicus Publications on behalf of the European Geosciences Union.
1532 Ying Liu et al.: VOC measurement in PRD, China
Liu et al, Figure 1
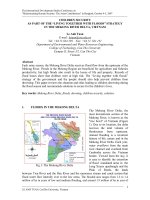
Fig. 1. Location of sites for the 2004 Air Quality Monitoring Cam-
paign in the Pearl River Delta (PRD). The star indicates intensive
sites, and the dots indicate sites for regional distribution sampling.
in causing excessive ozone in Mexico City and in Santi-
ago, Chile (Blake and Rowland, 1995; Chen et al., 2001).
The continuous high levels of atmospheric O
3
in summer in
Houston, Texas were caused mainly by reactive VOCs emit-
ted by petrochemical industries (Ryerson et al., 2003; Job-
son et al., 2004), and vehicular emissions have contributed
more than 50% of ambient VOCs in Beijing city (Liu et al.,
2005). Other studies have indicated the importance of bio-
genic sources of VOCs (Chameides et al., 1988; Shao et al.,
2000; Warneke et al., 2004; de Gouw et al., 2005).
In the PRD, VOC speciation and sources have been quite
intensively studied. The most representative work, which
was conducted in 2000 (Chan et al., 2006), provided the
first snapshot of VOC concentrations in industrial, industrial-
urban, and industrial-suburban areas and discussed the im-
portance of industrial and vehicular emissions in shaping the
spatial variation of VOCs. The measurements at Tai O (Wang
et al., 2005; Guo et al., 2006) which lies between the PRD
region and Hong Kong urban center, illustrated how the char-
acteristics of air masses varied with their point of origin, es-
pecially in terms of the differences in regional and local con-
tributions to ambient VOCs at the site.
Due to the complexity of VOC variation and the rapid
changes in VOC sources in the PRD region, more simultane-
ous measurements of ambient VOCs with CO, NOx, and O
3
are needed. An understanding of local VOC source profiles
will be helpful in interpreting the sources of VOCs in am-
bient measurements. The PRD air quality monitoring cam-
paign of 2004 represents the first regional study in China de-
signed to gain a better understanding of how ground-level
ozone is formed and to determine the sources of fine par-
ticles. The measurement of PRD VOCs was a joint effort
by the College of Environmental Sciences and Engineering
(CESE) of Peking University (PKU); the Research Center for
Environmental Changes of Academia Sinica (RCEC), Tai-
wan; and the Department of Chemistry of National Central
University, Taiwan. Herein we present the data on VOC dis-
tribution and speciation obtained at seven PRD sites and we
discuss their potential photochemical impacts. We explored
the contributions of various VOC sources by analyzing cor-
relations between VOC species as well as the co-variations
between VOC species and other gaseous pollutants.
2 Field measurements
2.1 Sampling sites
We sampled VOCs at seven sites in the PRD during Octo-
ber and November 2004 (Fig. 1). Two of them – Guangzhou
(GZ) and Xinken (XK) – were intensive sites, at which three
daily whole air sample (WAS) canisters were collected from
4 October to 3 November 2004. We also measured air pol-
lution tracers, including NO, NO
y
, O
3
, CO, and SO
2
, at the
intensive sites. The GZ and XK sites were thought to be rep-
resentative of a major metropolitan emission site and a recep-
tor site, respectively. We collected VOC samples at the other
five sites at the end of October. These five sites were Con-
ghua (CH), Huizhou (HZ), Foshan (FS), Zhongshan (ZS),
and Dongguan (DG).
Guangzhou is situated at the coast of the South China Sea
(21∼23
◦
N) and experiences a typical sub-tropical climate.
The GZ site is located in the downtown area of the city. We
collected canister samples at the roof of a 17-floor building
(about 55 m above ground). Xinken lies in a less populated
coastal area; it is a rural site located ∼50km to the southeast
of the city center. Ambient air was drawn at the third floor
platform of a building (about 10 m above ground). CH is a
rural site and HZ is a suburban one, and both are located up-
wind of the PRD region. We chose DG to examine industrial
emissions. FS and ZS, like GZ, are urban sites.
During the PRD air quality monitoring campaign of 2004,
abundant sunshine, mild temperature and breeze, and no pre-
cipitation characterized the weather. Under the influence of a
high-pressure system and stagnant conditions, the boundary
layer height was generally within 1 km. At GZ, a northerly
wind prevailed (mainly between NNW and NNE) and weak-
ened during the daytime. At XK, a northeasterly wind was
dominant (often between N and NE) in the morning, and a
sea breeze (a SE or ESE air stream) was observed in late af-
ternoon.
2.2 Sampling methods
We collected WAS in fused silica-lined stainless steel can-
isters (2L, 3.2 L, or 6L). The canisters were evacuated to
<100 mtorr, and then pressurized to ∼30psi with humid ni-
trogen at 95
◦
. After three cycles of filling and evacuation, the
canisters were ready for sample collection, with final vacu-
ums of <50mtorr. The stabilities of canister samples had
been examined by repetitive measurements of calibration gas
or ambient sample from canisters every several days after fill-
ing. Most of target compounds had good recoveries of more
Atmos. Chem. Phys., 8, 1531–1545, 2008 www.atmos-chem-phys.net/8/1531/2008/
Ying Liu et al.: VOC measurement in PRD, China 1533
than 87% over 30 days, and these results are consistent with
those in some earlier studies (Greenberg et al., 1992; Blake
et al., 1994; Batterman et al., 1998; Ochiai et al., 2002). An
ozone scrubber (Na
2
SO
3
trap) was installed in the sample
line to remove ozone, and a passive capillary (calibrated in
advance) was connected to the canister to keep the sampling
air flow rate constant.
Each day from 4 October to 3 November 2004, routine
samples were collected for 60 min at 05:30, 07:30, and 14:00
in GZ and at 07:30 and 14:00 in XK. The samples to examine
diurnal variation were taken every 2h for 30min from 06:00
to 22:00 at GZ and XK on 9 October, 21 October, and 3
November 2004. The samples at CH, HZ, FS, and ZS were
drawn for 60min at 08:00 and 17:00 on 20–22 October 2004.
Air samples were collected for 60 min at 08:30 and 16:30 at
DG on 3–4 November 2004.
2.3 Quantification of VOC species
The analysis of the canister samples was conducted in a
laboratory at PKU. Up to 134 species of VOCs were de-
tectable using a cryogenic pre-concentrator (Entech Instru-
ment 7100A, SimiValley, CA) and a gas chromatograph
(Hewlett Packard 6890) equipped with two columns and
two detectors (see detailed description in Liu et al. (2005)).
The C
2
-C
4
alkanes and alkenes were separated on a non-
polar capillary column (HP-1, 50m×0.32 mmID×1.05µm,
J&W Scientific) and quantified with a flame ionization de-
tector (FID). The C
5
-C
12
hydrocarbons were separated on
a semi-polar column (DB-624, 60 m×0.32 mm ID×1.8µm,
J&W Scientific) and quantified using a quadrupole mass
spectrometer (MS, Hewlett Packard 5973), which was op-
erated in Selected Ion Mode (SIM) with a maximum of six
ions being monitored for each time window. Three VOC
compounds were used as internal standards in calibration
of our analytical system, namely bromochloromethane, 1,4-
difluorobenzene and 1-bromo-3-fluorobenzene.
First, ambient air samples and internal standards were
pumped into the pre-concentrator, which has 3-stage cry-
otraps (Module 1∼3). VOC compounds were initially
trapped cryogenically on glass beads of Module 1 at −180
◦
C
by liquid nitrogen; then they were recovered by desorbing at
20
◦
C to leave most of the liquid H
2
O behind in the first trap.
The second cryotrap, which contains Tenax, was cooled to
−30
◦
C, which allows trapping of VOCs while letting CO
2
pass through. From Module 2, VOCs were backflushed at
180
◦
C then focused again at −180
◦
C in the Module 3 trap.
The Module 3 trap then was rapidly heated to 60∼70
◦
C in
30 s. Helium was used as the purge gas for the cryogenic
pre-concentrator and the carrier gas for the GC. Column HP-
1 was initially held at −50
◦
C for 3min, then was raised
to 164
◦
C at a rate of 6
◦
C/min; then to 200
◦
C at a rate of
14
◦
C/min, and finally was held for 0.5min. Column DB-624
was programmed to move from 30
◦
C to 180
◦
C at a rate of
6
◦
C /min and then was held for 5min at 180
◦
C.
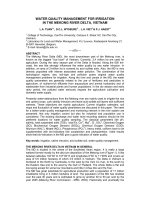
Liu et al, Figure 2
Fig. 2. Correlation of the measured and reference concentrations of
55 NMHCs in standard gas.
Table 1 summarizes the full list of the 134 VOC species
that were identified and quantified using a certificated stan-
dard of VOC mixture in ambient concentration (provided
by the Environmental Technology Center, Canada). We
performed calibrations at five concentrations from 0.1 to
25 ppbv for each compound before sample analysis. Correla-
tion coefficients, which ranged from 0.996 to 1.000, showed
that integral areas of peaks were proportional to concentra-
tions of target compounds. The definition of the method de-
tection limit (MDL) for each compound is given in EPA TO-
15, and the MDL for all measured VOC species ranged from
0.009 to 0.057 ppbv. The response of the instrument to VOCs
was calibrated after every eight samples using standard runs
of a calibration gas with ambient concentrations.
2.4 Inter-comparison experiment
To ensure the quality of the data, we conducted measure-
ment comparison exercises for both standard mixtures and
ambient samples. Two planned experiments were involved:
1) analysis at PKU of a known standard gas (provided by
D. R. Blake’s group from the Department of Chemistry, Uni-
versity of California at Irvine (UCI)); and 2) a blind inter-
comparison of WAS results measured separately by PKU and
RCEC.
Figure 2 shows the measurements made at PKU for 55
NMHC species in standard gas obtained from UCI; each
point represents one species, and error bars were computed
from over seven replicate measurements. The correlation be-
tween measured concentrations analyzed at the PKU lab and
the reference values were good (R
2
=0.96), and the averaged
slope was 1.09±0.04. The measured concentrations of alka-
nes were very close to their reference values, and the relative
standard deviation ranged from 0.9% to 9.6%. The relative
www.atmos-chem-phys.net/8/1531/2008/ Atmos. Chem. Phys., 8, 1531–1545, 2008
1534 Ying Liu et al.: VOC measurement in PRD, China
Table 1. VOC species quantified by the GC-MS/FID system.
Alkanes Alkenes Aromatics Halides
Ethane Ethylene Benzene Chloromethane
Propane Propene Toluene Bromomethane
Isobutane 1-Butene/Isobutene Ethylbenzene Chloroethane
n-Butane 1,3-Butadiene m/p-Xylene Bromoethane
2,2-Dimethylpropane trans-2-Butene o-Xylene 1,1-Dichloromethane
2-Methylbutane cis-2-Butene Styrene 1,1-Dichloroethane
Pentane 3-Methyl-1-butene Isopropylbenzene Chloroform
2,2-Dimethylbutane 1-Pentene n-Propylbenzene 1,1,1-Trichloroethane
2,3-Dimethylbutane 2-Methyl-1-butene 3-Ethyltoluene Carbontetrachloroide
2-Methylpentane trans-2-Pentene 4-Ethyltoluene 1,2-Dichloropropane
3-Methylpentane Isoprene 1,3,5-Trimethylbenzene Dibromomethane
n-Hexane cis-2-Pentene 2-Ethyltoluene Bromodichloromethane
2,2-Dimethylpentane 2-Methyl-2-butene tert-Butylbenzene 1,1,2-Trichloroethane
2,4-Dimethylpentane 4-Methyl-1-pentene 1,2,4-Trimethylbenzene Dibromochloromethane
Methylcyclopentane 3-Methyl-1-pentene iso-Butylbenzene 1,2-Dibromoethane
2-Methylhexane Cyclopentene sec-Butylbenzene 1,4-Dichlorobutane
Cyclohexane trans-4-Methyl-2-pentene p-Cymene 1,1,2,2-Tetrachloroethane
2,3-Dimethylpentane cis-4-Methyl-2-pentene 1,2,3-Trimethylbenzene 1,1-dichloroethylene
2,2-Dimethylhexane 2-Methyl-1-pentene 1,3-Diethylbenzene cis-1,2-dichloro-ethene
n-Heptane 2-Ethyl-1-butene 1,4-Diethylbenzene Trichloroethylene
2,5-Dimethylhexane trans-2-Hexene n-Butylbenzene tans-1,3-Dichloropropene
Methylcyclohexane trans-3-Methyl-2-pentene 1,2-Diethylbenzene Tetrachloroethylene
2,3,4-Trimethylpentane cis-2-Hexene Indan
2-Methylheptane cis-3-Methyl-2-pentene
4-Methylheptane 1-Methylcyclopentene Alkynes Chlorinated aromatics
3-Methylheptane Cyclohexene Acetylene Chlorobenzene
c-1,3-Dimethylcyclohexane 1-Heptene Propyne 1,3-Dichlorobenzene
t-1,4-Dimethylcyclohexane trans-2-Heptene 1-Butyne 1,4-Dichlorobenzene
Octane cis-2-Heptene Benzylchloride
t-1,2-Dimethylcyclohexane 1-Methylcyclohexene Chlorofluorocarbons (CFCs) 1,2-Dichlorobenzene
c-1,4/1,3-Dimethylcyclohexane 1-Octene Dichlorodifluoromehtane
c-1,2-Dimethylcyclohexane trans-2-Octene Chlorodifluoromethane Others
n-Nonane 1-Nonene 1,2-dichloro-1,1,2,2-tetrafluoro-ethane Acetonitrile
3,6-Dimethyloctane a-Pinene Trichlorofluoromehtane MTBE
n-Decane Camphene 1,1,2-trichloro-1,2,2-trifluoro-ethane
Dodecane b-Pinene
Limonene
1-Undecene
errors of n-butane, i-butane, n-pentane, 2-methyl pentane,
and 2-mehtyl hexane were below 5%; for >C7 alkanes the
relative errors were usually between 5.7% and 9.9%. The de-
viations of 1-butene/i-butene, trans-2-butene, 1-pentene, and
2-methyl-1-butene were 4.5%, 9.1%, 5.9%, and 9.5%, re-
spectively. For isoprene and α-pinene, the deviations from
the reference values were relatively larger, reaching 10.7%
and 13.4%, respectively. The averaged deviations of aromat-
ics were about 10%. Several scattered points, such as those
of cyclopentene, which deviated from the 1:1 dashed line in
Fig. 2, indicate the difference of the standards used at PKU
and RCEC lab to calibrate the NMHC species.
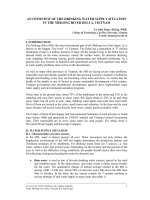
Both PKU and RCEC measured 50 VOC species from
the same 16 ambient canisters samples. Figure 3 shows
the results for some of the NMHC compounds. For most
of the alkanes, the slopes of the linear regression for PKU
versus RCEC measurements fell between 0.87 and 1.11,
with R
2
values over 0.9. For reactive alkene and aromat-
ics compounds, including butenes, cis-2-pentene, 3-methyl-
1-butene, benzene, toluene, xylenes, and trimethylbenzenes,
the measured mixing ratios calculated by the two labs also
agreed well within the combined uncertainties for each sys-
tem. However, the average α-pinene concentration measured
at PKU was about 30% lower than that from RCEC lab.
Atmos. Chem. Phys., 8, 1531–1545, 2008 www.atmos-chem-phys.net/8/1531/2008/
Ying Liu et al.: VOC measurement in PRD, China 1535
Liu et al, Figure 3
Fig. 3. Comparison of parallel WAS canisters between PKU and RCEC results for some (a) alkanes, (b) alkenes, and (c) aromatics.
3 Results and discussion
3.1 Mixing ratios of VOC species at Guangzhou and
Xinken
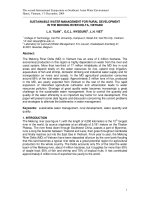
Figure 4 shows the averages of the total quantified PRD VOC
mixing ratios and the relative contributions from the major
VOC groups. The highest total VOC mixing ratio was mea-
sured at DG (an industrial area), followed by the major ur-
ban site GZ. The levels at XK, FS, and ZS were quite similar
to each other. All three sites lie downwind of industrial ar-
eas and/or major urban centers. The two lowest VOC values
were recorded in CH and HZ, which lie upwind of the major
cities.
Liu et al, Figure 4
Fig. 4. Regional distribution of mixing ratio (in volume percentage)
and chemical composition of VOCs at seven sites.
www.atmos-chem-phys.net/8/1531/2008/ Atmos. Chem. Phys., 8, 1531–1545, 2008
1536 Ying Liu et al.: VOC measurement in PRD, China
Table 2. The method detection limits (MDL; ppbv) and average mixing ratios of 54 NMVOCs measured at Guangzhou (GZ) and Xinken
(XK).
GZ GZ XK XK
Species MDL (ppbv) range average±s.d. range average±s.d.
Ethane 0.014 1.35–25.80 5.58±3.34 1.54–10.15 3.07±1.26
propane 0.010 3.16–57.24 10.35±8.53 0.99–15.14 3.51±2.90
Isobutane 0.016 0.70–17.09 2.93±2.57 0.21–6.26 1.26±1.23
n-Butane 0.035 1.19–28.30 5.07±4.42 0.38–13.51 2.71±2.79
2-Methylbutane 0.032 0.55–12.15 2.62±2.24 0.23–7.91 1.45±1.42
Pentane 0.011 0.21–4.67 1.19±1.07 0.09–5.98 1.10±1.25
2,2-Dimethylbutane 0.024 0.01–0.38 0.09±0.07 n.a.–0.38 0.07±0.07
2,3-Dimethylbutane 0.015 0.05–1.06 0.26±0.24 0.01–1.09 0.19±0.20
2-Methylpentane 0.019 0.18–4.44 1.03±0.94 0.07–5.46 0.83±0.92
3-Methylpentane 0.016 0.08–2.80 0.67±0.64 0.03–3.76 0.61±0.69
n-Hexane 0.024 0.11–3.45 0.84±0.80 0.04–5.83 0.89±1.03
Methylcyclopentane 0.011 0.06–2.00 0.53±0.49 0.01–2.72 0.39±0.47
2-Methylhexane 0.012 0.06–2.33 0.56±0.55 0.02–4.14 0.56±0.71
Cyclohexane 0.011 0.02–1.15 0.21±0.21 n.a.–1.32 0.20±0.24
2,3-Dimethylpentane 0.010 0.03–5.28 0.92±1.19 0.02–9.30 0.79±1.34
n-Heptane 0.009 0.07–2.53 0.63±0.61 0.02–4.04 0.57±0.71
Methylcyclohexane 0.013 0.04–1.89 0.38±0.34 n.a.–1.81 0.23±0.31
2-Methylheptane 0.015 0.02–0.72 0.15±0.14 n.a.–0.78 0.10±0.13
Octane 0.009 0.03–0.86 0.18±0.15 0.02–1.09 0.15±0.20
n-Nonane 0.017 0.01–0.44 0.12±0.08 0.01–0.73 0.10±0.11
n-Decane 0.009 0.02–0.43 0.10±0.09 n.a.–1.03 0.10±0.16
Ethene 0.027 1.95–28.35 6.55±4.82 0.64–13.11 2.68±2.19
Propene 0.018 0.45–17.88 3.02±2.84 0.14–5.49 0.87±0.86
1-Butene/Isobutene 0.020 0.25–4.44 1.33±0.91 0.06–1.80 0.44±0.41
1,3-Butadiene 0.024 0.03–0.81 0.20±0.17 n.a.–0.64 0.08±0.11
trans-2-Butene 0.009 0.02–1.89 0.40±0.36 n.a.–0.34 0.06±0.08
cis-2-Butene 0.018 0.02–1.87 0.38±0.33 n.a.–0.46 0.06±0.08
3-Methyl-1-butene 0.012 n.a.–0.38 0.09±0.07 n.a.–0.16 0.03±0.03
1-Pentene 0.029 0.04–0.73 0.18±0.14 n.a.–0.52 0.09±0.10
2-Methyl-1-butene 0.026 0.02–1.08 0.27±0.23 n.a.–0.85 0.10±0.14
trans-2-Pentene 0.009 0.01–1.12 0.24±0.23 n.a.–0.50 0.07±0.11
Isoprene 0.010 n.a.–0.67 0.22±0.17 n.a.–0.80 0.17±0.15
cis-2-Pentene 0.006 n.a.–0.58 0.12±0.12 n.a.–0.28 0.04±0.06
2-Methyl-2-butene 0.013 0.01–1.35 0.24±0.29 n.a.–0.47 0.07±0.11
4-Methyl-1-pentene 0.021 0.02–0.48 0.19±0.10 n.a.–0.90 0.18±0.15
a-Pinene 0.009 n.a.–1.23 0.18±0.18 n.a.–1.18 0.17±0.22
Benzene 0.014 0.66–11.35 2.39±1.99 0.52–6.26 1.42±0.98
Toluene 0.016 0.76–36.91 7.01±7.33 0.54–56.41 8.46±9.94
Ethylbenzene 0.021 0.14–5.20 1.16±1.22 0.04–13.36 1.62±2.08
m/p-Xylene 0.024 0.17–5.19 1.46±1.42 0.03–17.67 1.94±2.95
o-Xylene 0.023 0.07–1.98 0.52±0.50 0.02–5.87 0.71±1.02
Styrene 0.008 0.01–2.30 0.20±0.37 n.a.–2.35 0.22±0.41
isopropylbenzene 0.007 0.01–0.15 0.04±0.03 n.a.–0.27 0.04±0.05
n-Propylbenzene 0.009 0.01–0.27 0.06±0.06 n.a.–0.52 0.06±0.08
3-Ethyltoluene 0.015 0.02–0.84 0.16±0.16 n.a.–1.04 0.10±0.17
4-Ethyltoluene 0.014 0.01–0.30 0.07±0.06 n.a.–0.43 0.05±0.08
1,3,5-Trimethylbenzene 0.020 0.02–0.31 0.06±0.06 n.a.–0.46 0.05±0.10
2-Ethyltoluene 0.010 0.01–0.29 0.06±0.06 n.a.–0.52 0.05±0.09
1,2,4-Trimethylbenzene 0.029 0.02–1.06 0.24±0.22 n.a.–1.81 0.18±0.32
1,2,3-Trimethylbenzene 0.012 n.a.–0.32 0.06±0.06 n.a.–0.58 0.05±0.10
1,4-Diethylbenzene 0.005 n.a.–1.58 0.10±0.21 n.a.–0.67 0.08±0.15
Chloromethane 0.020 0.80–1.56 1.18±0.21 0.79–1.64 1.15±0.22
Acetonitrile 0.039 0.11–1.57 0.66±0.29 0.31–1.26 0.66±0.18
MTBE 0.013 0.18–5.41 0.96±0.94 n.a.–3.27 0.47±0.61
Atmos. Chem. Phys., 8, 1531–1545, 2008 www.atmos-chem-phys.net/8/1531/2008/
Ying Liu et al.: VOC measurement in PRD, China 1537
Table 3. The 10 most abundant species and CO (ppbv) measured at Guangzhou and at Xinken.
Guangzhou, average Xinken, average 43 Chinese range Tai O
b
, Hongkong, average
urban site coastal/suburban site cities
a
rural/coastal site
Propane 10.7±8.9 Toluene 8.3±9.9 Ethane 3.7–17.0 Toluene 5.6±7.1
Acetylene 7.3±5.2 Acetylene 4.1±2.5 Acetylene 2.9–58.3 Acetylene 2.8±2.0
Toluene 7.0±7.3 Propane 3.5±2.9 Ethylene 2.1–34.8 Ethane 2.1±1.0
Ethylene 6.8±5.1 Ethane 3.0±1.3 Propane 1.5–20.8 Propane 2.0±2.2
Ethane 5.6±3.3 n-butane 2.7±2.8 Benzene 0.7–10.4 Ethylene 1.7±1.7
n-Butane 5.2± 4.4 Ethylene 2.7±2.2 Toluene 0.4–11.2 n-Butane 21.6±2.1
Propene 3.2±3.0 m/p-Xylene 1.9±2.9 n-Butane 0.6–14.5 Methyl chloride 0.9±0.2
i-butane 2.9±2.6 Ethylbenzene 1.6±2.1 i-Butane 0.4–4.6 Ethylbenzene 0.9
i-Pentane 2.7±2.3 i-Pentane 1.5±1.4 i-Pentane 0.3–18.8 Benzene 0.9
Benzene 2.4±1.9 Benzene 1.4±1.0 p-Xylene 0.2–10.1 i-Pentane 0.8
CO 867±552 CO 597±388 CO 525±323
a
Barletta et al. (2005)
b
Guo et al. (2006)
Figure 4 also shows that alkanes constituted the largest
group of VOCs at six (CH, HZ, GZ, FS, ZS, and XK) of the
seven sites, accounting for over 40% of the total. In contrast,
exceptionally high values of aromatics (about 52% of the to-
tal VOCs) characterized DG, the industrial site. The DG aro-
matics likely resulted from emissions of the plants associated
with textiles, furniture manufacturing, shoemaking, printing,
and plastics. XK lies downwind of DG; consequently, it had
the second highest faction of aromatics.
Table 2 summarizes the average concentrations and vari-
ations of 54 VOCs at GZ and XK, and Table 3 lists the 10
most abundant species observed at these two sites compared
with results from previous studies in Hong Kong and other
Chinese cities (Barletta et al., 2005; Guo et al., 2006). In
general, the PRD VOC mixing ratios fell within the ranges
reported for other Chinese cities. A pronounced similarity
existed between XK site and Hong Kong’s Tai O site. Large
fractions of aromatic compounds, especially toluene, were
observed at both sites. And XK and Tai O had similar levels
of light alkanes as well. Both sites lie downwind from indus-
trial sources of the inner PRD region, which might explain
the similarities.
In contrast, GZ had the highest concentration of propane,
likely due to the widespread domestic and vehicular use of
LPG. High levels of acetylene, toluene, ethylene, and ethane
at this site probably originated from several anthropogenic
sources such as vehicle exhaust, petrochemical industries,
and industrial uses of solvents. Vehicular emissions were
clearly identifiable from the significant levels of isobutane,
isopentane, and benzene. Finally, CO levels at GZ were
about 40% and 65% higher than those observed at XK and
Tai O, respectively.
3.2 Time series of VOCs at Guangzhou and Xinken
Figure 5 displays the time series of NO, CO, O
3
and VOCs
together with meteorological parameters observed at the GZ
site. It clearly shows two major pollution episodes character-
ized by significantly elevated NO and CO values. The first
episode occurred during 11–13 October and the second one
between 28 October and 1 November. The highest hourly
averages of VOCs were recorded during the morning hours
of episode one (i.e., 05:30 and 07:30 of 11 and 13 October),
when wind speed was relatively low (∼1.5m/s) and wind di-
rection had mostly switched from northeast or northwest to
south or southeast. Those VOC values are about 5∼7 times
higher than the typical values. The elevated VOC levels were
also found in the second pollution episode. In contrast, other
observed VOC enhancements (e.g., 17 and 24 October) were
not associated with highly elevated NO and CO. This sug-
gests that the observed high levels of VOCs may be attributed
to different sources or processes. In the case of O
3
, there
were 14 days with hourly averages exceeding 80ppbv, which
is the second grade of China’s NAAQS. However, a clear re-
lationship between these high ozone days and either VOC
levels or NO and CO levels was not observed. This may re-
flect the fact that ozone level is controlled by both advection
and local photochemistry.
The observations for XK are displayed as a time series in
Fig. 6. The NO levels were significantly lower at XK than at
GZ. The XK CO levels, on average, also were lower. In ad-
dition, the correlations between NO and CO enhancements
at XK were much weaker than those for GZ. Large VOC en-
hancement episodes, with levels more than a factor of two
greater than the typical values, occurred seven times between
7 October and 18 October. Total VOC level peaked at over
277 ppbv at XK on the morning of 12 October, but few corre-
sponding changes occurred in NO and CO (Fig. 6a). The O
3
www.atmos-chem-phys.net/8/1531/2008/ Atmos. Chem. Phys., 8, 1531–1545, 2008
1538 Ying Liu et al.: VOC measurement in PRD, China
Liu et al, Figure 5
Fig. 5. Time series of measured O
3
, CO, NO, total VOCs, temper-
ature, relative humidity, wind direction, and speed at Guangzhou
during the campaign.
levels observed in XK exceeded 80ppbv on 23 days within
the study period, and were generally higher than those seen
at GZ.
Figure 7 compares the episode days versus background (or
normal) conditions at GZ and XK. The average of the relative
contributions from alkanes, alkenes, and aromatics remained
quite constant or fluctuated within a narrow range at GZ and
XK (Fig. 7a). This suggests that the high VOC levels dur-
ing the episode days are likely due to meteorological condi-
tions favorable for accumulation of pollutants. Figure 7b il-
lustrates that during the pollution episodes at GZ, total VOC
levels were about 2–4 times higher than those in non-episode
days.
3.3 Diurnal variation at Guangzhou and Xinken
3.3.1 Guangzhou
Figure 8 illustrates the diurnal patterns of primary and sec-
ondary pollutants, using data from 21 October at the GZ site
as an example. The diurnal trend of total VOCs followed a
pattern similar to that of the primary pollutants, such as CO
and NO, but it differed from that of O
3
. The NO levels were
generally over 50% of the NO
y
concentrations, implying that
the air masses were influenced by fresh emissions. Further-
Liu et al, Figure 6
Fig. 6. Time series of measured O
3
, CO, NO, total VOCs, tempera-
ture, relative humidity, wind direction, and speed at Xinken during
the campaign.
more, the diurnal variation of the NO, NO
y
, CO and total
VOCs generally followed the traffic pattern of Guangzhou
City. The morning and late afternoon peaks were coincided
with traffic rush hours. The highest levels of VOCs, CO and
NO at 20:00∼21:00 were probably attributed to the heavy
traffic for traditional nighttime activities in the city and the
descent of boundary layer height at night. The evening peak
of SO
2
, indicating coal burning emissions from industrial
boilers, also reflected the influence of lower nocturnal bound-
ary layer.
3.3.2 Xinken
The diurnal patterns of VOC gases measured at XK were
quite different from those at GZ (Fig. 9). CO and VOC
tracked each other on 9 October, whereas no consistent diur-
nal variation for either CO or VOCs occurred on 21 October.
Unlike at GZ, ambient NO remained at much lower levels
and constituted only a small fraction of NO
y
, suggesting that
the air masses were more chemically aged at XK. The am-
bient NO and NO
y
spikes occurred around 10:00–11:00 a.m.
on both 9 October and 21 October, causing distinct decreases
in O
3
due to titration. As no corresponding enhancement in
CO and VOCs occurred and SO
2
displayed a similar trend
as NO
y
, these plumes probably originated from power plant
Atmos. Chem. Phys., 8, 1531–1545, 2008 www.atmos-chem-phys.net/8/1531/2008/
Ying Liu et al.: VOC measurement in PRD, China 1539
(a)
Liu et al, Figure 7
(a)
(b)
(b)
Liu et al, Figure 7
(a)
(b)
Fig. 7. (a) The average compositions and total concentration of
VOCs at Guangzhou and Xinken during the first polluted episode
and during non-episode days, and (b) the average composition and
total concentration of VOCs at 05:30 and 07:30 at Guangzhou dur-
ing the first polluted episode and during non-episode days.
emissions from upwind areas. The observations at XK sug-
gest that advection transport likely has a larger impact on
local air quality than do the local traffic sources.
Ozone had higher peak concentrations and much rapid
variations at XK than those recorded in GZ. The higher ozone
levels at XK were accompanied by lower levels of VOCs and
NO, indicating that the ozone did not result solely from local
photochemistry. As XK lies downwind of an urban region,
the mixing ratios of VOCs in the early morning were higher
than those from the same time period at GZ because of the
accumulation of VOCs at night as well as transport from up-
stream urban areas. This phenomenon appears to be more
Liu et al, Figure 8
Fig. 8. Diurnal variations of TVOCs, CO, NO, NO
y
, SO
2
and O
3
at Guangzhou on 21 October, 2004.
Table 4. The OH loss rate (s
−1
) of major VOC groups at
Guangzhou and Xinken during the campaign in 2004.
Sampling sites Alkanes Alkenes Aromatics Isoprene
Guangzhou 1.9±1.5 8.8±6.8 2.9±2.7 0.5±0.4
Xinken 1.2±1.3 3.2±3.4 3.2±4.5 0.4±0.4
apparent during periods of northerly wind. The wind vec-
tors at XK display a diurnal pattern; frequently, the northerly
wind shifted to the south during the nighttime hours or in the
early morning, and the land–sea breeze circulation had some
effects on the convection and recirculation of air pollutants
in the region.
3.4 VOC reactivity at Guangzhou and Xinken
OH loss rate (L
OH
) is frequently used as a gauge to mea-
sure the initial peroxy radical (RO
2
) formation rate, which
might be the rate-limiting step in ozone formation in polluted
air (Carter, 1994). While this approach does not account for
the full atmospheric chemistry of the compounds considered,
it does provide a simple approach to evaluate the relative
contribution of individual VOCs to daytime photochemistry
(Goldan et al., 2004). L
OH
is calculated as the product of the
OH reaction rate coefficient (k
OH
i
) and the ambient mixing
ratio ([VOC]
i
) of a given compound:
L
OH
=
[
VOC
]
i
× k
OH
i
We used Atkinson and Arey’s (2003) published k
OH
i
(Atkin-
son and Arey, 2003).
Table 4 lists the OH loss frequencies of the main VOC
groups at GZ and XK. Of the anthropogenic VOCs, reactive
www.atmos-chem-phys.net/8/1531/2008/ Atmos. Chem. Phys., 8, 1531–1545, 2008
1540 Ying Liu et al.: VOC measurement in PRD, China
Liu et al, Figure 9
(a)
(b)
Fig. 9. Diurnal variations of TVOCs, CO, NO, NO
y
, SO
2
and O
3
at XK on (a) 9 October and (b) 21 October, 2004.
olefins dominated the reactivity at GZ. The alkenes at GZ
represented 28.9% of the overall mixing ratios of the mea-
sured VOCs and ranged from 24.7 to 305.5 ppbv, and they
accounted for over 65% of the overall L
OH
s. In contrast, the
alkanes represented 47.1% of the overall mixing ratios but
only a small fraction (13%) of the overall L
OH
s. The contri-
bution of aromatics to VOC reactivity was ∼20%, which was
comparable with its percentage of the total mixing ratios.
At XK, the overall L
OH
s were lower than those at GZ,
and the relative contributions from aromatics and alkenes to
VOCs reactivity were similar. At lower mixing ratios of to-
tal VOCs, the L
OH
s of alkenes exceeded those of aromatics,
and with an increase of the total mixing ratios, the contri-
butions of aromatics were enhanced. For more polluted air,
the roles of aromatics were more important in photochemical
processes.
Because alkenes and aromatics played significant roles
in the reactivity of VOCs at GZ and XK, in the subse-
quent discussion we focus on the contributions of different
species of alkenes and aromatics at the two sites. At GZ,
all alkenes were classified into groups by their carbon num-
ber (Fig. 10a). The most important contributors to the L
OH
s
was C
4
alkenes (butenes), closely followed by propene and
pentenes. Isoprene was not the dominant species as expected;
this can be explained by the low emissions from plants in
the urban center. In the case of clean air, the contribution
of isoprene and monoterpenes was slightly increased. Hex-
enes and heptenes played a smaller role in OH loss due to
their low concentrations. Figure 10b shows the percentages
of aromatic groups at XK. Together with xylenes, toluene
played a predominant role in the reactivity of VOCs. Al-
though trimethyl-benzenes had larger rate coefficients, they
made a minor contribution because of their low concentra-
tions. The contribution of benzene, which was the most inert
compound among the observed aromatics, decreased from
the clean air to the polluted air.
3.5 Identification of VOC sources at Guangzhou and
Xinken
Determining the PRD VOC sources was a rather complex
task because it involved numerous sources in different cities.
To assess the VOC sources for four major groups – alka-
nes, alkenes, isoprene, and aromatics – we examined corre-
lations among the measured ambient VOC species and com-
pared them with the known correlations from primary emis-
sion sources.
Acetylene usually is associated with sources of incomplete
combustion of different fuels, such as combustion of gaso-
line, diesel, and LPG in vehicles, domestic use of LPG for
cooking (Blake and Rowland, 1995; Goldan et al., 2000)
and biomass burning (de Gouw et al., 2004). We used
methyl tert-butyl ether (MTBE), a gasoline additive used to
enhance its octane rating and combustion efficiency, as an
indicator for mobile sources including exhaust of gasoline-
powered vehicles and gasoline evaporation (Blake and Row-
land, 1995; Chang et al., 2003). Figure 11 shows strong cor-
relations of acetylene and ethylene with MTBE at GZ. Thus,
it is reasonable to conclude that gasoline-powered vehicles
are mostly likely the major sources of acetylene and ethylene
at GZ.
The ratios of ambient concentrations of two hydrocarbons
with similar reactivity remain constant at the value equal
to their relative emission rates from sources (Goldan et al.,
2000; Jobson et al., 2004). As mentioned above, the C
4
-
Atmos. Chem. Phys., 8, 1531–1545, 2008 www.atmos-chem-phys.net/8/1531/2008/
Ying Liu et al.: VOC measurement in PRD, China 1541
Figure 10
(a) (b)
Fig. 10. Relative contribution of measured alkenes and aromatics to OH loss rate at Guangzhou and Xinken, respectively.
C
5
alkenes were the most reactive groups at GZ. Correla-
tions between selected butene and pentene parings with sim-
ilar k
OH
values are shown in Fig. 12, compared to the re-
sults obtained from the Guangzhou Pearl River Tunnel sam-
ples in September 2004 (Fu et al., 2005). The trans-2-butene
and cis-2-butene in the atmosphere at GZ displayed excellent
correlation with the tunnel samples; the slope of the regres-
sion line of ambient data (1.067) is very close to that of the
tunnel samples (1.074). The trans/cis-2-pentenes obtained at
GZ and XK correlated to each other very well, and again
the regression line fit nicely with the trans/cis-2-pentenes
data points measured from the tunnel experiment (Fig. 12b).
The trans/cis-2-pentenes levels obtained at XK were more
scattered than that from GZ site at the lower concentrations
of these two species, which were likely impacted by other
sources. These findings suggest that reactive 2-butenes and
2-pentenes at GZ and XK resulted primarily from vehicle ex-
haust emissions.
The widespread use of LPG can be another significant
source of VOCs. Propane is one of the important compo-
nents of LPG fuel. For LPG-powered vehicles, major emis-
sions include light alkanes (i.e., propane, isobutene, and n-
butane) as well as some alkenes (e.g., butenes). The correla-
tions of n-butane and isobutane with propane were significant
(Fig. 13) at GZ with slopes of 0.48 (correlation coefficient
r=0.97) and 0.28 (correlation coefficient r=0.97), respec-
tively. The values of these two slopes agree well with those
measured in Mexico City (0.458 and 0.210), where VOCs
originated mainly from LPG leakage (Blake and Rowland,
1995). These correlations suggest that gasoline-powered ve-
hicles and LPG use are two important sources of light alka-
nes.
Liu et al, Figure 11
Fig. 11. Correlations of acetylene and ethylene with MTBE at
Guangzhou. The solid line is the regression line of the dots, and
the area within the dashed lines is the 95% confidence interval.
Acetylene and propane have similar photochemical life-
times but come from different sources: incomplete combus-
tion of fossil fuels or straws and LPG leakage, respectively.
The ratio of these two compounds at a given site can be used
to assess the relative importance of these two types of sources
(Goldan et al., 2000; Zhang et al., 2004). The ratios of acety-
lene and propane at different sites provide an overview on a
regional scale of the relative importance of these two sources
to ambient alkane species levels. Figure 14a shows the plot
of acetylene versus propane at six sites (GZ, XK, CH, HZ,
www.atmos-chem-phys.net/8/1531/2008/ Atmos. Chem. Phys., 8, 1531–1545, 2008
1542 Ying Liu et al.: VOC measurement in PRD, China
(a)
Liu et al, Figure 12
(a) (b)
(b)
Liu et al, Figure 12
(a) (b)
Fig. 12. Correlations between (a) trans-2-butene and cis-2-butene
and (b) trans-2-pentene and cis-2-pentene at Guangzhou (solid dots)
and Xinken (open circles) compared with Pearl River Tunnel sam-
ples (solid squares).
FS, and ZS). The ratios measured at XK, FS, and ZS agreed
well with those reported by Seila et al. (1989) for 39 urban
locations in the US (dashed line in Fig. 14). XK, FS, and ZS
had a ratio of acetylene to propane that characterizes an area
mostly influenced by vehicle exhaust emissions. The regres-
sion line of the GZ data diverged slightly from the dashed
line, and the slope of the acetylene versus propane (0.556)
regression at GZ was smaller than that measured in the sam-
ples related to mobile sources. These findings imply that
LPG leakage contributed more to ambient VOCs at GZ than
at the other sites, probably due to the higher percentage of
LPG used for residential energy and public transportation in
Guangzhou City.
Liu et al, Figure 13
Fig. 13. Correlations between propane and n-/iso-butane at
Guangzhou. The solid line is the regression line of the dots, and
the area within the dashed lines is the 95% confidence interval.
The major source of benzene is vehicular emissions,
whereas toluene is associated with industrial emissions, sol-
vent and fuel storage, and vehicle exhaust (Bravo et al.,
2002; Wang et al., 2002; Na et al., 2003). Toluene was the
most abundant VOC species observed in industrial areas of
the PRD; it is emitted directly from shoemaking, printing,
leather manufacturing, furniture making, coating and chem-
ical bonding agent production, and other chemicals plants
(He et al., 2002; Chan et al., 2006). In this study we used the
toluene/benzene ratio as a tool to evaluate the relative im-
portance of vehicular and industrial emissions on a regional
basis. Figure 14b shows the correlations between toluene and
benzene at GZ, XK, and DG compared with those measured
from tunnel samples in previous studies (Fu, 2005; Fu et al.,
2005). The slopes of toluene versus benzene at XK and DG
were similar; in both locales shoemaking is a major industry
housed in widespread factories. The higher toluene levels at
XK were impacted by the additional input of industrial emis-
sions from DG that were advected to XK from DG. The GZ
data fell between the linear regression lines of the tunnel and
DG data, suggesting that ambient toluene at GZ was affected
by both automotive and industrial sources.
Isoprene is one of the most reactive hydrocarbon species
and is used as a tracer for biogenic emissions. Vehicular ex-
haust also is a source of isoprene in cities (Borbon et al.,
2001). A good correlation (r=0.91) was found between iso-
prene and 1,3-butadiene in samples collected at the Pearl
River tunnel (Fig. 15). However, the mixing ratios of am-
bient isoprene did not correlate so well with 1,3-butadiene
measurement from the GZ site (r=0.51). Thus, the ambient
data falling on the vicinity of the regression line from tun-
nel samples were probably due to vehicle exhaust, and the
data points above the line with higher isoprene concentra-
tions were likely attributed to biogenic sources.
Atmos. Chem. Phys., 8, 1531–1545, 2008 www.atmos-chem-phys.net/8/1531/2008/
Ying Liu et al.: VOC measurement in PRD, China 1543
(a)
Liu et al, Figure 14
(a)
(b)
(b)
Liu et al, Figure 14
(a)
(b)
Fig. 14. (a) The correlation between acetylene and propane for
six sites (Guangzhou (GZ), Xinken (XK), Conghua (CH), Huizhou
(HZ), Foshen (FS), and Shongshan (ZS)), with a comparison with
39 cities studied in the US (shown as the dashed line); (b) The
correlation between toluene and benzene for GZ, XK, and Dong-
guan (DG), comparing ambient data to the Pearl River Tunnel study
(solid squares). The solid and dashed lines represent the regression
lines for the results from tunnel samples and ambient data at DG,
respectively.
4 Conclusions
Mixing ratios and chemical speciation of VOCs were mea-
sured intensively at GZ and XK as well as at five more sites
in the 2004 Air Quality Monitoring Campaign in the PRD.
We quantified up to 134 VOCs species, and the total VOC
levels varied from 10ppbv to over 200ppbv. GZ had a very
high level of propane, whereas Xinken, the suburban site,
had high mixing ratios of aromatics. The chemical compo-
sitions differed greatly among the seven sites, reflecting the
heterogeneous distribution of VOC sources in the region.
Liu et al, Figure 15
Fig. 15. The correlation between ambient isoprene and 1,3-
butadiene at Guangzhou, compared with the results from the Pearl
River Tunnel study.
We used the OH loss frequency to assess the chemi-
cal reactivity of VOC species. Reactive alkenes and aro-
matics influenced the VOC reactivity at GZ and XK, re-
spectively, whereas alkanes, which constituted the largest
portion (>45%) of overall VOC mixing ratios, comprised
merely <15% of the overall OH loss rate. At GZ, butenes
showed the greatest relative contribution, closely followed by
propene and pentenes; the heavier alkenes with low mixing
ratios accounted for a small faction of total VOC reactivity.
At XK, toluene and C
8
reactive aromatics made the largest
contribution to the OH loss rate.
Using correlations among VOC compounds, we evalu-
ated the relative importance of local emissions of VOCs at
different sites. We attributed the ambient acetylene, ethy-
lene, and other light alkenes at GZ to the local emissions
from gasoline-powered vehicles. The high level of propane
originated mostly from vehicles that consumed LPG fuel.
Aromatic species at GZ were influenced by on-road vehicle
emissions, industrial solvent use, and fuel evaporation. Due
to the limited data about the compositions of LPG at GZ, we
could not quantify the contribution of LPG exhaust and its
leakage. The toluene/benzene ratio showed that VOCs were
affected by emissions from solvent usage, fuel storage, and
industrial emission. Before we draw a clear conclusion, how-
ever, source profiles of paint, gasoline vapor, and industrial
emissions should be investigated carefully.
In comparison with the GZ site, the VOC sources that in-
fluence XK are more complex: The local emissions (from
ships, biomass burning, and power plants) are coupled with
transport of VOCs from cities (e.g., GuangZhou, DongGuan,
and Hong Kong) depending on prevailing wind. For exam-
ple, while the reactive butenes and pentenes at XK were
www.atmos-chem-phys.net/8/1531/2008/ Atmos. Chem. Phys., 8, 1531–1545, 2008
1544 Ying Liu et al.: VOC measurement in PRD, China
primarily from local emissions, the aromatics at XK did
not originate solely from local emission and likely were im-
pacted by transport from the upwind industrial area of DG.
Thus, controlling ozone levels at XK should not be confined
solely to management of local emissions. Detailed investiga-
tion at the site (e.g., analysis of the VOC variation with wind
direction) will be necessary for more reliable source identifi-
cation of ambient VOCs.
Acknowledgements. This work was supported by the China
National Natural Foundation (project number 40575059) and
the National Basic Research Program of China (973) (project
number 2002CB410801). G. Chen’s participation in this work
was supported by NASA’s Tropospheric Chemistry Program. The
authors would like to thank the students from RCEC, NCU, and
PKU: Cheng-Hsun Lai and Chieh-Heng Wang for their continuous
VOC measurements; Zhi-Ming Luo and Zhong-Ying Yu for their
NO
x
, CO, and O
3
measurements; and Hang Su for his helpful
discussion of the NO
x
and HONO data.
Edited by: J. Rinne
References
Atkinson, R. and Arey, J. Atmospheric degradation of volatile or-
ganic compounds, Chem. Rev., 103(12), 4605–4638, 2003.
Barletta, B., Meinardi, S., Rowland, F. S., Chan, C. Y., Wang, X.
M., Zou, S. C., Chan, L. Y., and Blake, D. R.: Volatile organic
compounds in 43 Chinese cities, Atmos. Environ., 39(32), 5979–
5990, 2005.
Batterman, S. A., Zhang, G. Z., and Baumann, M.: Analysis and
stability of aldehydes and terpenes in electropolished canisters,
Atmos. Environ., 32(10), 1647–1655, 1998.
Blake, D. R. and Rowland, F. S.: Urban Leakage Of Liquefied
Petroleum Gas And Its Impact On Mexico-City Air-Quality, Sci-
ence, 269(5226), 953–956, 1995.
Blake, D. R., Smith, T. W., Chen, T. Y., Whipple, W. J., and Row-
land, F. S.: Effects of Biomass Burning on Summertime Non-
methane Hydrocarbon Concentrations in the Canadian Wetlands,
J. Geophys. Res Atmos., 99(D1), 1699–1719, 1994.
Borbon, A., Fontaine, H., Veillerot, M., Locoge, N., Galloo, J. C.,
and Guillermo, R.: An investigation into the traffic-related frac-
tion of isoprene at an urban location, Atmos. Environ., 35(22),
3749–3760, 2001.
Bravo, H., Sosa, R., Sanchez, P., Bueno, E., and Gonzalez, L.:
Concentrations of benzene and toluene in the atmosphere of the
Southwestern area at the Mexico City Metropolitan Zone, At-
mos. Environ., 36(23), 3843–3849, 2002.
Carter, W. P. L.: Development Of Ozone Reactivity Scales For
Volatile Organic-Compounds, J. Air Waste Manage., 44(7), 881–
899, 1994.
Chameides, W. L., Lindsay, R. W., and Richardson, J. L.: The role
of biogenic hydrocarbons in urban photochemical smog: Atlanta
as a case study, Science, 241, 1473–1475, 1988.
Chan, L. Y., Chu, K. W., Zou, S. C., Chan, C. Y., Wang, X. M., Bar-
letta, B., Blake, D. R., Guo, H., and Tsai, W. Y.: Characteristics
of nonmethane hydrocarbons (NMHCs) in industrial, industrial-
urban, and industrial-suburban atmospheres of the Pearl River
Delta (PRD) region of south China, J. Geophys. Res Atmos.,
111(D11), D11304, doi:10.1029/2005JD006481, 2006.
Chang, C. C., Lo, S. J., Lo, J. G., and Wang, J. L.: Analysis of
methyl tert-butyl ether in the atmosphere and implications as
an exclusive indicator of automobile exhaust, Atmos. Environ.,
37(34), 4747–4755, 2003.
Chen, T. Y., Simpson, I. J., Blake, D. R., and Rowland, F. S.: Impact
of the leakage of liquefied petroleum gas (LPG) on Santiago air
quality, Geophys. Res. Lett., 28(11), 2193–2196, 2001.
China Yearbook of Statistics: National Bureau of Statistics of
China, 2004.
de Gouw, J. A., Cooper, O. R., Warneke, C., Hudson, P. K., Fehsen-
feld, F. C., Holloway, J. S., Hubler, G., Nicks, D. K., Nowak,
J. B., Parrish, D. D., Ryerson, T. B., Atlas, E. L., Donnelly, S.
G., Schauffler, S. M., Stroud, V., Johnson, K., Carmichael, G. R.,
and Streets, D. G.: Chemical composition of air masses trans-
ported from Asia to the U.S. WestCoast during ITCT 2K2: Fossil
fuel combustion versus biomass-burning signatures, J. Geophys.
Res Atmos., 109, D23S20, doi:10.1029/2003JD004202, 2004.
de Gouw, J. A., Middlebrook, A. M., Warneke, C., Goldan, P.
D., Kuster, W. C., Roberts, J. M., Fehsenfeld, F. C., Worsnop,
D. R., Canagaratna, M. R., Pszenny, A. A. P., Keene, W. C.,
Marchewka, M., Bertman, S. B., and Bates, T. S.: Budget of
organic carbon in a polluted atmosphere: Results from the New
England Air Quality Study in 2002, J. Geophys. Res Atmos.,
110(D16), D16305, doi:10.1029/2004JD005623, 2005.
Fu, L. L.: The Emission Characteristics for Anthropogenic VOCs
Sources in China , College of Environmental Science, Beijing,
China, Peking University, Master thesis, 2005 (in Chinese).
Fu Linlin, Shao Min, Liu Yuan, Liu Ying, Lu Sihua, and Tang
Dagang: Tunnel experimental study on the emission factors of
volatile organic compounds (VOCs) from vehicles (in Chinese),
J. Acta Scientiae Circumstantiae, 25(7), 879–885, 2005.
Goldan, P. D., Kuster, W. C., Williams, E., Murphy, P. C., Fehsen-
feld, F. C., and Meagher, J.: Nonmethane hydrocarbon and oxy
hydrocarbon measurements during the 2002 New England Air
Quality Study, J. Geophys. Res Atmos., 109(D21), D21309,
doi:10.1029/2003JD004455, 2004.
Goldan, P.D., Parrish, D. D., Kuster, W. C., Trainer, M., McKeen, S.
A., Holloway, J., Jobson, B. T., Sueper, D. T., and Fehsenfeld, F.
C.: Airborne measurements of isoprene, CO, and anthropogenic
hydrocarbons and their implications, J. Geophys. Res Atmos.,
105(D7), 9091–9105, 2000.
Greenberg, J. P., Zimmerman, P. R., Pollock, W. F., Lueb, R. A., and
Heidt, L. E.: Diurnal Variability of Atmospheric Methane, Non-
methane Hydrocarbons, and Carbon-Monoxide at Mauna-Loa, J.
Geophys. Res Atmos., 97(D10), 10 395–10413, 1992.
Guo, H., Wang, T., Blake, D. R., Simpson, I. J., Kwok, Y. H.,
and Li, Y. S.: Regional and local contributions to ambient non-
methane volatile organic compounds at a polluted rural/coastal
site in Pearl River Delta, China, Atmos. Environ., 40(13), 2345–
2359, 2006.
He, J., Chen, H. X., Liu, X. X., Hu, J. H., Li, Q. L., and He, F. Q.:
The analysis of various volatile solvents used in different indus-
tries in Zhongshan, South China Journal of Preventive Medicine,
28(6), 26–27, 2002 (in Chinese).
Jobson, B. T., Berkowitz, C. M., Kuster, W. C., Goldan, P. D.,
Williams, E. J., Fesenfeld, F. C., Apel, E. C., Karl, T., Lonneman,
W. A., and Riemer, D.: Hydrocarbon source signatures in Hous-
Atmos. Chem. Phys., 8, 1531–1545, 2008 www.atmos-chem-phys.net/8/1531/2008/
Ying Liu et al.: VOC measurement in PRD, China 1545
ton, Texas: Influence of the petrochemical industry, J. Geophys.
Res Atmos., 109(D24), D24305, doi:10.1029/2004JD004887,
2004.
Li, G. Y., Tang, X. L., Bi, X. H., Yi, F., Sheng, G. Y., and Fu,
J. M.: Composition and mutagenicity of particle sized fraction
from urban particulate matter in Guangzhou City, J. Acta Scien-
tiae Circumstantiae, 25(3), 319–323, 2005.
Liu, Y., Shao, M., Zhang, J., Fu, L. L., and Lu, S. H.: Distribu-
tions and source apportionment of ambient volatile organic com-
pounds in Beijing city, China, J. Environ. Sci. Heal. A, 40(10),
1843–1860, 2005.
Na, K., Kim, Y. P., and Moon, K. C.: Diurnal characteristics of
volatile organic compounds in the Seoul atmosphere, Atmos. En-
viron., 37(6), 733–742, 2003.
Ochiai, N., Tsuji, A., Nakamura, N., Daishima, S., and Cardin, D.
B.: Stabilities of 58 volatile organic compounds in fused-silica-
lined and SUMMA polished canisters under various humidified
conditions, J. Environ. Monitor., 4(6), 879–889, 2002.
Ryerson, T. B., Trainer, M., Angevine, W. M., Brock, C. A.,
Dissly, R. W., Fehsenfeld, F. C., Frost, G. J., Goldan, P. D.,
Holloway, J. S., Hubler, G., Jakoubek, R. O., Kuster, W. C.,
Neuman, J. A., Nicks, D. K., Parrish, D. D., Roberts, J. M.,
and Sueper, D. T.: Effect of petrochemical industrial emissions
of reactive alkenes and NOx on tropospheric ozone formation
in Houston, Texas, J. Geophys. Res Atmos., 108(D8), 4249,
doi:10.1029/2002JD003070, 2003.
Seila, R. L., Lonneman, W. A., and Meeks, S. A.: Determina-
tion of C2 to C12 ambient air hydrocarbons in 39 U.S. cities,
from 1984 through 1986, Washington, D.C., US Environ. Prot.
Agency, Rep. EPA/600/S3-89/059, 1989.
Shao, M., Zhao, M. P., Zhang, Y. H., Peng, L. X., and Li, J. L.:
Biogenic VOCs emissions and its impact on ozone formation in
major cities of China, J. Environ. Sci. Heal. A, 35(10), 1941–
1950, 2000.
Wang, T., Guo, H., Blake, D. R., Kwok, Y. H., Simpson, I. J., and
Li, Y. S.: Measurements of trace gases in the inflow of South
China Sea background air and outflow of regional pollution at
Tai O, Southern China, J. Atmos. Chem., 52(3), 295–317, 2005.
Wang, T., Poon, C. N., Kwok, Y. H., and Li, Y. S.: Character-
izing the temporal variability and emission patterns of pollu-
tion plumes in the Pearl River Delta of China, Atmos. Environ.,
37(25), 3539–3550, 2003.
Wang, X. M., Sheng, G. Y., Fu, J. M., Chan, C. Y., Lee, S. G., Chan,
L. Y., and Wang, Z. S.: Urban roadside aromatic hydrocarbons in
three cities of the Pearl River Delta, People’s Republic of China,
Atmos. Environ., 36(33), 5141–5148, 2002.
Warneke, C., de Gouw, J. A., Goldan, P. D., Kuster, W. C., Williams,
E. J., Lerner, B. M., Jakoubek, R., Brown, S. S., Stark, H.,
Aldener, M., Ravishankara, A. R., Roberts, J. M., Marchewka,
M., Bertman, S., Sueper, D. T., McKeen, S. A., Meagher, J.
F., and Fehsenfeld, F. C.: Comparison of daytime and night-
time oxidation of biogenic and anthropogenic VOCs along the
New England coast in summer during New England Air Qual-
ity Study 2002, J. Geophy. Res Atmos., 109(D10), D10309,
doi:10.1029/2003JD004424, 2004.
Zhang, J., Chameides, W. L., Wang, T., and Kiang, C. S.: Final Re-
port: HongKong and the Pearl River Delta Pilot Air Monitoring
Project: Pilot study on the use of atomospheric measurements
to manage air quality in Hong Kong and the Pearl River Delta
Project 1: Ground-level Ozone Pollution in Hong Kong, Civic
Exchange, Hong Kong, 2004.
Zhang, Y. H., Shao, K. S., and Tang, X. Y.: The Study of Urban
Photochemical Smog Pollution in China, Acta Scientiarum Na-
trualium, Universitatis Pekinenesis, 24(2–3), 392–400, 1998 (in
Chinese).
www.atmos-chem-phys.net/8/1531/2008/ Atmos. Chem. Phys., 8, 1531–1545, 2008