Credit Growth in Central and Eastern Europe: Emerging from Financial Repression to New (Over)Shooting Stars? potx
Bạn đang xem bản rút gọn của tài liệu. Xem và tải ngay bản đầy đủ của tài liệu tại đây (263.56 KB, 27 trang )
Credit Growth in Central and Eastern Europe:
Emerging from Financial Repression to New
(Over)Shooting Stars?
Balázs Égert
Peter Backé
y
Tina Zumer
z x
December 14, 2005
Abst ract
This paper analyses the equilibrium level of private credit to GDP in 11
Central and Eastern European (CEE) countries on the basis of a number
of dynamic panels containing quarterly data o n CEE economies, emerging
markets and developed OECD countries. In doing so, we propose a unify-
ing framework which inclu des factors dri ving both the deman d for and the
supply of private credit. We emph asise that relying on in-sample panel
estimates for transition econ omies is problematic not only because of the
possible upward bias of the e stimated constant and slope coe¢ cients due
to the initial undershooting and th e ensuing steady adjustment towards
equilibrium, but also because of instabilitiy of the equations esti mated
for transition economies. The use of out-of-sampl es sug gests that some
of the transition economies might have already come cl ose to equilibrium
by 2004, whereas others have privat e credit to GDP ratios, which are well
below the level what the fundamentals would justify.
JEL class i…cation: C31, C33, E44, G21
Keywords: credi t to the private sector, credit growth, equilibrium
level of credit, initial undershooting, transition econo mies
Oesterreichische Nationalbank; EconomiX at the University of Paris X -Nanterre and
William Davidson Institute. and be
y
Oesterreichische Nationalbank,
z
Europea n Central Bank, tina.zumer @ecb.int
x
We are indebted to Caralee McLiesh for sharing with us the dataset used in the paper
“Private credit in 129 countries” (NBER Working Paper No. 11078), to Ivanna Vladkova-
Ho llar for providing us with the …nancial liberalisation indicator, to Gerg
½
o K iss for sharing data
on housing prices in Hungary, and Rafal Kierzenkowski, Lubos Komárek, Mindaugas Leika and
Peete r Luikmel for help in obtaini ng housing prices for France , the Czech Republic, Lithuania
and Estonia, respecti vely. We also thank Steven Fries and Ta tiana Lysenko for the EBRD
tra nsition indicators going back to the early 1990s. The opinions expressed in this p aper
do not n ecessarily represent the views of the European Central Bank, the Oesterreichische
Na tionalbank or the European System of Central Banks (ESCB).
1
1 Introduction
The emerging literature on credit growth in transition economies has docu-
mented that lending to the private sector has recently grown dynamically in a
number of transition economies
1
. Credit growth has been promoted by macro-
economic stabilization, comprehensive reforms and privatization in the …nancial
sector, by the introduction of market institutions and legal reforms. Never-
theless, the recent boom in bank lending in Central and Eastern Eu rope has
prompted the question of whether the growth rates recorded in these countries
can be viewed as sustainable in the medium to long run.
In this paper, we investigate the macro- and micro econ omic determinants
and the equilibrium level of domestic credit to the private sector as percentage
of GDP in 11 CEE countries
2
. Our empirical model used for this purpose
can be viewed as a unifying framework, which includes both demand-side and
supply-side variables. Our empirical speci…cation is tested for a variety of panels
composed of (i) developed small and large OECD countries; (ii) emerging market
economies from Asia and the Americas; and (iii) a number of in-sample panels
for transition economies.
The use of these panels provides some interesting perspectives. First of all,
in-sample panels might give useful insights regarding the major determinants
of credit-to-GDP levels in Central and Eastern Europe. However, as …nancial
depth in most transition economies continues to be comparatively low, it might
well b e that private credit to GDP is still below its equilibrium level for most of
the last decade. If this were so, it would give rise to a bias in the econometric
estimates, as credit-to-GDP ratios tend to converge towards their equilibrium
levels
3
. The use of the OECD and emerging market panels may help to tackle
this problem. Results derived from the emerging markets panel may b e a good
benchmark for equilibrium levels at a medium term horizon, while estimates
based on the panel of small open OECD countries may show equilibrium levels
at a longer horizon at which the CEE countries will have caught up in terms of
overall economic development.
The paper is structured as follows. Section 2 reviews some stylised facts
regarding credit growth in the transition economies. Section 3 deals with initial
under- and overshooting of the credit-to-GDP ratio and with their consequences
for econometric testing. Section 4 presents the economic speci…cation used for
the estimations and describes the dataset and the estimation techniques. Se ction
5 then presents and discusses the estimation results. Finally, Section 6 draws
some concluding remarks.
1
See e.g. Cottarelli, Dell’Ariccia and Vladkova-Hollar (2003) and Backé and Zumer (2005).
2
Bulgaria, Croatia, Czech Republic, Estonia, Hungary, Lat via, Lithuania, Poland, Roma-
nia, Slovakia and Slovenia .
3
An analogous line of reasoning is applied in the literature to equilibrium exchange rate s
of Central and Eastern European count ries (Maeso-Fernandez, Osbath and Schnatz, 2005).
2
2 Some Stylised Facts
To place credit developments in transition economies into context, it is useful to
recall that …nancial systems in these countries are bank-based –about 85% of
…n ancial sector assets are bank assets –and that capital markets (in particular
corporate bond and stock market segments) are generally not very developed.
This implies that bank credit is the main source of external …nancing in these
countries, although also foreign direct investment (FDI) has been important in
some countries. Banking sectors in transition economies in Central and Eastern
Europe have undergone a comprehensive transformation in the past one-and-a-
half decades, including a complete overhaul of the regulatory framework, bank
consolidation s chemes and – in almost all countries – sweeping privatization,
mainly to foreign strategic owners (mostly …nancial institutions based in “old”
EU M embe r States). Consequently, the governance of banks has greatly im-
proved, and the performance and the health of banking sectors have advanced
substantially, as standard prudential indicators on capitalization, asset quality,
pro…tability and liquidity show
4
.
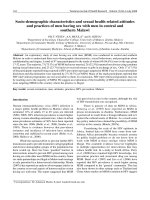
Figure 1 gives an overview on the development of the credit to the private
sector in percentage of GDP from the early 1990s to 2004. Several observations
can be made on the basis of Figure 2. First, some countries, namely Estonia,
Latvia, Lithuania, Poland, Romania and Slovenia started transition with low
credit-to-GDP ratios of around 20%. Estonia and Latvia then recorded a marked
increase in the ratio and the credit to GDP ratio was also rising steadily in
Slovenia from the early 1990s to 2004 although the overall increase was less
pronounced than in the two aforementioned Baltic countries. Credit growth
has only picked up recently in Lithuania and Romania and, for Poland, only
a moderate increase can be observed for Poland during the second half of the
period studied.
By contrast, the second group of countries, notably Croatia and Hungary,
started transition with higher cred it-to-GDP ratios higher than in the Baltic
countries. After a considerable drop to close to 20%, the ratio started to increase
reaching pre-transition levels in Hungary and well exceeding 40% in Croatia by
2004.
The third group of countries, comprising Bulgaria, the Czech Republic and
Slovakia had the highest credit-to-GDP ratio at the beginning of the period
(between 60% and 80%). For Bulgaria, this ratio came down to 10% in 1997,
while expanding to close to 40% by 2004. The Czech Republic and Slovakia also
recorded a substantial contraction (to nearly 30% for both countries), while the
ratios seem to have stabilised during the last couple of years.
The di¤erences in initial credit-to-GDP levels can be largely traced to dif-
ferent approaches with respect to the …nancing of (credit to) enterprises under
central planning across countries as well as strongly negative real interest rates
right before or at the start of transition in some cases. In turn, major tem-
porary contractions in credit-to-GDP ratios during the transition process have
4
See e.g. Barisitz (2005), Cottarelli et al. (2 003), ECB (2005) and EBRD (2005).
3
mainly been due to banking consolidation measures, by which non-performing
assets were removed from the banks’balance sheets. In a few cases , high in‡a-
tion episodes combined with strongly negative real interest rates have also con-
tributed to lowering …nancial depth temporarily during the transition process
(e.g. Bulgaria 1996/97).
Figure 1. Bank credit to the private sector as percentage of GDP, 1990-2004
Baltic Countries
Estonia
0%
20%
40%
60%
80%
1990q1
1991q1
1992q1
1993q1
1994q1
1995q1
1996q1
1997q1
1998q1
1999q1
2000q1
2001q1
2002q1
2003q1
2004q1
Latvia
0%
20%
40%
60%
80%
1990q1
1991q1
1992q1
1993q1
1994q1
1995q1
1996q1
1997q1
1998q1
1999q1
2000q1
2001q1
2002q1
2003q1
2004q1
Lithuania
0%
20%
40%
60%
80%
1990q1
1991q1
1992q1
1993q1
1994q1
1995q1
1996q1
1997q1
1998q1
1999q1
2000q1
2001q1
2002q1
2003q1
2004q1
Central and Eastern Europe - 5
Czech Republic
0%
20%
40%
60%
80%
1990q1
1991q1
1992q1
1993q1
1994q1
1995q1
1996q1
1997q1
1998q1
1999q1
2000q1
2001q1
2002q1
2003q1
2004q1
Hungary
0%
20%
40%
60%
80%
1990q1
1991q1
1992q1
1993q1
1994q1
1995q1
1996q1
1997q1
1998q1
1999q1
2000q1
2001q1
2002q1
2003q1
2004q1
Poland
0%
20%
40%
60%
80%
1990q1
1991q1
1992q1
1993q1
1994q1
1995q1
1996q1
1997q1
1998q1
1999q1
2000q1
2001q1
2002q1
2003q1
2004q1
Slovakia
0%
20%
40%
60%
80%
1990q1
1991q1
1992q1
1993q1
1994q1
1995q1
1996q1
1997q1
1998q1
1999q1
2000q1
2001q1
2002q1
2003q1
2004q1
Slovenia
0%
20%
40%
60%
80%
1990q1
1991q1
1992q1
1993q1
1994q1
1995q1
1996q1
1997q1
1998q1
1999q1
2000q1
2001q1
2002q1
2003q1
2004q1
South Eastern Europe
Bulgaria
-10%
10%
30%
50%
70%
90%
1990q1
1991q1
1992q1
1993q1
1994q1
1995q1
1996q1
1997q1
1998q1
1999q1
2000q1
2001q1
2002q1
2003q1
2004q1
Croatia
0%
20%
40%
60%
80%
1990q1
1991q1
1992q1
1993q1
1994q1
1995q1
1996q1
1997q1
1998q1
1999q1
2000q1
2001q1
2002q1
2003q1
2004q1
Romania
-10%
10%
30%
50%
70%
90%
1990q1
1991q1
1992q1
1993q1
1994q1
1995q1
1996q1
1997q1
1998q1
1999q1
2000q1
2001q1
2002q1
2003q1
2004q1
Source: Authors’ calculations based on data drawn from the IFS/IMF. For precise data de…nitions,
see Section 4.2.
4
3 Equilibrium Credit Growth
3.1 Initial Under- and Overshooting. . .
The question of whether or not credit growth in transition economies is excessive
is closely related to the issue of what the equilibrium level of the stock of bank
credit to the private sector as a share of GDP in those countries is. It is a widely
observed fact that economic development goes hand in hand with an increase in
the credit to GDP ratio. This is demon strated on Figure 2 when moving from
point A to C through B. The depicted trajectory of the inc rease in the credit
to GDP ratio (credit growth) can be thought of as an equilibrium phenomenon
insofar as it is in line with economic fundamentals, in particular with GDP per
capita …gures.
Nevertheless, we may also think of a situation when the observed credit to
GDP ratio is out of tune with economic fundamentals. Point A’ depicts the
situation when the initial credit to GDP ratio is higher than what the level of
economic development would justify (initial overshooting). By contrast, point
A”shows a credit to GDP ratio, which is lower than what the level of economic
development of the given country would predict (initial undershooting). In those
cases, credit growth should di¤er from the equilibrium rate of growth, and this
would secure the return to the equilibrium level of credit to GDP ratio
5
.
Initial undershooting may be important for transition economies most of
which started economic transformation with levels of credit to GDP lower than
other countries at the same level of development would have in other parts of the
world. This is a heritage of central planning because of the underdevelopment of
the …nancial sector under the communist regime. Hence, once economic trans-
formation from central planning to market is completed, higher credit growth
in the transition economies may re‡ect partly the correction from this initial
undershooting to the equilibrium level of the credit to GDP ratio. This is shown
on Figure 2, where the move from A”to B can b e decomposed in (a) the equi-
librium credit growth, given by A” to B” and (b) the adjustment from initial
undershooting to equilibrium (from B”to B).
However, the iss ue is whether the obse rved change in the credit to GDP ratio
corresponds to the move f rom A”to B. In cases of high credit growth rates, one
might suspect that the increase in credit-to-GDP may be even higher than the
equilibrium change and the correction from initial undershooting would justify.
The move from A”to B’on Figure 2 indicates such an overshooting where the
excessive increase in credit-to-GDP is given by the distance between B and B’.
5
In both cases, credit growth is express ed in terms of GDP. For example, credit growth
([C(t)-C(t-1)]/C(t-1) is higher for countries with lower credit-to-GDP levels than fo r countries
with higher credit-to-GDP levels if both countries have similar credit-to-GDP ‡ows. Hence,
it is more a ppropr iate, as we do it in this study, to relate changes in credit to the GDP to
avoid this dist ortion (Arpa, Reininger and Walko, 2005).
5
3.2 . . . and the Consequences
If there is initial under- or overshooting at the beginning of the transition process
and if the adjustment towards equilibrium occurs gradually implying persis-
tent initial under- or overshooting, the use of pane ls including only transition
economies may lead to severely biased constant terms and coe¢ cient estimates,
as put forward in the context of equilibrium exchange rates by Maeso-Fernandez,
Osbath and Schnatz (2005). When regressing the observed credit-to-GDP ratio
moving from A” to B (ins tead of the equilibrium change from A to B) on a
set of fundame ntals, the s lope coe¢ cient would su¤er from an obvious upward
bias. By the same token, the con stant term will be lower than it would be in
the absence of an initial undershooting.
This is the reason why one would be well advised to use panels including
countries, which do not e xhibit an initial under- or overshooting in the credit-
to-GDP ratio, or to use out-of-sample panels for the analysis of the equilibrium
level of the credit-to-GDP ratio of transition economies.
Figure 2. The evolution of the credit to GDP ratio over time
Bank credit to the private sector (as % of GDP)
Fundamentals
A’’
A’
A
C
B
B’
Credit-to-GDP ratios
corresponding to the level of
economic development
Credit-to-GDP ratio lower
than what the level of
economic development
would predict
Credit-to-GDP ratio higher
than what the level of
economic development
would justify
B’’
6
4 Economic and Econometric Speci…cations
4.1 The Empirical Model
Most studies investigating credit growth employ a simple set of explanatory
variables (see Table 1), which usually includes GDP per capita or real GDP,
some kind of (real or nominal) interest rate and the in‡ation rate (Calza et al,
2001, 2003 and Brzoza-Brzez ina, 2005). Hofmann (2001) extends this list by
the inclusion of housing prices. This is very important because a rise in housing
prices is usually accompanied by an increase in credit to the private sector.
Cottarelli et al. (2005) u se indicators capturing factors driving the demand
for credit but they also consider a number of variables characterising the supply
of credit. Thes e variables describe the degree of …nancial liberalisation, the
quality and implementation of accounting stand ards, entry restrictions to the
banking sector and the origin of the legal system. Finally, they use a measure of
public debt aimed at analysing possible crowding-out (or crowding-in) e¤ects.
Table 1. Overview of papers analysing the determinants of credit growth
Paper
Dependent
variable
Explanatory variables
Calza et al. (2001)
Real loans
GDP per capita in PPS, short- and long-term real interest rates
Calza et al. (2003)
Real loans
Real GDP growth, nominal lending rate, inflation rate
Brzoza-Brzezina
(2005)
Real loans
Real GDP growth, real interest rate
Hofmann (2001)
Real loans
Real GDP, real interest rate, housing prices
Cottarelli et al. (2005)
Credit to the
private sector
(%GDP)
GDP per capita in PPS, inflation rate, financial liberalisation index,
accounting standards, entry restrictions to the banking sector, German origin
of the legal system, public debt
The economic speci…cation which we estimate for the private credit to GDP
ratio not only provides a unifying framework for the variables used in previous
studies but also extends on them. We consider the following variables capturing
both the demand for and the supply of credit of credit from and to the private
sector:
1.) GDP per capita in terms of PPS (CAP IT A). An increase in per
capita GDP is expected to result in an increase in credit to the private sector.
Alternatively, we also use real GDP (gdpr) and industrial production (ip) to
check for the robustness of the GDP per capita variable and to see to what extent
these variables which are used interchangeably in the literature are substitutes.
2.) Bank credit to the government sector in percentage of GDP (C
G
).
As this variable captures possible crowding-out e¤ects, any increase (decrease)
in bank credit to the government sector is thought to give rise to a decrease
(increase) in bank credit to the private sector. It should be noted that bank
credit to the government measures better crowding out as compared to public
debt employed in Cottarelli et al. (2005) because public debt also includes loans
taken from abroad and because public entities might well …nance themselves on
securitiy markets. Moreover, public debt is subjec t to valuation and stock-‡ow
adjustments.
7
3.) Short- and long-term nominal lending interest rates (i). Lower inter-
est rates should promote credit to the private sector implying a negative sign
for this variable. Calza et al. (2001) use both short-term and long-term interest
rates arguing that it d epends on the share of loans with …xed interest rates
and variable interest rates whether short-term or long-term interest rates play
a more important role. Because the nominal lending interest rates used in the
paper show a high correlation with short-term interest rate (three-month T-bill
and money market rates), short-term interest rates are u sed as a robustness
check rather than as an additional variable.
4.) In‡ation (p): high in‡ation is thought to be associated with a drop
in bank credit to the private sector. In‡ation is measured both in terms of PPI
and CPI.
5.) Housing prices (p
hou sin g
): increases in hou sing prices result in a rise
in the total amount which has to be spent on the purchases of a given resi-
dential or c ommercial property. This is subsequently re‡ected in an increase
in demand for credit through which the increased purchasing price can be fully
or partly …nanced. This means that an increase in housing prices may gener-
ate more credit to the private sector. However, a fundamental problem arising
here is whether or not price increases in the real estate market are driven by
fundamental factors or re‡ect a bubble. If price developments in the real es-
tate market mirror changes in fundamentals such as the quality of housing or
an adjustment to the underlying fundamentals, the ensuing rise in the stock of
credit can be viewed as an equilibrium phenomenon. In contrast, in the event
that high credit growth is due to the development of a housing price bubble, the
accompanying credit growth is a disequilibrium phenomenon from the point of
view of long-term credit stock.
6.) The degree of liberalisation of the …nancial sector, and in particular
that of the banking sector. A higher degree of …nancial liberalisation makes it
easier for banks to fund credit supply. Because the …nancial liberalisation in-
dexes (finlib) used in Abiad and Mody (2003) and Cottarelli et al. (2005) match
only partially with our country and time coverage, we use in addition two vari-
ants of the spread between lending and deposit rates (spread = i
lending
=i
deposit
and spread2 = i
lending
i
deposit
) capturing …nancial liberalisation. A decrease
in the spread indicates …nancial liberalisation and can also re‡ect more intensive
competition among banks and also between banks and other …nancial interme-
diaries.
7.) Public and private credit registries (reg). The existence of credit
registries diminishes problems related to asymmetric information and the prob-
ability of credit frauds. This in turn leads to an increase in the supply of bank
credit, all thing being equal.
Our baseline speci…cation includes per capita GDP, bank credit to the public
sector, nominal lending rates, in‡ation rates and …nancial liberalisation based
on the spread:
C
P
= f (
+
CAP IT A;
C
G
;
i
lending
;
p
P P I
;
spread) (1)
8
where C
P
is bank credit to the private sector expressed as a share of GDP.
The alternative variables are subsequently introduced one by one in the baseline
speci…cation, which yields 6 additional equations.
C
P
= f (
+
ip;
C
G
;
i
lending
;
p
P P I
;
spread) (2)
C
P
= f (
+
gdpr;
C
G
;
i
lending
;
p
P P I
;
spread) (3)
C
P
= f (
+
CAP IT A;
C
G
;
i
shortterm
;
p
P P I
;
spread) (4)
C
P
= f (
+
CAP IT A;
C
G
;
i
lending
;
p
CP I
;
spread) (5)
C
P
= f (
+
CAP IT A;
C
G
;
i
lending
;
p
P P I
;
spread2) (6)
C
P
= f (
+
CAP IT A;
C
G
;
i
lending
;
p
P P I
;
+
finlib) (7)
The sensitivity check to alternative speci…cation is then followed by the use
of the registry variable and by the inclusion of housing prices:
C
P
= f (
+
CAP IT A;
C
G
;
i
lending
;
p
P P I
;
spread;
+
reg) (8)
C
P
= f (
+
CAP IT A;
C
G
;
i
lending
;
p
P P I
;
spread;
+
p
hou sin g
) (9)
4.2 Data Sources
Our quarterly dataset covers 43 countries, which are grouped in three panels:
(a) developed OECD countries, (b) emerging markets from Asia and the Amer-
icas
6
, and (c) transition economies from Central and Eastern Europe. The
OECD panel is further split into two sub-panels: (i) small OECD countries (ex-
cluding transition economies that have joined the OECD)
7
and (ii) large OECD
countries
8
. The panel including 11 transition economies is also divided into
three presumably more homogeneous groups: (i) CEE-5: the Czech Republic
6
Argentina (ARG), Brazil (BR), Chile (CH), India (IND), Indonesia (INDO), I srael (IS),
Mexico (ME), Per u (PE), Philippines (PH), South Africa (SA), South Korea (KO), Thailand
(TH). Although South Korea and Mexico are OECD countries, they can be viewed as a
catching-up emerging market economies for most of the period inve stigate d in this paper.
7
Austria (AT), Australia (AUS), Belgium (BE), Denmark (DK), Netherlands (NE), Sweden
(SE), Canada (CA), Finland (F I) , Greece (GR), Ireland (IE), Norway (NO), Por tugal (PT),
Spain (ES), New Zealand (NZ).
8
Germany (DE), France (FR), Italy (IT), Japan (JP), United Kingdom (UK) and USA
9
(CZ), Hungary (HU), Poland (PL), Slovakia (SK) and Slovenia (SI); (ii) Baltic
3 (B-3): Estonia (EE), Latvia (LV) and Lithuania (LT) and (iii) South Eastern
Europe 3 (SEE-3): Bulgaria (BG), Croatia (HR) and Romania (RO).
The sample begins between 1975 and 1980 for the OECD countries, between
1980 and 1993 for the emerging market economies, and between 1990 an d 1996
for the transition economies and ends in 2004
9
. The dataset is unbalanced as
the length of the individual data series depend s largely on data availability. All
data are transformed into logs, except for spread2.
Data for bank credit to the private sector, credit to the government sector,
short-term and long-term interest rate series, the consumer and producer price
indices (CPI and PPI), real and nominal GDP, industrial production are ob-
tained from the International Financial Statistics of the IMF accesed via the
database of the Austrian Institute for Economic Research (WIFO)
10
. For some
emerging markets, industrial production data is not available from this source,
and hence are obtained from n ational data sources. In‡ation is computed as a
year-on-year rate (P
t
=P
t4
). Lending rates are based on bank lending rates, and
if not available, long-term government bond yields are used instead. 3-month
treasury bill rates, and if not available, money market rates are employed for
short-term interest rates. The spread is calculated using lending (or, if not
available, long-term government bond yields) and deposit rates.
GDP per capita expressed in Purchasing Power Standards (PPS) against
the euro and US dollar are drawn from the AMECO database of the European
Comission and the World Economic Indicators of the World Bank, respectively.
The data start in 1975 for OECD and emerging markets and in the 1990s for
transition economies. The …nancial liberalisation index (going from 0 to 20)
reported in Abiad and Mody (2003) and used in Cottarelli et al. (2005) is used
for OECD and emerging market economies. They cover the period from 1975
to 1996 and are available for all emerging countries and for 9 OECD economies,
namely the large OECD countries plus Canada, Australia and New Zealand. For
the transition economies, the average of the liberalisation index of the banking
sector and that of the …nancial sector provided by the EBRD from 1990 to 2004
are used (rescaled from 1 to 4+ to 0 to 20, which correspon ds to the scaling
used in Abiad and Mody, 2003). Data for the existence of public and private
credit registries are taken from Djankov et al. (2005). They provide data for
1999 and 2003. The series we use can take three values: 0 in the absence of both
public and private registry; 1 if either public or private credit registry op erates
and 2 if both exist. This variable captures basically whether a change between
1999 and 2003 alters the supply of credit during this period. GDP per capita,
the …nancial liberalisation index and the registry variable are transformed to
quarterly frequency by means of linear interpolation.
9
See appendix A for a detailed description of the time s pan for ea ch varia ble if not described
in this section.
10
Bank credit to the private sector: lines 22d and 22g; credit to the government: lin es 22a,
22b and 22c; interest rates: lines 60b,c,l,p and 61; CPI and PPI: lines 64 and 63; nominal
GDP: lines 99b and 99b.c; real GDP: lines 99bvp and 99bvr; indus tr ial production in indus tr y
: lines 66, 66 c and 66ey (in manufacturing).
10
Housing prices are not available for emerging countries and for Italy. For
transition economies, data could be obtained only for the Czech Republic, Es-
tonia, Hungary and Lithuania. The data for the OECD economies are obtained
from the Macroeconomic Database of the Bank for International Settlements
and Datastream. The sou rce of the data are the respective central banks for
the Cz ech Republic, France, Hungary and Lithuania and the national statistical
o¢ ce for Estonia.
4.3 Estimation Methods
As an introductory step, we un de rtake a simple cross-sectional analysis based on
OLS. This is followed by the panel data analysis. We proceed by …rst che cking
the order of integration of the series. As the series are found to be mostly
non-stationary in levels and stationary in …rst di¤erences, panel cointegration
is employed. Besides pooled and …xed e¤ect OLS (OLS and FE_OLS), the
coe¢ cients of the long-term relationships are derived on the basis of the mean
group of individual dynamic OLS estimates (DOLS) and by relying on the mean
group of individual estimates based on the error-correction speci…cation of the
ARDL process (MGE) proposed by Pesaran et al. (1999). The dynamic OLS
can be written for each member of the panel as follows:
Y
i:t
=
0
+
n
X
i=1
n
X
i;t
+
n
X
i=1
k
2
X
j=k
1
i;j
X
i;tj
+ "
t
(10)
with k1 and k2 denoting respectively leads and lags for panel member i. The
error correction form of the ARDL model is given for panel member i as shown
in equation (11) where the depen dent variable in …rst di¤erences is regressed on
the lagged values of the dependent and independent variables in levels and …rst
di¤erences:
Y
i;t
=
0
+(Y
i;t1
+
n
X
i=1
n
X
i;t1
)+
l
1
X
j=1
j
Y
i;tj
+
n
X
i=1
l
2
X
j=0
i;j
X
i;tj
+"
t
(11)
where l1 and l2 are the maximum lags. The error correction terms obtained
from the mean group estimators proposed by Pesaran et al. (1999) are used as
tests for cointegration. A negative and statistically signi…cant error correction
term is taken as evidence for the presence of cointegration.
5 Results
5.1 A Preliminary Look at Cross-Sectional Data
It seems a worthwhile endeavour to see whether the currently prevailing credit-
to-GDP levels in the transition economies analysed in this paper are in line with
11
observed GDP per capita …gures. This gives us a …rst idea on the presence of
initial under- or overshooting in the transition economies.
For this purpose, the credit-to-GDP ratio is regressed on relative GDP per
capita using three sets of cross-sectional data
11
. We …rst use the dataset of
Djankov et al. (2005), which contains data on bank credit to the private sector
in percentage of GDP (average for 1999 to 2003) and GDP per capita expressed
in current USD for 2003 for 127 countries. We then use our own dataset which
includes GDP per capita in PPS USD for 44 countries and GDP per capita in
PPS euro for 35 countries, using averages for the period 2002 to 2004.
For the large dataset covering 127 countries, several groups of countries
are built which exclude all or some of the transition economies. Also, non-
transition economies are grouped into low-, middle- and high-income countries.
Finally, cross-sectional regressions are run for all transition economies and then
separately for the CIS and for the CEE countries. Regarding our own dataset,
groups similar to those used for the panel data analysis are used: developed
OECD countries, emerging countries and transition countries.
The results displayed in Table 2 have several interesting features, which
turn out to be fairly robust across the three datasets. First, no signi…cant
cross-sectional relationship seems to emerge for developed OECD countries and
middle-income emerging market economies, irrespective of the dataset used.
Second, the relationship between the credit-to-GDP ratio and GDP per capita is
found to be very signi…cant both for non-transitional low-income countries and
transitional economies. The relationship is also statistically signi…cant when
all countries are pooled together. Finally, the coe¢ cient on GDP per capita
is higher for transition economies, in particular for countries of Central and
Eastern Europe, as compared to the rest of the countries.
11
GDP per capita is expresse d relative to German GDP per capita, and both GDP per
capita and credit-to-GDP ratios are expressed in logarithmic terms. The number of countrie s
is lower when GDP per capita in euro is used because those …gures are mostly not available
for emergi ng mark ets (only for OECD Members: Me xico and South Korea).
12
Table 2. Cross-sectional bivariate regressions (C
P
= f (CAP IT A))
CONSTANT
CAPITA
R2
SIC
AIC
OBS
GDP PER CAPITA IN USD (Djankov et al. (2005) dataset)
ALL
-0.069
0.505***
0.59
2.17
2.12
127
ALL (no-transition)
0.037
0.504***
0.62
2.14
2.09
105
ALL (no CEE country)
-0.001
0.516***
0.60
2.19
2.14
117
POOR (<1000 USD))
0.431
0.599***
0.16
2.41
2.33
46
MIDDLE (1000USD<X<10000USD)
-0.491
0.270
0.00
2.53
2.43
33
RICH (>10000 USD)
0.024
0.183
0.01
0.52
0.42
26
TRANISITION ALL
-0.291
0.629***
0.57
1.58
1.48
22
CIS
-0.402
0.586*
0.21
1.95
1.87
12
CEE
0.092
0.876***
0.52
1.24
1.18
10
GDP PER CAPITA IN USD, PPS (dataset of this paper)
ALL
-0.419*
0.572**
0.09
3.22
3.13
44
OECD+EMERGING
-0.371
0.504
0.05
3.50
3.41
33
EMERGING
-0.945
0.182
-0.09
2.26
2.19
11
OECD
-0.349
-0.451
-0.05
3.87
3.77
22
CEE11
-0.435
0.839**
0.29
1.00
0.93
11
GDP PER CAPITA IN EUR, PPS (dataset of this paper)
ALL
-0.387
0.917**
0.10
3.39
3.30
35
OECD+EMERGING
-0.378
0.898
0.01
3.81
3.71
24
OECD
-0.300
-0.274
-0.05
3.88
3.78
22
CEE11
-0.521
0.781*
0.24
1.07
1.00
11
Note: Middle income countries exclude transition economies. R2 is the adjusted R-squared,
SIC and AIC stand for the Schwarz and Akaike information criteriaand OBS shows
the number of observations used for the respectiveregression. .*,** and *** indicate
statistical signi…cance at the 10%, 5% and 1% signi…cance levels, respectively.
It is rather convenient to use the estimation results reported in Table 2
to derive the deviation of private credit-to-GDP ratios from their equilibrium
levels for the period from 1990 to 2004. In order to avoid the bias induced by
the process of transition, the results obtained for the large sample excluding all
transition economies (both CEE and CIS countries) are applied to compare the
observed and …tted values of the private credit to GDP ratio f or the transition
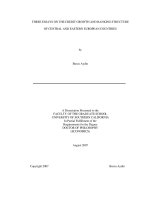
economies under study. As plotted in Figure 3, the private credit to GDP ratio
reached and even surpassed its equilibrium level in Estonia, Latvia and also
in Croatia by 2004, at least according to these cross-sectional estimations. In
Hungary, Slovenia and Lithuania, it started to adjust from an initial position
below equilibrium towards equilibrium even though equilibrium has not been
reached yet.
Bulgaria, the Czech Republic and Slovakia appear to have entered transi-
tion with private credit to GDP ratios above equilibrium, but these countries
also experienced a rapid undershooting during the mid-1990s. From these three
economies, only Bulgaria has recently come close to equilibrium, while the Czech
Republic and Slovakia remain fundamentally below equilibrium, at least accord-
ing to the cross-sectional estimations.
As already noted earlier, an initial under- or overshooting has severe conse-
quences for econometric estimations, if a steady but still longer-lasting adjust-
ment process takes place. This de…nitely seems to be the case in Estonia, Latvia
13
and Croatia and also perhaps in Hungary and Slovenia. On the other hand, ini-
tial undershooting might not be a serious problem for Lithuania, Poland and
Romania because the deviation from equilibrium remained pretty stable over the
time horizon considered. For Bulgaria, the Czech Republic and Slovakia, the
bias may be also less of a concern given that periods of over- and undershooting
roughly average each other out and thus n o permanent over- or undershooting
can be observed. This notwithstanding, given that all sub-panels (CEE-5, B-3
and SEE-3) contain countries displaying a possibly protracted period of un-
dershooting, the in-sample results should be interpreted with a high degree of
caution.
14
Figure 3. Deviations from equilibrium, cross-sectional estimates, 1990-2004
Baltic Countries
Estonia
-40%
-30%
-20%
-10%
0%
10%
20%
30%
40%
1991q4
1992q4
1993q4
1994q4
1995q4
1996q4
1997q4
1998q4
1999q4
2000q4
2001q4
2002q4
2003q4
2004q4
Latvia
-40%
-30%
-20%
-10%
0%
10%
20%
30%
40%
1991q4
1992q4
1993q4
1994q4
1995q4
1996q4
1997q4
1998q4
1999q4
2000q4
2001q4
2002q4
2003q4
2004q4
Lithuania
-40%
-30%
-20%
-10%
0%
10%
20%
30%
40%
1991q4
1992q4
1993q4
1994q4
1995q4
1996q4
1997q4
1998q4
1999q4
2000q4
2001q4
2002q4
2003q4
2004q4
Central and Eastern Europe - 5
Czech Republic
-40%
-30%
-20%
-10%
0%
10%
20%
30%
40%
1991q4
1992q4
1993q4
1994q4
1995q4
1996q4
1997q4
1998q4
1999q4
2000q4
2001q4
2002q4
2003q4
2004q4
Hungary
-40%
-30%
-20%
-10%
0%
10%
20%
30%
40%
1991q4
1992q4
1993q4
1994q4
1995q4
1996q4
1997q4
1998q4
1999q4
2000q4
2001q4
2002q4
2003q4
2004q4
Poland
-40%
-30%
-20%
-10%
0%
10%
20%
30%
40%
1991q4
1992q4
1993q4
1994q4
1995q4
1996q4
1997q4
1998q4
1999q4
2000q4
2001q4
2002q4
2003q4
2004q4
Slovakia
-40%
-30%
-20%
-10%
0%
10%
20%
30%
40%
1991q4
1992q4
1993q4
1994q4
1995q4
1996q4
1997q4
1998q4
1999q4
2000q4
2001q4
2002q4
2003q4
2004q4
Slovenia
-40%
-30%
-20%
-10%
0%
10%
20%
30%
40%
1991q4
1992q4
1993q4
1994q4
1995q4
1996q4
1997q4
1998q4
1999q4
2000q4
2001q4
2002q4
2003q4
2004q4
South Eastern Europe
Bulgaria
-40%
-30%
-20%
-10%
0%
10%
20%
30%
40%
50%
1991q4
1992q4
1993q4
1994q4
1995q4
1996q4
1997q4
1998q4
1999q4
2000q4
2001q4
2002q4
2003q4
2004q4
Croatia
-40%
-30%
-20%
-10%
0%
10%
20%
30%
40%
1991q4
1992q4
1993q4
1994q4
1995q4
1996q4
1997q4
1998q4
1999q4
2000q4
2001q4
2002q4
2003q4
2004q4
Romania
-40%
-30%
-20%
-10%
0%
10%
20%
30%
40%
1991q4
1992q4
1993q4
1994q4
1995q4
1996q4
1997q4
1998q4
1999q4
2000q4
2001q4
2002q4
2003q4
2004q4
Note: negative val ues indicate that the observed private credit to GDP ratio is lower
than what a particular country’s GDP per capita would predict (“undershooting”). Conversely,
positive …gures show an “overshooting” of the private credit to GDP ratio. Figures refer to
di¤erences i n percentage points (e.g. 0.5=50%)
5.2 Panel Data Analysis
When it comes to analysing possible long-term relationships between the private
credit to GDP ratio on the one han d and the explanatory variables on the other,
one …rst has to ascertain that the variables are cointegrated. As explained
earlier, the error correction terms issued from the e stimated error correction
form of the MGE are used for this purpose. The variables are connected via a
15
cointegrating vector in the event that the error correction term is statistically
signi…c ant and has a negative sign. According to results shown in Table 3
below, most of the error correction terms ful…l this double criterion. A notable
exception is the panel composed of the three Baltic states as there seems to be
only one cointegration relationship out of the eight tested equations. For the
panel c omprising countries from South Eastern Europe, no cointegration could
be established for Equation 6.
Table 3 Cointegration –Error Correction Terms, Eq1 to Eq8
Large OECD
Small OECD
Emerging
CEE11
CEE5
B3
SEE3
Eq1
-0.094***
-0.063***
-0.132***
-0.281***
-0.225***
-0.103
-0.551***
Eq2
-0.088***
-0.052***
-0.135***
-0.174***
-0.188***
-0.052
-0.273***
Eq3
-0.092***
-0.055***
-0.202***
-0.188***
-0.183***
-0.135**
-0.248***
Eq4
-0.097***
-0.069***
-0.189***
-0.226***
-0.136***
-0.049
-0.553***
Eq5
-0.097***
-0.057***
-0.215***
-0.198***
-0.207***
-0.066
-0.315***
Eq6
-0.106***
-0.060***
-0.098***
-0.128***
-0.268***
-0.036
-0.013
Eq7
-0.160***
-0.049**
-0.211***
-0.233***
-0.269***
-0.120
-0.285**
Eq8
-0.98***
-0.003**
-0.134***
-0.227***
-0.231***
-0.033
-0.414**
Note: *, ** and *** indicate statistical signi…cance at the 10%, 5% and 1% signi…cance levels,
respectively.
We can now turn to the coe¢ cient estimates, displayed in Table 4 and in the
Appendix. GDP per capita enters the long-run relationship with the expected
positive sign for the OECD and the emerging markets panels. This result is
particularly robust for small OECD and emerging market economies with the
size of the coe¢ cient lying usually somewhere between 0.4 and 1.0 for most of
the alternative speci…cations. However, less robustness can be revealed for the
transition countries. This holds especially true for the CEE-5, for which GDP
per capita turns out to be insigni…c ant both in the baseline and in alternative
speci…cations. Although cointegration could not be …rmly established for the
Baltic countries, it is worth mentioning that GDP per capita is usually statis-
tically signi…cant f or th is group as well as for the SEE-3. The fact that the
coe¢ cients’size largely exceeds unity re‡ects the upward bias due to quick ad-
justment towards equilibrium. The results furthermore indicate that the bias is
substantially larger for the Baltic countries than for the SEE-3.
With regard to credit to the public sector, the estimations provide us with
some interesting insights as an increase (decrease) in the credit to the pu blic sec-
tor is found to cause a decline (rise) in private credit. This result is very robust
for emerging market economies and for the CEE-5 as the coe¢ cient estimates
are almost always negative and statistically signi…cant across di¤erent speci…ca-
tions. This lends support to the crowding-out/-in hypothesis in these countries.
Some empirical support for this can be also established for the advanced OECD
and for emerging market economies. By contrast, the estimated coe¢ cients are
either not signi…cant or have a positive sign for the Baltic countries and for the
SEE-3. This …nding might mirror in particular the very low public indebtedness
of the three Baltic countries.
16
Let us now take a closer look at the nominal interest rate and at the in‡ation
rate. In accordance with the results shown in Table 4 and in the Appendix,
there is reas onably robust empirical support for nominal lending rates being
negatively linked to private credit in the CEE-5, and also in emerging markets
and small OECD countries. In contrast, the …nding for the Baltic states and the
SEE-3 is that interest rates mostly have a positive sign, if they turn out to be
statistically signi…cant. Note that these results are not really a¤ected whether
or not lending rates or short-term interest rates are employed.
For emerging economies from Asia and the Ame ricas, particularly strong
negative relationships are detected between the rate of in‡ation and private
credit. Although less stable across di¤erent speci…cations and estimation meth-
ods, this negative relationship between in‡ation and credit is also supported by
the data for the CEE-5 and for small OECD e conomies . By contrast, no sys-
tematic pattern could be revealed for the Baltic and South Eastern European
countries.
An increase in …nancial liberalisation, measured by (a decline in) spread and
spread2, have the expected positive impact on private credit in small OECD
economies and in the CEE-5 and also to some extent in the other transition
economies. Although the …nancial liberalisation index is positively associated
with private credit in OECD and emerging economies, it has an unexpected
negative sign for all transition economies. An explanation for this may be due
to the delay with which …nancial liberalisation measured by this index is trans-
mitted to private credit, whereas the spread variable captures the e¤ective result
of …nancial lib eralisation. The same mismatch between OECD and transition
economies can be seen for private and public credit registries. While changes in
credit registries produce the expected e¤ect on private credit in OECD countries,
the estimation results show the opposite happening in the transition economies.
17
Table 4. Estimation Results –Baseline Speci…cation
C
P
= f (
+
CAP IT A;
C
G
;
i
lending
;
p
P P I
;
spread)
CAPITA
G
C
lending
i
PPI
p
spread
Large OECD
OLS
2.602***
-0.290***
2.986***
5.637***
-0.672***
FE_OLS
0.422***
-0.198***
-0.028
-0.394*
-0.050***
DOLS
0.391***
-0.034***
0.120***
0.241
0.171***
MGE
0.040
0.118
-0.016
-2.611**
0.207*
Small OECD
OLS
0.256***
-0.007
-0.173***
-2.160***
-0.102***
FE_OLS
0.480***
-0.170***
-0.068***
-0.178
-0.037***
DOLS
0.540***
-0.065***
-0.082
0.678***
-0.143***
MGE
0.643***
0.057
-0.171
-1.272
0.281
Emerging
OLS
0.362***
-0.212***
0.086***
-0.212**
0.163***
FE_OLS
0.492***
-0.120***
0.136***
-0.263***
0.069**
DOLS
0.715***
-0.064***
0.187***
-0.436***
-0.001
MGE
0.583***
-0.386***
0.454
-0.492***
-1.172
CEE11
OLS
0.906***
0.222***
-0.019
0.120
0.002
FE_OLS
1.648***
0.053**
0.297***
-0.046
-0.640***
DOLS
0.981***
-0.169***
0.125
-0.105
-0.382***
MGE
2.043
-0.114
-0.027***
-0.263
-0.907**
CEE5
OLS
0.052
-0.346***
-0.225***
-1.235***
-0.028
FE_OLS
0.169
-0.276***
-0.031
-1.179***
-0.407***
DOLS
0.375***
-0.308***
-0.046
1.062***
-0.109*
MGE
-1.076
-0.222***
-0.057***
1.501
-0.985**
B3
OLS
1.926***
-0.055
0.136
0.507
-0.505***
FE_OLS
2.554***
0.024
0.369***
0.396*
-0.458***
DOLS
2.227***
-0.121
0.083**
-1.676***
-0.481***
MGE
4.045
0.313
-0.124***
-2.852
-1.466
SEE
OLS
1.356***
0.775***
-0.002
-0.057
0.076
FE_OLS
2.049***
0.455***
0.218***
-0.102**
-0.366***
DOLS
0.745***
0.013
-0.298
-0.479
-0.737***
MGE
1.654***
0.264
0.120
-0.616**
0.217
Note: *, ** and *** indicate statistical signi…cance at the 10%, 5% and 1%
signi…cance levels, respectively.
Because data on housing prices are available only for developed OECD coun-
tries and for four transition economies (Czech Republic, Estonia, Hungary and
Lithuania), the estimations are performed only for large and small OECD and
transition economies. In addition, we constructed a panel including those coun-
tries exhibiting large and persistent increases in housing prices over the late
1990s possibly indicating the build-up of a real estate bubble (Canada, Spain,
France, United Kingdom and the US). Th e results are not particularly robust for
the small and large OECD economies as the coe¢ cient on housing prices changes
sign across di¤erent estimation methods. For transition economies, even thou gh
the results are somewhat more encouraging as the coe¢ cient is always positively
signed if it is found statistically signi…cant, the estimated equations seem to be
rather fragile in general.
Now, if we look at the group of countries with large increases in housing
prices, it turns out that housing prices are positively correlated in a robust
fashion with private credit, and that the other coe¢ cient estimates are also in
line with our earlier …ndings. However, the fact that the inclusion of housing
18
prices yields robust results only if large increases to ok place on the property
markets might suggest that housing prices mostly matter for private credit in
the event of possible housing market bubbles.
Table 5. Estimation Results –Equation 9; Housing prices
ECT
CAPITA
G
C
lending
i
PPI
p
spread
ghou
p
sin
Small OECD
OLS
-0.123***
0.003
-0.323***
-0.655**
-0.143***
0.482***
FE_OLS
0.611***
-0.166***
-0.098***
-0.125
-0.010
-0.062**
DOLS
0.286***
-0.064
-0.043
0.086
-0.081
0.399***
MGE
-0.207***
0.033
0.203***
-0.277**
-0.548
-0.080
0.587***
Large OECD
OLS
3.964***
-0.536***
3.612***
3.942*
-0.461**
-2.046***
FE_OLS
0.078*
-0.209***
-0.022
-0.855***
0.007
0.290***
DOLS
0.395***
-0.079***
-0.041*
-0.345
-0.040
-0.161**
MGE
-0.181***
-0.360
-0.049
-0.097*
-2.397***
0.139
0.544**
OECD with high
OLS
-0.842***
0.000
-0.113***
-2.081***
0.060
1.269***
growth in housing
FE_OLS
0.111*
-0.160***
-0.066**
-0.787***
-0.025
0.336***
prices
DOLS
0.334***
-0.171***
-0.043**
-0.412
0.022
0.040*
MGE
-0.176***
-0.838
-0.146***
-0.235**
-2.404**
0.432*
0.745**
CEE-4
OLS
2.064***
-0.374***
0.472***
-0.528
-0.223***
0.019
FE_OLS
0.316
-0.429***
0.032
-0.603***
-0.096
0.541***
DOLS
0.010***
-0.042***
0.050
-0.563**
0.002
-0.018
MGE
-0.125***
-0.651
-0.136***
-0.599***
0.080
-0.359
0.561**
Note: ECT is the error correction term. *, ** and *** indicate statistical signi…cance at the
10%, 5% and 1% signi…cance levels, respectively.
5.3 How Close to Equilibrium?
We can now proceed with the calculation of the …tted values from the panel
estimations for the transition economies. This exercise makes it possible to see
how far the obse rved private credit to GDP ratio from the estimated long-term
values is. We have shown earlier (Figure 3) that most of the transition economies
had a large initial undershooting followed by a steady adjustment towards equi-
librium. This preliminary …nding cautions against the use of in-sample panel
estimates as both the estimated long-run coe¢ cients and the constant terms are
possibly biased because of the steady adjustment towards equilibrium. But it
is not only the upward bias, which p revents us from relying on the in-sample
panel estimations. As can be seen in Tables 4 and 5 and in Appendix B, there
is no single equation for transition economies with all co e ¢ cients being statis-
tically signi…cant and having the expected sign. Because the same applies to
the emerging markets panel, we derive the estimated equilibrium private credit
to GDP ratios from the OECD panels. In particular, the baseline speci…cation
estimated by means of …xed e¤ect OLS appears to be best suited as all coe¢ -
cients bear the right sign and all but one are statistically signi…cant (marked in
blue in Table 4).
When engaging in an out-of-sample exercise, the underlying assumption is
that in the long run there is parameter homogeneity between the small developed
OECD panel and the transition countries. One might reasonably assume that
in the long run (after adjustment towards equilibrium is completed) transition
19
economies will behave similarly as small OECD countries behave presently. Even
though this homogeneity is ful…lled between the two samples, the estimated
long-run values of the private credit-to-GDP ratio and the underlying deviation
from equilibrium should be interpreted from a long-run persp ective.
Given that no country-speci…c constant terms are available for the transition
economies, the next intricate issue is how constant terms should be applied for
the derivation of the …tted values
12
. Our safest bet is to use the largest and the
smallest constant terms (as well as the median constant term) obtained on the
basis of the small OECD panel, which gives us the whole spectrum of possible
estimated values for private credit
13
.
The derived range of deviation is plotted on Figure 3. The dynamics of
the results is fairly similar to that obtained using cross-sectional estimates.
However, the error margin is rather large. Consequently, if one considers mid-
points, Croatia is now the only country which might have reached equilibrium
by 2004. When looking at whole ranges, other countries, namely Bulgaria,
Estonia, Hungary, Latvia and Slovenia, might have already reached equilibrium
as well, while the mass of the estimated deviation is still located mostly on the
undershooting side in 2004. At the same time, the upper edges of the estimated
band come close to equilibrium for Hungary, Bulgaria, Poland and Slovenia.
Moreover, it turns out that the initial overshooting might not have be en that
large for the Czech Republic and Slovakia, after all. Finally, it is interesting
to see that the initial undershooting remains relatively stable for Lithuania and
Romania, and also perhaps for Poland throughout the period. throughout the
period.
12
No te t hat Cottarelli e t al (2005), the only paper which derives the equilibrium level of
private credit for transiti on econo mies does not address the is sue of the c ons tant terms.
13
Another r eason for selecting the baseline speci…cation is that the va riables included are all
expressed in levels, which secures that the cons tant terms derived on this basis h a ve a cross-
sectional meaning. For instance, the constants would not h a ve any cross-sectional meaning
when indices with a base year would be used ( such as for industrial production or h ousing
prices).
20
Figure 4. Deviations from equilibrium based on panel estimates, 1990-2004
Baltic Countries
Estonia
-100%
-80%
-60%
-40%
-20%
0%
20%
40%
60%
80%
100%
1991q1
1992q2
1993q3
1994q4
1996q1
1997q2
1998q3
1999q4
2001q1
2002q2
2003q3
2004q4
Latvia
-100%
-80%
-60%
-40%
-20%
0%
20%
40%
60%
80%
100%
1991q1
1992q2
1993q3
1994q4
1996q1
1997q2
1998q3
1999q4
2001q1
2002q2
2003q3
2004q4
Lithuania
-100%
-80%
-60%
-40%
-20%
0%
20%
40%
60%
80%
100%
1991q1
1992q2
1993q3
1994q4
1996q1
1997q2
1998q3
1999q4
2001q1
2002q2
2003q3
2004q4
Central and Eastern Europe - 5
Czech Republic
-100%
-80%
-60%
-40%
-20%
0%
20%
40%
60%
80%
100%
1991q1
1992q2
1993q3
1994q4
1996q1
1997q2
1998q3
1999q4
2001q1
2002q2
2003q3
2004q4
Hungary
-100%
-80%
-60%
-40%
-20%
0%
20%
40%
60%
80%
100%
1991q1
1992q2
1993q3
1994q4
1996q1
1997q2
1998q3
1999q4
2001q1
2002q2
2003q3
2004q4
Poland
-100%
-80%
-60%
-40%
-20%
0%
20%
40%
60%
80%
100%
1991q1
1992q2
1993q3
1994q4
1996q1
1997q2
1998q3
1999q4
2001q1
2002q2
2003q3
2004q4
Slovakia
-100%
-80%
-60%
-40%
-20%
0%
20%
40%
60%
80%
100%
1991q1
1992q2
1993q3
1994q4
1996q1
1997q2
1998q3
1999q4
2001q1
2002q2
2003q3
2004q4
Slovenia
-100%
-80%
-60%
-40%
-20%
0%
20%
40%
60%
80%
100%
1991q1
1992q2
1993q3
1994q4
1996q1
1997q2
1998q3
1999q4
2001q1
2002q2
2003q3
2004q4
South Eastern Europe
Bulgaria
-100%
-80%
-60%
-40%
-20%
0%
20%
40%
60%
80%
100%
1991q1
1992q2
1993q3
1994q4
1996q1
1997q2
1998q3
1999q4
2001q1
2002q2
2003q3
2004q4
Croatia
-100%
-80%
-60%
-40%
-20%
0%
20%
40%
60%
80%
100%
1991q1
1992q2
1993q3
1994q4
1996q1
1997q2
1998q3
1999q4
2001q1
2002q2
2003q3
2004q4
Romania
-100%
-80%
-60%
-40%
-20%
0%
20%
40%
60%
80%
100%
1991q1
1992q2
1993q3
1994q4
1996q1
1997q2
1998q3
1999q4
2001q1
2002q2
2003q3
2004q4
Note: negative val ues indicate that the observed private credit to GDP ratio is lower than
what a particular country’s GDP per capita would predict (“undervaluation”).
Conversely, positive …gures show an “overvaluation” of the private credit to GDP ratio.
6 Conclusion
In this paper, we have analysed the equilibrium level of private credit to GDP
in 11 transition economies from Central and Eastern Europe on the basis of
a number of dynamic panels containing quarterly data for developed OECD
economies, emerging markets and transition economies and relying on a unifying
framework including both factors capturing the demand for and the supply of
private credit.
21
We have emphasised that relying on in-sample panel estimates for transition
economies is problematic not only because of the possible bias, which shows up
in the estimated constants and slope coe¢ cients due to the initial undershooting
and the ensuing steady adjustment towards equilibrium, but also because the
equations estimated for transition economies are not su¢ ciently stable. Credit
to the public sector (crowding out/in), nominal interest rates, the in‡ation rate
and the spread between lending and deposit rates aimed at capturing …nancial
liberalisation and competition in the banking sector turn out to be the major
determinants of credit growth in the CEE-5, while GDP per capita is the only
variable entering the estimated equations in a robust manner for the Baltic
and South Eastern European countries. The estimated coe¢ cients are much
higher than those obtained for OECD and emerging market economies which
testi…e s the bias caused by th e initial undershooting of private credit to GDP
(in most countries) and the subsequent adjustment towards equilibrium in those
countries. Housing prices are found to lead to an increase in private credit only in
countries with high housing price in‡ation. Th is …nding disquali…es this variable
from being included in the long-run equation to be used for the derivation of
the equilibrium level of private credit.
Our intention to use the emerging markets panel is thwarted by the lack
of robustness of the empirical results for emerging economies. This is why we
primarily rely on the small OECD panel in the further analysis. The application
of this out-of-sample panel to transition economies provides us with a wide
corridor of deviations from equilibrium. Overall, while some countries such
as Lithuania and Romania have private credit to GDP ratios, which are well
below the level that would be justi…ed by fundamentals, others have already
come close to equilibrium by 2004. Although the estimated band is mostly
on the undershooting side, the rapid adjustment that is observed in Croatia,
Estonia, Latvia and possibly Bulgaria might surpass equilibrium and lead to
the emergence of (over)shooting instances in the near future.
It has been argued that credit growth will very likely remain fast in Cen-
tral and Eastern Europe or accelerate further in those countries where it is still
comparatively mode rate, given that the underlying factors which support pri-
vate sector credit dynamics will remain at work for some time to come. As
experience shows, the rapid pace of credit expansion and its persistence in a
number of countries does by itself pose risks of a deterioration of asset quality.
Moreover, it exposes lenders and borrowers to risks because of an increase in
unhedged foreign currency lending. Furthermore, the rapid adjustment process
toward equilibrium levels may trigger demand booms causing current account
de…cits moving above levels that can be sustained over a longer perio d of time.
However, we leave it to future research to determine empirically the optimal
speed of adjustment toward equilibrium that would not jeopardize macroeco-
nomic and …nancial stability.
22
7 References
Abiad, A. and A. Mody (2003): Financial reform: What shakes it? What shapes it?
IMF Working Paper No. 70.
Arpa M., T. Reininger and Z. Walko (2005): Can bank ing intermediation in the
Central and Eastern European countries ever catch-up with the euro area? Oesterre-
ichische Nationalbank, Focus on Europea n Economic Integration No. 2.
Backé, P. and T. Zumer (2005): Developments in Credit to the Private Sector in
Central and Eastern European EU Member States: Emerging from Financial Repres-
sion — A Comparative Overview. Oesterreichische Nationalbank, Fo cus on Europe an
Economic Integration No. 2.
Barisitz, S. (2005) : Banking in Central and Eastern Europe since the Turn of the
Millennium — An Overview of Str uctural Modernization in Ten Countries. Oesterre-
ichische Nationalbank, Focus on Europea n Economic Integration No. 2.
Brzoza-Brze zina, M. (2005): Lending booms in Europe’s periphery: South-Western
lessons for Central-Eastern members, ECB Working Paper No. 543.
Calza , A., C. Gartner and J. Sousa (2001): Modelling the demand for loans to the
private sector in the euro area, ECB Working Paper No. 55.
Calza , A., M. Manrique and J. Sousa (2003): Aggregate loans to the euro area
private sector, ECB Working Paper No. 202.
Cottarelli, C., G. Dell’Aricc ia and I. Vladkova-Hollar (2005): Early birds, late
risers and sleeping beau ties: B ank credit growth to the private sector in Central and
Easte rn Europe and in the Balkans, Journal of Banking and F inance, 29, 8 3-104.
Djankov, S., C. McLiesh and A. Schleifer (2005): Private credit in 129 countries,
NBER Working Paper No. 11078.
European Central Bank (2005): Banking structures in the new EU Member States,
Frank furt am Main. January.
European Bank for R econstruction and Develo pment (2004): Transition Report,
London.
Hofmann, B. (2001): The de terminants of private sector credit in industrialise d
countries: Do pr operty prices matter? BIS Working Paper No. 108.
Kiss G. and G. Vadas (2005): The role of th e housing market in monetary tran s-
mission. Nat ional Bank of Hung ary Background Study No. 3.Maeso-Ferna ndez, F.,
C. Osbat and B. Schna tz (2005): Pitfalls in estimating equi librium exchange rates for
transition economies, Economic Systems, 29(2), 130-143
Pesaran , M.H., Shin, Y. and R. Smith (1999): Pooled mean group est imation of
dynamic heterogeneous panels. Journal of the American Statistical A ssociation, 94,
62 1-634.
23
8 Appendix
8.1 Data Description
Starting dates (the series end in 2004:q4 if not indicated otherwise)
Private credit (the same applies to public credit if not indicated other-
wise in parentheses):
OECD: 1975:q1- 2004:q4;
Emerging markets: 1975:q1- 2004:q4 excep t for ARG: 1982:q3 (1983:q3);
BR: 1988:q3 (1989:q3); INDO: 1980:q3; PE: 1984:q1 (1985:q1); TK: 1990:q1
(1987:q4)
Transition economies: HU, PL: 1990:Q4; BG, EE, SI: 1991:q4; LT: 1993:q1;
LV: 1993:q3; CZ, SK: 1993:q4; HR: 1993:q4 (1994:q2); EE: 1991; RO: 1996:q4.
Spread (in parentheses for spread2 if di¤erent):
OECD: 1975:q1 except for DE: 1977:q3; NO: 1979:q1; IE:1979:q3; FI, NE:
1981:q1; NZ: 1981:q4; ES: 1982:q1; IT: 1982:q3
Emerging markets: INDO, KO, PH: 1975:q1; CH, TH: 1977:q1; SA: 1977:q4;
IND, ME: 1978:q1; IS: 1983:q1; PE: 1988:q1; ARG: 1993:q2; BR: 1997:q1; TK:
not available
Transition economies: HU, PL: 1990:q1; BG: 1991:q1; SI: 1991:q4; HR:
1992:q1; CZ, LT, SK: 1993:q1; EE: 1993:q2; LV: 1993:q3; RO: 1995:q4.
PPI (CPI, industrial production (IP), if di¤erent):
OECD: 1975:q1 except for PPI in NO, NZ: 1977:q1; BE: 1980:q1; IT: 1981:q1
Emerging markets: 1975:q1 except for ARG: 1987:q1 (1994:q1; NA); BR:
1992:q1 (1992:q1, 1991:q1); CH: 1976:q1 (1976:q1, 1975:q1); INDO: IP:1976:q1;
IS: IP not available; KO: IP: 1980:q1; PE: 1980:q1 (1980:q1, 1979:q1); PH:
1993:q1 (1975:q1, 1981:q1); TK: 1987:q1 (1987:q1, 1980:q1)
Transition economies: BG: 1991:q1; CZ: 1993:q1; HR: 1993:q1; EE: 1993:q1
(1992:q1, 1993:q1); HU: 1990:q1; LV: 1994: q1 (1992:q1,1993:q1); LT: 1993:q1;
PL: 1991:q1; RO: 1992:q1; SK: 1991:q1 (1993:q1, 1990:q1); SI: 1992:q1.
Real GDP:
OECD: 1975:q1 except for BE: 1980:q1; DK, PT: 1977:q1 and NZ: 1982: q2
Emerging markets: IND, IS, KO: 1975:q1; CH, ME: 1980:q1; PE: 1979:q1;
PH: 1981:q1; TK: 1987:q1; BR: 1990:q1; ARG, INDO, TH: 1993:q1
Transition economies: SI: 1992:q1; HR, EE, LV, LT, RO, SK: 1993:q1; CZ:
1994:q1, HU, PL: 1995:q1; Data for India and Romania are linearly interpolated
from annual to quarterly frequency.
All series stop in 2004:q4.
GDP per capita in PPS:
Data based on the euro for transition economies: CZ, PL, RO: 1990; BG,
HU, SI: 1991; LV, LT: 1992; EE, SK: 1993; HR: 1995
Data based on the USD for transition economies: HR, HU, PL, RO: 1990;
BG, EE, LV, LT, SK, SI: 1991; CZ: 1992.
Housing prices:
OECD: The starting date of the series is as follows: DK, DE, NE, SUI,
UK, US: 1975:q1; JP: 1977:q1; SA: 1980:q1; FR: 1980:q4; CA: 1981:q1; FI:
24
1983:q1; SE: 1986:q1; AUS: 1986:q2; ES: 1987:q1, AT: 1987:q2; PT: 1988:q1;
NZ: 1989:q4; IE: 1990:q1; BE, NO: 1991:q4; GR: 1994:q1. The series stop in
2004:q4.
Transition economies: CZ: 1999:q1-2004:q4; EE: 1994:q2-2004:q4; HU: 1991:q1-
2004:q4; LT: 2000:q1-2004:q4
25