Báo cáo khoa học: Restriction point control of the mammalian cell cycle via the cyclin E/Cdk2:p27 complex doc
Bạn đang xem bản rút gọn của tài liệu. Xem và tải ngay bản đầy đủ của tài liệu tại đây (2.3 MB, 11 trang )
Restriction point control of the mammalian cell cycle
via the cyclin E/Cdk2:p27 complex
Riaan Conradie
1
, Frank J. Bruggeman
2
, Andrea Ciliberto
3
, Attila Csika
´
sz-Nagy
4
, Bela Nova
´
k
5
,
Hans V. Westerhoff
2,6
and Jacky L. Snoep
1,2,6
1 Triple J Group for Molecular Cell Physiology, Department of Biochemistry, Stellenbosch University, Matieland, South Africa
2 Molecular Cell Physiology & Netherlands Institute for Systems Biology, Vrije Universiteit, Amsterdam, The Netherlands
3 FIRC Institute of Molecular Oncology Foundation, Milan, Italy
4 University of Trento Centre for Computational and Systems Biology, Povo (Trento), Italy
5 Oxford Centre for Integrative Systems Biology, University of Oxford, UK
6 Manchester Centre for Integrative Systems Biology, Manchester Interdisciplinary Biocentre, The University of Manchester, UK
Keywords
cell cycle; kinetic modeling; metabolic
control analysis; restriction point; systems
biology
Correspondence
J. L. Snoep, Triple J Group for Molecular
Cell Physiology, Department of
Biochemistry, Stellenbosch University,
Private Bag X1, Matieland 7602,
South Africa
Fax: +272 1808 5863
Tel: +272 1808 5844
E-mail:
Note
The mathematical model described here has
been submitted to the JWS Online Cellular
Systems Modelling Database and can be
accessed at />database/conradie/index.html free of charge
(Received 14 May 2009, revised 21 October
2009, accepted 30 October 2009)
doi:10.1111/j.1742-4658.2009.07473.x
Numerous top-down kinetic models have been constructed to describe the
cell cycle. These models have typically been constructed, validated and ana-
lyzed using model species (molecular intermediates and proteins) and phe-
notypic observations, and therefore do not focus on the individual model
processes (reaction steps). We have developed a method to: (a) quantify the
importance of each of the reaction steps in a kinetic model for the position-
ing of a switch point [i.e. the restriction point (RP)]; (b) relate this control
of reaction steps to their effects on molecular species, using sensitivity and
co-control analysis; and thereby (c) go beyond a correlation towards a cau-
sal relationship between molecular species and effects. The method is gen-
eric and can be applied to responses of any type, but is most useful for the
analysis of dynamic and emergent responses such as switch points in the
cell cycle. The strength of the analysis is illustrated for an existing mamma-
lian cell cycle model focusing on the RP [Novak B, Tyson J (2004) J Theor
Biol 230, 563–579]. The reactions in the model with the highest RP control
were those involved in: (a) the interplay between retinoblastoma protein
and E2F transcription factor; (b) those synthesizing the delayed response
genes and cyclin D/Cdk4 in response to growth signals; (c) the E2F-depen-
dent cyclin E/Cdk2 synthesis reaction; as well as (d) p27 formation reac-
tions. Nine of the 23 intermediates were shown to have a good correlation
between their concentration control and RP control. Sensitivity and
co-control analysis indicated that the strongest control of the RP is medi-
ated via the cyclin E/Cdk2:p27 complex concentration. Any perturbation
of the RP could be related to a change in the concentration of this
complex; apparent effects of other molecular species were indirect and
always worked through cyclin E/Cdk2:p27, indicating a causal relationship
between this complex and the positioning of the RP.
Abbreviations
DRG, delayed response genes; ERG, early response genes; MCA, metabolic control analysis; Rb, retinoblastoma protein; RP, restriction
point.
FEBS Journal 277 (2010) 357–367 ª 2009 The Authors Journal compilation ª 2009 FEBS 357
Introduction
Arthur Pardee [1] defined the restriction point (RP)
as the apparent switch point in the late G1-phase,
beyond which normal cells would only progress when
supplied with a sufficient, mitogen containing culture
medium. Once the cell has transgressed the RP, the
necessity of a mitogen (i.e. growth factor) containing
medium is relieved and cells commit to replicate their
DNA (S-phase) and complete the remainder of the
division cycle autonomously [2,3]. Cells in the G1-
phase that have not yet passed RP, monitor their
environment and own size to determine whether they
are ready to commit to S-phase entry and division
cycle completion or, in contrast, enter the resting
G0-phase [2], where most non-cancerous somatic
mammalian cells spend their lifetime. Disregulation of
the RP has been linked to several disease states, most
notoriously cancer [1,4], and quantification of the
contribution of the different reaction steps in the cell
cycle to the control of the RP would be important
for drug target identification studies and for under-
standing the action mechanism of existing, RP affect-
ing drugs.
Abrupt cell cycle transitions (e.g. G1/S) are proper-
ties of the complete underlying control system, which
can be described without the need to introduce hypo-
thetical regulatory proteins or hard code a decision
event [5,6]. Numerous kinetic models that incorporate
the existing knowledge of the molecular mechanism
of the RP have been constructed [5,7–9]. Novak and
Tyson [5] constructed their kinetic model on the RP of
the mammalian cell cycle using a yeast-like core model
of the cyclin–Cdk interactions (emphasizing the deep
similarities of the Cdk-regulatory systems of yeast and
mammalian cells). They extended this core model with
kinetic modules for the growth factor sensing machin-
ery of mammalian cells; the retinoblastoma and E2F
transcription factor interactions and the antagonism
between the cyclin-dependent kinase inhibitor (p27
Kip1
)
and cyclin A/Cdk2 and cyclin E/Cdk2. With their
kinetic model, Novak and Tyson could account for the
findings obtained in the experiments by Zetterberg and
Larsson [10], which demonstrated the existence of RP
and positioned it somewhere in the G1-phase (a) cells
pulse treated (1 h) with cycloheximide early in the cell
cycle (before RP) immediately suffer a long delay in
the cell division cycle; (b) cells treated late in the divi-
sion cycle finish the current cycle similar to untreated
cells but are significantly delayed in the subsequent
division cycle; and (c) cells treated directly after the
RP do not suffer any delays in the current or subse-
quent division cycles.
Kinetic models that are constructed on the basis of
known biochemical information about the system and
its components are routinely used to integrate this
knowledge and compare the resulting simulations with
experimental observations. More extensive analysis
methods are necessary to quantify the importance of
each of the reaction steps for the systemic behavior.
Metabolic control analysis (MCA) [11,12] is a rigor-
ous framework that enables the assessment of how a
biological function is controlled by the various molec-
ular processes in the cell sustaining that function.
MCA has been used predominantly to analyse the
control distribution in steady states, although the the-
ory has been generalized for systems with dynamic
behavior [13–17]. In this contribution, we develop
and implement an extension to MCA that can be
used not only to quantify the control of system vari-
ables, but also to infer by which molecular species
this control was elicited.
Our approach is well suited for systems biology
studies where the primary goal is to come to a quanti-
tative understanding of systemic properties (such as
the emergent RP in the mammalian cell cycle) in terms
of the multitude of reaction steps and interactions
between the cell’s molecular parts (e.g. cell cycle pro-
teins) [18]. Numerous studies have recognized the need
for theoretical approaches in molecular biology [19–
24]. Our novel framework would be useful for molecu-
lar and systems biologists to determine which reactions
exert important control on a high-level system prop-
erty, and explain by which molecular species these
reaction steps exert their control.
Applying our approach to the RP, as modeled in
the kinetic model developed by Novak and Tyson [5],
revealed that the control of RP was distributed over
the different reaction steps in the network. The highest
control was exerted by the reactions responsible for:
(a) the interaction between retinoblastoma protein
(Rb) and E2F transcription factor; (b) synthesis of
delayed response genes (DRGs) and cyclin D/Cdk4 in
response to growth signals; (c) the E2F-dependent
cyclin E/Cdk2 synthesis reaction; and (d) the p27 for-
mation reactions. In addition, our analysis revealed
that RP control was exerted via the cyclin E/Cdk2:p27
complex. Independent of which reaction step or which
molecular species was perturbed, all of the effects on
the RP could be explained via an effect of the pertur-
bation on cyclin E/Cdk2:p27.
The mathematical model described here has been
submitted to the JWS Online Cellular Systems
Modelling Database and can be accessed at http://
Restriction point control of the mammalian cell cycle R. Conradie et al.
358 FEBS Journal 277 (2010) 357–367 ª 2009 The Authors Journal compilation ª 2009 FEBS
Table 1. Mammalian cell cycle model [5] kinetics.
Reaction number Rate equations
1 v(1) ¼ k16 Æ ERG(t)
2 v(2) ¼ k18 Æ DRG(t)
3 v(3) ¼ K10 Æ CD(t)
4 v(4) ¼ K10 Æ CYCD(t)
5 v(5) ¼ K25 Æ p27(t) Æ CYCE(t)
6 v(6) ¼ K25 Æ p27(t) Æ CYCA(t)
7 v(7) ¼ k24 Æ CYCD(t) Æ p27(t)
8 v(8) ¼ k24r Æ CD(t)
9 v(9) ¼ K30 Æ Cdc20(t) Æ CYCA(t)
10
v(10) ¼ K30 Æ Cdc20(t) Æ CA(t)
11 v(11) ¼ K25R Æ CE(t)
12 v(12) ¼ K25R Æ CA(t)
13 v(13) ¼ V8 Æ CE(t)
14 v(14) ¼ V8 Æ CYCE(t)
15 v(15) ¼ V6 Æ p27(t)
16 v(16) ¼ V6 Æ CE(t)
17 v(17) ¼ V6 Æ CD(t)
18 v(18) ¼ V6 Æ CA(t)
19 v(19) ¼ V2 Æ CYCB(t)
20 vð20Þ¼
ðK3a þ K3 Á Cdc20ðtÞÞð1 À Cdh1ðtÞÞ
J3
À Cdh1ðtÞþ1
21 vð21Þ¼
V4 Á Cdh1ðtÞ
J4
þ Cdh1ðtÞ
22 v(22) ¼ K34 Æ PPX(t)
23 vð23Þ¼
K31 Á CYCBðtÞð1 À IEPðtÞÞ
J31
À IEPðtÞþ1
24 vð24Þ¼
K32 Á PPXðtÞÁIEPðtÞ
J32
þ IEPðtÞ
25 v(25) ¼ K12 Æ Cdc20T(t)
26 vð26Þ¼
K13 Á IEPðtÞðCdc20TðtÞÀCdc20ðtÞÞ
J13
À Cdc20ðtÞþCdc20TðtÞ
27 vð27Þ¼
K14 Á Cdc20ðtÞ
J14
þ Cdc20ðtÞ
28 v(28) ¼ K12 Æ Cdc20(t)
29 v(29) ¼ E2F-Rb(t)(K20(CYCDT Æ LD + LA Æ CYCA(t)+LBÆ CYCB(t)+LEÆ CYCE(t)))
30 v(30) ¼ P-E2F-Rb(t)(K20(CYCDT Æ LD + LA Æ CYCA(t)+LBÆ CYCB(t)+LEÆ CYCE(t)))
31 vð31Þ¼K27 Á MASSðtÞÁIf
RbðtÞþE2F-RbðtÞþP-E2F-RbðtÞ
PP-RbðtÞþRbðtÞþE2F-RbðtÞþP-E2F-RbðtÞ
> 0:8; 0; 1
32 v(32) ¼ K28 Æ GM(t)
33 v(33) ¼ eps(t) Æ MU Æ GM(t)
34 vð34Þ¼
epsðtÞÁk15
DRGðtÞ
J15
2
þ 1
35 v(35) ¼ eps(t)(K11a + K11 Æ CYCB(t))
36 v(36) ¼ eps(t) Æ K29 Æ E2F(t) Æ MASS(t)
37 v(37) ¼ eps(t) Æ K33
38 v(38) ¼ eps(t)(K7a+K7 Æ E2F(t))
39 v(39) ¼ eps(t) Æ K9 Æ DRG(t)
40 v(40) ¼ eps(t) Æ K5
41 vð41Þ¼epsðtÞÁ
k17
DRGðtÞ
J17
2
DRGðtÞ
J17
2
þ 1
þ k17a Á ERGðtÞ
0
B
@
1
C
A
42 vð42Þ¼epsðtÞÁ
K1 Á
CYCBðtÞ
J1
2
CYCBðtÞ
J1
2
þ 1
þ K1a
0
B
@
1
C
A
43 v(43) ¼ Rb(t)(K20(CYCDT Æ LD + LA Æ CYCA(t)+LBÆ CYCB(t)+LEÆ CYCE(t)))
44 v(44) ¼ PP-Rb(t)(K19a(PP1T ) PP1A) + K19 Æ PP1A)
45 v(45) ¼ E2F-Rb(t) Æ K26R
46 v(46) ¼ E2F(t)(K23a + K23(CYCA(t) + CYCB(t)))
R. Conradie et al. Restriction point control of the mammalian cell cycle
FEBS Journal 277 (2010) 357–367 ª 2009 The Authors Journal compilation ª 2009 FEBS 359
jjj.biochem.sun.ac.za/database/conradie/index.html free
of charge.
Model, methods and theory
The model presented by Novak and Tyson [5] con-
sisted of 18 ordinary differential equations (ODEs)
and several algebraic equations. Each of these ODEs
were used, along with the wiring diagram of the mam-
malian cell cycle network, to distil 52 reaction steps
from the network, such that each step formed a func-
tional unit within the network. The retinoblastoma
and E2F transcription factor interactions which were
coded as steady-state algebraic equations in the origi-
nal model were coded explicitly as ODEs, increasing
the number of ODEs to 23 (see Table 1). The reaction
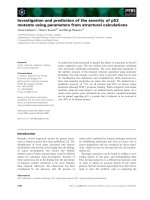
network of the cell cycle model is schematically repre-
sented in Fig. 1.
mathematica, version 6.0 (Wolfram Research,
Champaign, IL, USA, was
used for all simulations. The ODEs were solved using
the NDSolve function in combination with the Event-
Locator method to precisely locate events during the
simulation. A simulation result in which the RP and
the different phases of the cell cycle are indicated is
shown in Fig. 2. In the Novak and Tyson model, the
variable cyclin E represents the cyclin E/Cdk2 complex
(i.e. cyclin E in its active form). It is therefore not pos-
sible to distinguish between active and inactive forms
of cyclin E in the Novak and Tyson model.
MCA is a theoretical framework that can be used
to calculate the importance of each of the steps in a
reaction network for the systemic behavior, using
so-called control coefficients [11,12]. We used a pertur-
bation method to calculate control coefficients by add-
ing a multiplier to each of the 52 steps (a
1
to a
52
) and
Table 1. (Continued )
Reaction number Rate equations
47 v(47) ¼ P-E2F(t) Æ K22
48 v(48) ¼ E2F(t) Æ Rb(t) Æ K26
49 v(49) ¼ P-E2F-Rb(t) Æ K26R
50 v(50) ¼ Rb(t) Æ P-E2F(t) Æ K26
51 v(51) ¼ P-E2F-Rb(t) Æ K22
52 v(52) ¼ E2F-Rb(t)(K23a + K23(CYCA(t) + CYCB(t)))
Model parameters in [5]: k15 ¼ 0.025; k16 ¼ 0.025; J15 ¼ 0.1; k17a ¼ 0.035; k17 ¼ 1.; J17 ¼ 0.3; k18 ¼ 1.; K9 ¼ 0.25; K10 ¼ 0.5; k24 ¼
100.; k24r ¼ 1.; K7a ¼ 0.; K7 ¼ 0.06; K8a ¼ 0.01; K8 ¼ 0.2; K25
¼ 100.; K25R ¼ 1.; J8 ¼ 0.1; YE ¼ 1.; YB ¼ 0.05; K29 ¼ 0.005;
K30 ¼ 2.; K1a ¼ 0.01; K1 ¼ 0.06; J1 ¼ 0.1; K2a ¼ 0.005; K2 ¼ 2.; K2aa ¼ 0.1; K5 ¼ 2.; K6a ¼ 1.; K6 ¼ 10.; HE ¼ 0.5; HB ¼ 1.;
HA ¼ 0.5; LD ¼ 3.3; LE ¼ 5.; LB ¼ 5.; LA ¼ 3.; K20 ¼ 1.; K19a ¼ 0.; K19 ¼ 2.; K21 ¼ 1.; PP1T ¼ 1.; FE ¼ 25.; FB ¼ 2.; K3a ¼ 0.75;
K3 ¼ 14.; J3 ¼ 0.01; J4 ¼ 0.01; K4 ¼ 4.; GE ¼ 0.; GB ¼ 1.; GA ¼ 0.3; K33 ¼ 0.005; K34 ¼ 0.005; K31 ¼ 0.07; K32 ¼ 0.18; J31 ¼
0.01; J32 ¼ 0.01; K11a ¼ 0.; K11 ¼ 0.15; K12 ¼ 0.15; K13 ¼ 0.5; K14 ¼ 0.25; J13
¼ 0.005; J14 ¼ 0.005; K22 ¼ 0.1; K23a ¼ 0.0005;
K23 ¼ 0.1; K26 ¼ 1000.; K26R ¼ 20.; K27 ¼ 0.02; K28 ¼ 0.02; MU ¼ 0.0061.
Definitions and steady-state relations:
PP1A ¼
PP1T
K21
Á ðFE ÁðCYCAðtÞþCYCEðtÞÞ þ FB Á CYCBðtÞÞ þ 1
V2 ¼ K2aa Æ Cdc20(t) + K2a Æ (1)Cdh1(t)) + K2 Æ Cdh1(t)
V4 ¼ K4 Æ (GA Æ CYCA(t)+GBÆ CYCB(t)+GEÆ CYCE(t))
V6 ¼ K6a + K6 Æ (HA Æ CYCA(t)+HBÆ CYCB(t)+HEÆ CYCE(t))
V8 ¼
ðYE ÁðCYCAðtÞþCYCEðtÞÞ þ YB Á CYCBðtÞÞ Á K8
CYCET
þ J8
þ K8a
CYCET ¼ CE(t) + CYCE(t); CYCDT ¼ CD(t) + CYCD(t); CYCAT ¼ CA(t) + CYCA(t); P27T ¼ CA(t) + CD(t) + CE(t) + p27(t); eps(t) ¼ 1.
Event: MASS(t) = MASS(t) ⁄ 2, when Cdh1(t) crosses 0.2 from below.
ODEs and Initial conditions: CA’(t) = v(6) ) v(12) ) v(18) ) v(10), CA(0) = 0.0356927; CD’(t) = v(7) ) v(8) ) v(17) ) v(3), CD(0) = 0.010976;
Cdc20¢(t) = v(26) ) v(27) ) v(28), Cdc20(0) = 0.00220177; CDc20T’(t) = v(35) ) v(25), Cdc20T(0) = 2.36733; Cdh1¢(t) = v(20) ) v(21), Cdh1(0)
= 0.000653278; CE’(t) = v(5) ) v(11) ) v(13) ) v(16), CE(0) = 0.000542587; CYCA’(t) = v(36) ) v(9) ) v(6) + v(12) + v(18), CYCA(0) = 1.4094;
CYCB’(t) = v(42) ) v(19), CYCB(0) = 2.72898; CYCD’(t) = v(39) + v(17) + v(8) ) v(7) ) v(4), CYCD(0) = 0.43929; CYCE’(t) = v(38) ) v(14) )
v(5) + v(11) + v(16), CYCE(0) = 0.0229112; DRG’(t) = v(41) ) v(2), DRG(0) = 0.900533; ERG’(t) = v(34) ) v(1), ERG(0) = 0.0121809; GM’(t) =
v(31) ) v(32), GM(0) = 1.35565; IEP’(t) = v(23) ) v(24), IEP(0) = 0.154655; MASS’(t) = v(33), MASS(0) = 1.68776; P27¢(t) = v(40) + v(3) +
v(8) ) v(15)
) v(5) ) v(6) ) v(7) + v(11) + v(12) + v(13) + v(10), P27(0) = 0.00922806; PPX’(t) = v(37) ) v(22), PPX(0) = 1; (var1) pp-RB’(t) =
v(29) + v(30) + v(43) ) v(44), pp-RB(0) = 9.97574; (var2) E2F’(t) = v(29) + v(45) + v(47) ) v(46) ) v(48), E2F(0) = 0.989986; (var3) p-E2F’(t) =
v(30) + v(49) + v(46) ) v(47) ) v(50), p-E2F(0) = 3.98594; (var4) Rb’(t) = v(44) + v(45) + v(49) ) v(48) ) v(50) ) v(43), Rb(0) = 0.000190871;
(var5) E2F-Rb’(t) = v(51) + v(48) ) v(52) ) v(29) ) v(45), E2F-Rb(0) = 0.00478911; (var6) p-E2F-Rb’(t) = v(52) + v(50) ) v(51) ) v(30) ) v(49),
p-E2F-Rb(0) = 0.0192822.
Restriction point control of the mammalian cell cycle R. Conradie et al.
360 FEBS Journal 277 (2010) 357–367 ª 2009 The Authors Journal compilation ª 2009 FEBS
perturbing each reaction individually (0.1 per million
perturbation up and down). After each perturbation,
the model was simulated until a new limit cycle was
reached and then control coefficients for stationary
behavior (e.g. position of RP or the length of the
G
1
-phase) were calculated and expressed as a fraction
of the cell division cycle. For nonstationary behavior
(i.e. time-dependent variables such as concentrations of
metabolites or flux values for reaction steps), an exten-
sion of MCA was used that enables the determination
of control coefficients as the system progresses through
an arbitrary fixed interval of time (e.g. the cell division
cycle); a detailed description of the method is provided
elsewhere [17].
Results and Discussion
Control of the RP
We used a perturbation method to quantify the control
of the respective reaction steps in a mammalian cell
cycle model on the time of occurrence of the RP, C
RP
i
.
The analysis revealed (Fig. 3) that the control is dis-
tributed over the reaction network, with the majority
of the reactions steps exerting a small to moderate
control (jC
RP
i
j < 1). Eight reaction steps exerted a
high control (jC
RP
i
j > 2) on the RP; four of which
caused a delay (positive control), whereas the others
advanced the RP (negative control). The C
RP
i
for all
reaction steps sums up to 0; this is to be expected on
the basis of our definition of RP as a fraction of the
cell division cycle. The control coefficient of reaction
step x on RP is the percentage change in the fraction
of the cell cycle length at which RP occurs upon a 1%
AC
B
DE
F
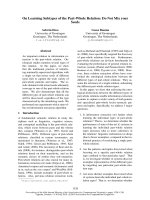
Fig. 1. The reaction network scheme of the mammalian cell cycle
model. The network consists of 52 reactions, which are grouped
into six modules. (A) A central component of the model is the
antagonism between cyclin B and Cdh1 (reactions 19, 20, 21 and
42). This antagonistic nature of the cell cycle is found amongst all
eukaryotes. (B) Included in the mammalian cell cycle model are the
early and delayed-response genes (ERG and DRG, respectively). In
the scheme the steps responsible for ERG, DRG and cyclin D syn-
thesis are reactions 34, 39 and 41. Growth factors bind to specific
receptors found on the plasma membrane to subsequently stimu-
late an intracellular signal-transduction pathway that activates
ERGs. The ERGs then activate DRGs and cyclin D, which set the
cell division cycle in motion. (C) The retinoblastoma protein (Rb) is
a general inhibitor of E2F (a transcription factor), and is distributed
between an active, hypophosphorylated form (PP-Rb) and an inac-
tive form. The phosphorylation of Rb is induced by Cdk/cyclin
complexes. (D) P27, a cyclin-dependent kinase inhibitor in the
G1-phase, also binds to cyclin A/Cdk2 (CYCA) and cyclin E/Cdk2
(CYCE) dimers to form inactive trimers (CA and CE, respectively,
these steps occur within the cyclin–cyclin dependent kinase inhibi-
tor module). Reactions are indicated by numbers; a white number
on a black background denotes reactions that are allosterically regu-
lated, reactions encircled by a dotted line are dependent on ribo-
some activity (eps factor in model reactions); the specific rate
equation for each of the reaction steps is provided in Table 1.
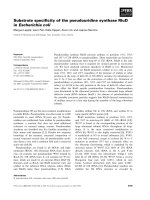
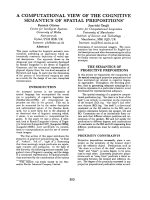
Fig. 2. Time course of the mammalian cell division cycle. A time
integration for 30 h is shown for six of the intermediates of the
system. The G1-, S/G2- and M-phases for one cell cycle are indi-
cated in the graph. The RP is also depicted in the G1-phase. It
should be noted that, in contrast to other switch points in the
model, the RP is not a hard coded event (i.e. it is not an explicit
function, but rather an emergent property of the model), and it is
empirically defined as the last time point where, upon cyclohexi-
mide (CHX) treatment, the cell would not finish the division cycle it
started with. The CHX treatment was mimicked in the model by
reducing the translation efficiency of the ribosomes [e or Eps(t)], a
parameter found in all synthesis steps of the model, from 1.0 to
0.5. This definition was taken from the original publication in which
the model was described [5].
R. Conradie et al. Restriction point control of the mammalian cell cycle
FEBS Journal 277 (2010) 357–367 ª 2009 The Authors Journal compilation ª 2009 FEBS 361
change in the activity of x. If we had defined the RP
as an absolute time point, then the sum of control
coefficients would add up to )1 (as they do for the
control on the cell division time).
The four steps delaying the RP the most (i.e. with
the highest positive control values) are: (a) the break-
down reaction of the DRG (Reaction 2, C
RP
2
$ 7); (b)
the step involved in proteolysis of cyclin D in the
cyclin D:p27 complex, releasing the cyclin dependent
kinase inhibitor (p27), (Reaction 3, C
RP
3
$ 5); (c) the
phosphatase reaction responsible for the dephosphory-
lation of retinoblastoma (Reaction 44, C
RP
44
$ 5); and
(d) the reaction step responsible for the synthesis of
p27 (Reaction 40, C
RP
40
$3).
The steps advancing the RP the most (i.e. with the
highest negative control values) are: (a) the synthesis
reactions of the DRGs and cyclin D (Reactions 41 and
39, C
RP
41
$À7 and C
RP
39
$À5); (b) the cyclin mediated
phosphorylation of retinoblastoma to release it from the
retinoblastoma:E2F complex yielding free E2F (Reac-
tion 29, C
RP
29
$À4); and (c) the reaction responsible for
the production of cyclin E (Reaction 38, C
RP
38
$À3).
To identify the mechanism underlying the high con-
trol coefficients of these steps for RP, we first analyzed
which molecular species showed the same control pat-
tern as that observed for the RP. A strong correlation
between the control on RP and the concentration
control coefficients of species directly involved in the
molecular machinery governing the RP is to be
expected. To test this, we plotted the concentration
control coefficients for the model variables against the
RP control for each of the reaction steps (Fig. 4). For
nine of the 23 molecular species, a strong correlation
was observed, with some species showing a positive
correlation, whereas others have a negative correlation
and all species have a different slope in the correlation
plots (note that the y-axes between the plots differ).
The nine variables that showed a strong correlation
were cyclin A, cyclin D, cyclin E, cyclin E:p27 com-
plex, p27, hyperphosphorylated retinoblastoma, E2F
transcription factor, unphosphorylated retinoblastoma
and unphosphorylated retinoblastoma bound to E2F
transcription factor. All of these species either reside in
the early and DRG module, in the cyclin–cyclin-depen-
dent kinase inhibitor module or the retinoblastoma–
E2F transcription factor module (Fig. 1, modules B, C
and D). These are the same three modules that also
contain the aforementioned eight steps with the highest
absolute C
RP
i
values.
A sensitivity analysis for the system variables was
made at the RP. For this, we initialized all variables in
the model at their concentrations at RP, except for
one variable to which we made a small perturbation.
A subsequent simulation was analyzed with respect to
cell cycle completion, (i.e. testing whether the perturba-
tion made to the one variable could prevent RP). The
perturbation that we made to the variable was to
change its value to a value it had just before RP (i.e.
followed its integration path back in time). In this
way, we determined the minimal time period that a
variable must be regressed from RP along its time inte-
gration in order to stall the cell cycle progression.
From this analysis, it was evident that the RP was
most sensitive for changes made to the cyclin
E/Cdk2:p27 complex; changing its value to the value it
had 0.04 s before the RP resulted in the cells entering
quiescence. The species with values that needed to be
regressed 0.5 s or less to prevent RP are listed in
Table 2; each of these variables also showed a good
correlation in Fig. 4.
The six metabolites for which RP showed a high
sensitivity each had a different gradient in the correla-
Reaction number (i)
–6
–4
–2
i
C
RP
0
2
3
44
40
5
46
20
48
33
31
17
21
30
15
47
16
38
29
39
41
2
4
6
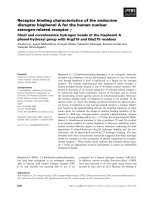
Fig. 3. The control exerted on the RP by the
respective reaction steps (numbered as in
Fig. 1) is shown. RP control is defined as the
percentage change in the time point of
occurrence of RP (as a fraction of total cell
cycle time) upon a 1% change in activity of a
reaction step. A positive control of a reaction
step indicates that an increase in the activity
of the step delays the occurrence of RP.
Restriction point control of the mammalian cell cycle R. Conradie et al.
362 FEBS Journal 277 (2010) 357–367 ª 2009 The Authors Journal compilation ª 2009 FEBS
tion plots (Fig. 4); for some intermediates, the correla-
tion was positive, whereas, for others, it was negative,
and each had a different slope. The correlations
observed in Fig. 4 suggest that several of the interme-
diates also correlate with one another (independent of
which reaction is perturbed). Such covariances between
intermediates make it difficult to asses a causal rela-
tionship. The RP showed the highest sensitivity for
changes in the concentration of cyclin E/Cdk2:p27
(Table 2); all of the other species needed to be per-
turbed more, either in terms of time regression or in
terms of the percentage change in their concentrations.
This high sensitivity indicates that this intermediate is
important for the regulation of RP, and we tested
whether the difference in slopes in the correlation plots
could be related to co-correlations between the inter-
mediates and cyclin E/Cdk2:p27.
For this, we first determined the co-control coeffi-
cients of cyclin E/Cdk2:p27 with the nine intermediates
that showed a good correlation in Fig. 4. A co-control
coefficient is defined as the ratio of two concentration
control coefficients and quantifies the correlation
between the two intermediates upon a small perturba-
tion of a reaction step [25]. Interestingly, the values for
the co-control coefficients were largely independent of
Fig. 4. Correlation plots for concentration control coefficients and restriction point (RP) control. Species that demonstrated a good correlation
between their concentration control coefficients and RP control coefficients are shown in the top nine figure parts. To illustrate the contrast,
we also show plots for three species that did not show a good correlation in the bottom figure parts. CE, cyclin E/Cdk2:p27.
Table 2. Species-dependent regression time necessary for cells to
enter quiescence. The six molecular intermediates for which the
RP showed the highest sensitivity were each regressed in time (at
the same time as initializing all other intermediates at their RP con-
centrations) until, upon subsequent simulation, the cells enter qui-
escence. This minimal time that a species must be regressed to
prevent RP is listed as the Regression time in the table. The RP
concentration and the percentage change in concentration of the
intermediate concentration at the regression time point compared
to the RP are also given. AU, arbitrary units.
Species
Regression
time (s)
% Change in
concentration
Concentration
at RP (AU)
CE 0.04 0.0003 0.48
CA 0.18 0.004 0.02
p27 0.22 )0.001 0.86
E2F 0.22 0.004 0.35
CYCE 0.47 0.007 0.01
Rb 0.54 )0.009 0.27
R. Conradie et al. Restriction point control of the mammalian cell cycle
FEBS Journal 277 (2010) 357–367 ª 2009 The Authors Journal compilation ª 2009 FEBS 363
the reaction step that was perturbed, (i.e. two interme-
diates would co-vary, independent of which step was
perturbed). Thus, the co-control coefficients of the
model species with the cyclin E/Cdk2:p27 complex
quantify the extent that these species co-vary with the
complex. For example, cyclin E/Cdk2 (CYCE) and cy-
clin E/Cdk2:p27 (CE) showed a positive co-variation,
with a co-control coefficient
i
O
CYCE
CE
of 0.53, indicating
that changes in the concentration of CE were corre-
lated with approximately half the concentration change
in CYCE. By contrast, CE concentration is negatively
correlated with p27
Kip1
concentration (i.e. if one goes
up, the other goes down) quantitatively expressed in a
co-control coefficient,
i
O
p27
CE
of )1.2.
Subsequently, we calculated the ratio of the gradi-
ents in the correlation plots (Fig. 4) for the intermedi-
ates, and for cyclin E/Cdk2:p27. For each of the
intermediates, the ratio of its gradient in the correla-
tion plot and the gradient of cyclin E/Cdk2:p27 was
close to the value of the co-control coefficient of the
intermediate with cyclin E/Cdk2:p27. For example,
the gradient ratio for cyclin E/Cdk2 and cyclin
E/Cdk2:p27 equals 0.49 and, for p27
Kip1
and cyclin
E/Cdk2:p27, the ratio equals )1.1 (these values are
close to the respective co-control coefficients 0.53 and
)1.2 as calculated above). This result is in agreement
with the hypothesis that the correlations observed in
Fig. 4, between changes in system intermediate con-
centrations and RP, can be accounted for by co-corre-
lations of those intermediates with cyclin E/Cdk2:p27.
The observation that cyclin E/Cdk2:p27 needed to
be regressed for the shortest time period (Table 2)
indicated that this molecular species on its own could
prevent RP. Regressing any of the other species fur-
ther back in time could potentially effect RP indi-
rectly via cyclin E/Cdk2:p27. We further tested this
by analyzing the effect on the cyclin E/Cdk2:p27 con-
centration upon perturbing each of the other variables
to which the RP showed a high sensitivity. Indeed, as
can be seen in Fig. 5A, changing any of these vari-
ables to such an extent that they interfered with the
RP did lead to a change in cyclin E/Cdk2:p27. Each
of the curves in Fig. 5A is the result of a separate
time simulation for the cyclin E/Cdk2:p27 concentra-
tion upon a perturbation of the indicated (red circle)
model variable. The wt curve is the reference curve
where no perturbation was made. The time point
(x-axis value) corresponding with the red symbols
indicates RP. From Fig. 5, it can be seen that the
shift brought about to the RP was in very good
agreement with the extent that the concentration of
cyclin E/Cdk2:p27 was affected by the perturbation,
for most metabolite perturbations, RP was shifted to
the time point where the cyclin E/Cdk2:p27 complex
reached a critical concentration. Because a causal rela-
tionship between the cyclin E/Cdk2:p27 concentration
and the RP would necessitate that, for each perturba-
tion of the complex, the RP must shift accordingly,
we perturbed all reaction steps with a high control on
RP and plotted the occurrence of RP together with
the trajectory for cyclin E/Cdk2:p27 (Fig. 5B). The
reactions that were perturbed for each of the curves
in Fig. 5 are indicated by number (corresponding to
the numbers in Fig. 1). Again, a very good correla-
tion, in excellent agreement with the shift in RP upon
metabolite perturbations, was observed for the reac-
tion perturbations. The correlation plots along with
the sensitivity analysis are indicative of a causal rela-
2.0 2.2 2.4 2.6 2.8
2.0 2.2 2.4 2.6 2.8
A
B
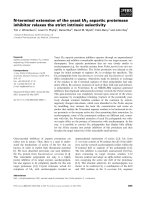
Fig. 5. Control of the RP via the cyclin E/Cdk2:p27. For each of the
six species towards which RP showed a high sensitivity (Table 2),
a perturbation was made to its concentration such that it would
affect RP, whereas all other variables where initialized with their
RP concentrations. The results of the subsequent time integrations,
following the cyclin E/Cdk2:p27 concentration and the occurrence
of RP, are plotted in (A), with the points denoting the time point of
RP (x-axis) and the concentration of cyclin E/Cdk2:p27 (y-axis). For
each simulation, the perturbed variable is indicated. (B) The results
of similar integrations are shown, subsequent to perturbation of the
eight reactions that had a high RP control.
Restriction point control of the mammalian cell cycle R. Conradie et al.
364 FEBS Journal 277 (2010) 357–367 ª 2009 The Authors Journal compilation ª 2009 FEBS
tionship between the cyclin E/Cdk2:p27 concentration
and RP; independent of the type of perturbation
made, a critical cyclin E/Cdk2:p27 concentration must
be reached for RP transition.
The method presented here, combining control
analysis with sensitivity analysis, and showing that all
perturbations work via the same mechanism, com-
prises a generic method to test for causal relation-
ships. We illustrate the method for RP control in the
Novak and Tyson model and the results obtained
clearly indicate that the control of RP runs mostly
via cyclin E/Cdk2:p27. Newer models have been
constructed for the RP [4,9] but such models do not
describe the complete cell cycle. Using a core model
and experimental data of individual gene expression
levels, Yao et al. [4] demonstrated that the interplay
between retinoblastoma and E2F creates a bistable
switch that probably regulates the RP. Although p27
was not modeled explicitly in this core model (its
importance was stated in the text), there is still a strong
similarity between the reactions that control RP,
together with the feedback loops from cyclin D and
cyclin E, in our model and the reactions involved in the
bistable switch in the Yao model. Thus, according to
our analysis of the model of Novak and Tyson, taken
together with the summation theorem, the interplay
between retinoblastoma and E2F creates a bistable
switch that has a strong effect on the RP, but with a
net positive control (i.e. advancing the RP), which is
countered by the reactions affecting p27 (i.e. delaying
the RP).
RP control in cancer cells
Deregulation of the RP is implicated in almost all
tumor cells and it has been suggested that regulation
of the RP is essential to prevent cells from becoming
cancerous [1]. We thus investigated whether the species
shown by our analysis to alter the RP were indeed
implicated in malignancies in mammals. Comparing
phenotypic observations of tumor cells with the results
of our analysis, we indeed observed that changes to
cells lines leading to an increased concentration of
cyclin E/Cdk2:p27 concentration, such as cyclin E
overexpression [26–29] and p27
Kip1
downregulation
[28–32], yielded uncontrolled tumour proliferation in a
wide range of human tissues. Furthermore, it was
observed that, in aggressive stomach, prostate, breast,
lung and pituitary cancers, p27
Kip1
levels were low,
either as a result of degradation or translocation to the
cytoplasm [33,34].
These observations are in agreement with our
co-control analysis; the co-control coefficients,
i
O
CYCE
CE
¼ 0:53 and
i
O
p27
CE
¼À1:2 quantify a strong posi-
tive correlation between cyclin E and cyclin
E/Cdk2:p27 and a strong negative correlation between
p27 and cyclin E/Cdk2:p27, where these co-control
coefficients are largely independent of which step is
perturbed. These observations and model analyses lead
us to hypothesize that RP is advanced in cancer cell
lines as a result of an increased concentration of cyclin
E/Cdk2:p27.
Even though the Novak and Tyson model does not
explicitly model the localization of p27 from the
nucleus to the cytoplasm (i.e. the transport of p27
from the nucleus is implicit in the reaction that
degrades p27; Reaction 15, C
RP
15
$À1), our results are
consistent with the observation that the aggressiveness
of cancer cells can be linked to a shift in the localiza-
tion of p27 from the nucleus to the cytoplasm [34]. As
we have shown in our analysis, a decrease in the con-
centration of p27 is strongly correlated with an
increase of the cyclin E/Cdk2:p27 concentration, which
will advance the RP. This is in agreement with the
apparent absence of RP in cancer cells, which might
be translated as advancing RP to such an extent that it
never prevents G1/S transition. The relatively high
negative control of the consumption reaction of p27
(Reaction 15, C
RP
15
$À1) is also in agreement with
experiments showing that a reduction in p27 levels
promotes the passage of the RP [35].
Conclusions
In cancer cells, RP control appears to be completely
absent. On the basis of an extensive analysis of a
detailed kinetic model, we hypothesize that such a
shift of the RP to a much earlier point in the cell
cycle might be caused by an increased concentration
in the cyclin E/Cdk2:p27 complex concentration. We
showed that a perturbation of cyclin E/Cdk2:p27 on
its own was sufficient to shift the RP. In addition, we
showed that the effect on RP upon perturbating any
of the reaction steps could always be explained via a
change in the cyclin E/Cdk2:p27 concentration, lead-
ing to the proposal that RP control by the reaction
steps works via the cyclin E/Cdk2:p27 complex. The
method that we have used to quantify the control of
a reaction step on any of the systems variables can be
used to identify the reaction steps that would have
the biggest effect on the cyclin E/Cdk2:p27 concentra-
tion and thereby shift RP most strongly. An impor-
tant implication is that it should be possible to shift
RP in cancer cells back to its normal point via per-
turbations of steps that effect the cyclin E/Cdk2:p27
concentration.
R. Conradie et al. Restriction point control of the mammalian cell cycle
FEBS Journal 277 (2010) 357–367 ª 2009 The Authors Journal compilation ª 2009 FEBS 365
Acknowledgements
R.C. and J.L.S. acknowledge the National Bioinformat-
ics Network (South Africa) for funding and support for
the JWS Online project. F.J.B. thanks the Netherlands
Institute for Systems Biology and NWO for funding.
A.C. acknowledges support from the Italian research
fund FIRB (project RBPR0523C3). B.N. thanks UNI-
CELLSYS, YSBN and BBSRC for funding. H.V.W.
thanks EC-FPs BioSim, EC-MOAN, NucSys, UNI-
CELLSYS, YSBN, ESF-FuncDyn, NWO-FALW and
the BBSRC and EPSRC for support.
References
1 Pardee A (1974) A restriction point for control of nor-
mal animal cell proliferation. Proc Natl Acad Sci USA
71, 1286–1290.
2 Planas-Silva MD, Weinberg RA (1997) The restriction
point and control of cell proliferation. Current Opin
Cell Biol 9, 768–772.
3 Blagosklonny MV & Pardee AB (2002) The restriction
point of the cell cycle. Cell Cycle 1, 103–110.
4 Yao G & Lee TJ, Mori S, Nevins JR & You L (2008)
A bistable Rb-E2F switch underlies the restriction
point. Nat Cell Biol 10, 476–482.
5 Novak B. & Tyson J (2004) A model for restriction
point control of the mammalian cell cycle. J Theor Biol
230, 563–579.
6 Barberis M, Klipp E, Vanoni M & Alberghina L (2007)
Cell size at S phase initiation: an emergent property of
the G1/S network. PLoS Comput Biol 3, e64,
doi:10.1371/journal.pcbi.0030064.
7 Hatzimanikatis V, Lee KH & Bailey JE (1999) A math-
ematical description of regulation of the G1-S transition
of the mammalian cell cycle. Biotechnol Bioeng 65,
631–637.
8 Aguda B & Tang Y (1999) The kinetic origins of the
restriction point in the mammalian cell cycle. Cell
Prolifer 32, 321–335.
9 Haberichter T, Ma
¨
dge B, Christopher RA, Yoshioka
N, Dhiman A, Miller R, Gendelman R, Aksenov SV,
Khalil IG, Dowdy SF et al. (2007) A systems biology
dynamical model of mammalian G1 cell cycle progres-
sion. Mol Syst Biol 3, 84, doi:10.1038/msb4100126.
10 Zetterberg A & Larsson O (1995) ‘Cell cycle progres-
sion and growth in mammalian cells: kinetic aspects of
transition events’. In Cell Cycle Control (Hutchison C
& Glover DM, eds), pp. 206–227. Oxford University
Press, Oxford.
11 Kacser H & Burns JA (1973) The control of flux. Symp
Soc Exp Biol 27 , 65–104.
12 Heinrich R & Rapoport TA (1974) A linear steady-state
treatment of enzymatic chains. General properties con-
trol, and effector strength. Eur J Biochem 42, 89–95.
13 Reijenga K, Westerhoff HV, Kholodenko BN & Snoep
J (2002) Control analysis for autonomously oscillating
biochemical networks. Biophys J 82, 99–108.
14 Ingalls B & Sauro H (2003) Sensitivity analysis of stoi-
chiometric networks: an extension of metabolic control
analysis to non-steady state trajectories. J Theor Biol
222, 23–26.
15 Kholodenko B, Demin O & Westerhoff H (1997)
Control analysis of periodic phenomena in biological
systems. J Phys Chem B 101, 2070–2081.
16 Demin O, Westerhoff H & Kholodenko B (1999)
Control analysis of stationary forced oscillations.
J Phys Chem B 103, 10695–10710.
17 Conradie R, Westerhoff H, Hofmeyr JH, Rohwer J &
Snoep J (2006) Summation theorems for flux and
concentration control coefficients of dynamic systems.
Syst Biol, IEE Proc 153, 314–317.
18 Snoep JL & Westerhoff HV (2005) ‘From isolation to
integration a systems biology approach for building the
Silicon Cell’. In Systems Biology: Definitions and
Perspectives
(Alberghina L & Westerhoff HV, eds), p.
7. Springer-Verlag, Berlin ⁄ Heidelberg.
19 Maddox J (1994) Cell-cycle regulation by numbers.
Nature 369, 437.
20 Hartwell LH, Hopfield JJ, Leibler S & Murray AW
(1999) From molecular to modular cell biology. Nature
402, C47–C52.
21 Lander ES & Weinberg RA (2000) Genomics: journey
to the center of biology. Science 287, 1777–1782.
22 Nurse P (2000) The incredible life and times of biologi-
cal cells. Science 289, 1711–1716.
23 Gilman A & Arkin AP (2002) Genetic ‘code’: representa-
tions and dynamical models of genetic components and
networks. Annu Rev Genomics Hum Genet 3, 341–369.
24 Kumar S & Feidler JC (2003) BioSPICE: a computa-
tional infrastructure for integrative biology. OMICS 7,
225.
25 Hofmeyr JH & Cornish-Bowden A (1996) Co-response
analysis: a new experimental strategy for metabolic con-
trol analysis. J Theor Biol 182, 371–380.
26 Skalicky DA, Kench JG, Segara D, Coleman MJ, Suth-
erland RL, Henshall SM, Musgrove EA & Biankin AV
(2006) Cyclin E expression and outcome in pancreatic
ductal adenocarcinoma. Cancer Epidemiol Biomarkers
Prev 15, 1941–1947.
27 Schraml P, Bucher C, Bissig H, Nocito A, Haas P,
Wilber K, Seelig S, Kononen J, Mihatsch MJ,
Dirnhofer S, Dirnhofer S et al. (2003) cyclin E
overexpression and amplification in human tumours.
J Pathol 200(3), 375–382.
28 Hayashi H, Ogawa N, Ishiwa N, Yazawa T, Inayama
Y, Ito T & Kitamura H (2001) High cyclin E and low
p27/Kip1 expressions are potentially poor rognostic
factors in lung adenocarcinoma patients. Lung Cancer
34, 59–65.
Restriction point control of the mammalian cell cycle R. Conradie et al.
366 FEBS Journal 277 (2010) 357–367 ª 2009 The Authors Journal compilation ª 2009 FEBS
29 Tamiya T, Mizumatsu S, Ono Y, Abe T, Matsumoto
K, Furuta T & Ohmoto T (2001) High cyclin E/low
p27Kip1 expression is associated with poor prognosis in
astrocytomas. Acta Neuropathol 101, 334–340.
30 Pizzo JJD, Borkowski A, Jacobs SC & Kyprianou N
(1999) Loss of cell cycle regulators p27Kip1 and cyclin
E in transitional cell carcinoma of the bladder correlates
with tumor grade and patient survival. Am J Pathol
155, 1129–1136.
31 Erlanson M, Portin C, Linderholm B, Lindh J, Roos G
& Landberg G (1998) Expression of cyclin E and
the cyclin-dependent kinase inhibitor p27 in malig-
nant lymphomas-prognostic implications. Blood 92,
770–777.
32 Geisen C, Karsunky H, Yucel R & Moroy T (2003)
Loss of p27Kip1 cooperates with cyclin E in T-cell
lymphomagenesis. Oncogene 22, 1724–1729.
33 Zhou Q, He Q & Liang LJ (2003) Expression of p27
cyclin E and cyclin A in hepatocellular carcinoma and its
clinical significance. World J Gastroenterol 9, 2450–2454.
34 Chu IM, Hengst L & Slingerland JM (2008) The Cdk
inhibitor p27 in human cancer: prognostic potential and
relevance to anticancer therapy. Nat Rev Cancer 8,
253–267.
35 Hitomi M, Yang K, Guo Y, Fretthold J, Harwalkar J
& Stacey DW (2006) p27Kip1 and cyclin dependent
kinase 2 regulate passage through the restriction point.
Cell Cycle 5, 2281–2289.
R. Conradie et al. Restriction point control of the mammalian cell cycle
FEBS Journal 277 (2010) 357–367 ª 2009 The Authors Journal compilation ª 2009 FEBS 367