THE UCLA INTERNET REPORT 2001 Surveying the Digital Future doc
Bạn đang xem bản rút gọn của tài liệu. Xem và tải ngay bản đầy đủ của tài liệu tại đây (226.53 KB, 95 trang )
THE UCLA INTERNET REPORT 2001
Surveying the Digital Future
YEAR TWO
UCLA CENTER FOR COMMUNICATION POLICY
WWW.CCP.UCLA.EDU
THE UCLA INTERNET REPORT 2001
Surveying the Digital Future
YEAR TWO
Jeffrey I. Cole, Ph.D.
Director, UCLA Center for Communication Policy
Founder and Organizer, World Internet Project
Michael Suman, Ph.D., Research Director
Phoebe Schramm, Associate Director
Robert Lunn, Ph.D., Senior Research Analyst
Jean-Francois Coget, Graduate Associate
David Firth, Graduate Associate
Dennis Fortier, Graduate Associate
Koren Hanson, Graduate Associate
Qin Jiang, Graduate Associate
Rajesh Singh, Ph.D., Graduate Associate
Yutaka Yamauchi, Graduate Associate
Jedrix-Sean Aquino, Research Assistant
Written by Harlan Lebo
Design by Robin Weisz
Production editing by Monica Dunahee
THE UCLA INTERNET REPORT 2001
Surveying the Digital Future
YEAR TWO
ADDITIONAL COPIES
You are welcome to download additional copies of The UCLA Internet Report 2001 for research or
individual use. To download the full text and graphs in this report, go to www.ccp.ucla.edu.
Printed copies of this report can be ordered by contacting the Center at the address below.
ATTRIBUTION
Excerpted material from this report can be cited in media coverage and institutional publications. Text
excerpts should be attributed to The UCLA Internet Report 2001 – “Surveying the Digital Future.” On
second reference, use The UCLA Internet Report 2001.
Graphs should be attributed in a source line to:
The UCLA Internet Report 2001 “Surveying the Digital Future”
UCLA Center for Communication Policy
REPRINTING
Reprinting of this report in any form other than brief excerpts requires permission from the UCLA Center
for Communication Policy at the address below.
QUESTIONS
E-mail:
UCLA Center for Communication Policy
Box 951586
Los Angeles, CA 90095-1586
(310)825-3711
www.ccp.ucla.edu
The UCLA Center for Communication Policy thanks its foundation and corporate partners,
whose participation in the World Internet Project make this work possible:
National Science Foundation
America Online (AOL) Time Warner
Microsoft
The Walt Disney Company
Sony
Verizon
Pacific Bell
DirecTV
Accenture
Hewlett-Packard
Merrill Lynch
National Cable Television Association
THE UCLA INTERNET REPORT: Surveying the Digital Future 5
SUMMARY: UCLA INTERNET REPORT 2001
In 2000, the first report of the UCLA Internet Project created a base profile of behavior and attitudes
about Internet use and non-use. This year, the 2001 UCLA Internet Report presents data on more than
100 major issues. Most of this 2001 data is compared with findings from 2000.
The 2001 report focuses on Internet users vs. non-users, as well as new users (less than one year of
experience) compared to very experienced users (five or more years of experience).
The 2001 UCLA Internet Project leaves little doubt that the Internet is now a mainstream activity in
American life that continues to spread among people across all age groups, education levels, and incomes.
Highlights of the UCLA Internet Report within its five major areas include:
WHO IS ONLINE? WHO IS NOT? WHAT ARE USERS DOING ONLINE?
TOTAL INTERNET ACCESS
n The UCLA Internet Project found that 72.3 percent of Americans in 2001 go online, an increase from
66.9 percent in 2000. (Pages 17 and 18)
HOURS ONLINE
n Users in 2001 go online about 9.8 hours per week, up from 9.4 hours per week in 2000. (Pages 17 and
18)
ARE USERS SATISFIED OR DISSATISFIED WITH THE INTERNET?
n Users of the Internet in 2001 are satisfied with online technology at the same level as in 2000. The
Internet overall received a rating of 4.0 on a scale of 1 (low) to 5 (high).
n Users are most satisfied with their ability to communicate with other people using the Internet.
n In a new question for 2001, users positively rated the ability to purchase items online as 3.7 on a scale of
1 to 5.
n Users were least satisfied with the speed of their connection to the Internet, rating it 3.2. (Page 87)
MOST POPULAR INTERNET ACTIVITIES
n The top five most popular Internet activities are using e-mail and instant messaging, web browsing,
buying online, finding entertainment information, and reading news. (Page 18)
GOING ONLINE: THE PRIMARY REASON
n The top reason why users started to use the Internet is to obtain information quickly, followed by work
needs, and then access to e-mail. (Page 19)
THE UCLA INTERNET REPORT: Surveying the Digital Future 6
SUMMARY: UCLA INTERNET REPORT 2001 (CONTINUED)
BUYING ONLINE
n 48.9 percent of Internet users purchased online in 2001, down from 50.7 percent in 2000. (Page 38)
WILL NON-USERS GO ONLINE IN 2002?
n Of respondents who are not online, 44.4 percent say they expect to go online within 12 months, up from
40 percent in 2000. (Page 28)
NEW USERS VS. VERY EXPERIENCED USERS: MAJOR DIFFERENCES
n The study found that a new gap in patterns of Internet use is emerging: the difference between how
experienced users and those with little experience online use the Internet. (Page 18)
MODEM VS. BROADBAND: HOW LONG ONLINE?
n Internet users with broadband report 3.2 more online hours per week than Internet users who connect
with a telephone modem. (Page 25)
NON-USERS: WHY NOT ONLINE?
n The primary reason why 27.7 percent of Americans are not online is “no computer” or “lack of access
to an adequate computer.” The number of non-users who are “not interested” is declining. (Page 26)
ELECTRONIC DROPOUTS: WHY?
n The primary reason for not using the Internet given by non-users who were once users is the same as the
response of those who do not currently use the Internet: “no computer available.” (Page 27)
MEDIA USE AND TRUST
MEDIA USE
n As in 2000, the 2001 UCLA Internet Report found that Internet users employ substantially more media
than non-users. The only media use more by non-users than users is television. (Page 30)
TELEVISION: VIEWING DECLINES AMONG INTERNET USERS
n Responses to several questions reveal that Internet users of all ages watch significantly less television than
non-users: Internet users in 2001 watch 4.5 hours per week less television than non-users; television
viewing decreases as Internet experience increases; almost one-quarter of adults say that the children in
their households watch less television since they started using the Internet. (Pages 32, 76, and 78)
THE INTERNET: AN IMPORTANT SOURCE OF INFORMATION? FOR ENTERTAINMENT?
n Increasing numbers of users say the Internet is an important source of information. Even new users
believe that the Internet is a very important or extremely important source of information.
n Rankings of online content as a source of entertainment are roughly unchanged from 2000. (Page 33)
MEDIA AND SEXUAL CONTENT
n A new question for 2001 asks about the amount of sexual content on television, in movies, and on the
Internet. Large majorities of respondents (82.4 percent for movies, 80.5 percent for television, and 61.1
percent for the Internet) say that half or more of the subject matter found in all of these media contains
too much sexual content. (Page 35)
INFORMATION ON THE INTERNET: IS IT RELIABLE AND ACCURATE?
n 36.3 percent of users say that half of online information is reliable and accurate. (Page 36)
THE UCLA INTERNET REPORT: Surveying the Digital Future 7
SUMMARY: UCLA INTERNET REPORT 2001 (CONTINUED)
CONSUMER BEHAVIOR
HOW OFTEN DO YOU BUY ONLINE?
n Of the 48.9 percent of users who made a purchase online in 2001, more than three-quarters say they
make 1-10 purchases per year. Very experienced Internet users average 20 online purchases per year,
compared to four annual purchases for new users. (Page 38)
SHOPPING IN STORES, BUYING ONLINE; SHOPPING ONLINE, BUYING IN STORES
n The number of Internet purchasers who say they shop in local stores and later buy online has declined.
The number of Internet users who browse online and later buy in stores has also declined. (Page 48)
INTERNET PURCHASING: EFFECTS ON RETAIL, MAIL AND PHONE ORDERS
n In 2001, online buying continues to replace some purchasing in retail stores, but at a lower level than in
2000. Buying online also affects purchasing by mail or phone order. (Pages 40, 41, and 45)
THE FIRST ONLINE PURCHASE: HOW LONG DID IT TAKE?
n Most Internet users do not begin buying online immediately; users 56-65 years old require the longest
amount of time (23.2 months) before the first purchase, followed by those ages 19-24.
n When asked why users wait to make their first online purchase, concern about fraud and deception rank
among the top reasons. (Page 42 and 43)
SALES TAX: WOULD IT AFFECT ONLINE PURCHASING?
n Of current Internet purchasers, 43.3 percent agree or strongly agree that the addition of sales tax for
online purchases would reduce their buying on the Internet. (Page 52)
FREE ONLINE SERVICES: WILL INTERNET USERS PAY FOR THEM?
n When Internet users are asked if they would be willing to pay a reasonable price for a free online service
if it became a pay service, 37.9 percent agree, while 32.8 disagree. (Page 53)
CONCERNS ABOUT CREDIT CARD INFORMATION: A MAJOR PROBLEM
n In both 2000 and 2001, the UCLA Internet Project found deep concerns about privacy among all users;
prominent among the privacy issues was concern about credit card security. (Page 53)
COMMUNICATION PATTERNS
DOES E-MAIL REQUIRE TOO MUCH TIME?
n Although complaints about bulging e-mail inboxes may seem a common office problem, large majorities
of users in 2000 and 2001 do not think that e-mail requires too much time. (Page 58)
E-MAIL: DOES IT HELP YOU REACH OUT TO OTHERS?
n Growing numbers of users say that e-mail helps them communicate with people they could not normally
connect with otherwise. (Pages 56, 57, and 72)
MEETING PEOPLE: IS IT EASIER ONLINE?
n Although Internet users consider e-mail a powerful tool to stay in touch with people they know, they do
not believe it is easier to meet new people online than in person. (Pages 59)
INTERNET SCREEN NAMES WITH DIFFERENT PERSONALITIES
n A small number of users say they have multiple screen names, and each name has its own personality.
This is most common among girls ages 16-18. (Page 61)
THE UCLA INTERNET REPORT: Surveying the Digital Future 8
SUMMARY: UCLA INTERNET REPORT 2001 (CONTINUED)
SOCIAL AND PSYCHOLOGICAL EFFECTS
CHILDREN AND THE INTERNET
n Internet users and non-users agree at nearly identical levels that children can gain access to “a lot of
inappropriate material” while online.
n Adults say that children in their household do not spend too much time online, nor does the Internet
negatively affect their grades or friendships.
n Almost one-quarter of children now watch less TV than before they used the Internet. (Pages 75-81)
PRIVACY ONLINE
n As in 2000, the issue of privacy continues to raise significant concerns about the Internet among both
users and non-users in 2001. Users and non-users alike express considerable concern that using the
Internet creates risks to individual privacy. (Pages 65-67)
MAINTAINING PRIVACY FROM PRIVATE BUSINESS AND GOVERNMENT
n Private business has joined the government as a major threat to personal privacy. Internet users and
non-users express extremely high levels of concern about maintaining the privacy of personal information
from both government and business. (Page 66)
HOUSEHOLD TIME TOGETHER
n Internet users overall believe that going online either has no influence on the amount of time spent with
household members, or positively influences household time together.
n Experience online does affect household time together. (Page 68)
HOW DOES THE INTERNET AFFECT TIME WITH FAMILY AND FRIENDS?
n Internet users spend more time than non-users socializing with friends, and almost as much time
socializing with family members. Users and non-users report similar amounts of time involved in
activities with household members; the only decline was time spent watching television. (Pages 68 and
69)
ARE INTERNET USERS CONNECTING MORE WITH FAMILY AND FRIENDS?
n The Internet is a catalyst for creating and maintaining friendships and family relationships – but views
about its usefulness for this purpose vary widely. (Page 71)
ONLINE FRIENDS: DO YOU MEET THEM IN PERSON?
n In 2001, 18.8 percent of Internet users say they have met someone in person whom they originally met
online. Those users report an average six new friends met in person, up slightly from 2000. (Page 72)
POLITICAL POWER AND INFLUENCE
n Users in 2001 say the Internet continues to be an important resource for gathering information about
political issues, but declining numbers believe that the Internet gives them more political power, or helps
them influence political decisions and government officials. (Pages 82)
DOES THE INTERNET AFFECT WORKPLACE PRODUCTIVITY?
n Most users say the Internet is a catalyst for workplace productivity.
n Of employees who say the Internet makes them less productive, the most frequently cited reason for
lower productivity is spending time on the Internet doing things unrelated to their jobs. (Page 84 and 85)
UCLA INTERNET REPORT 2001: CONTENTS
SUMMARY 5
THE UCLA INTERNET PROJECT: SURVEYING THE DIGITAL FUTURE 11
INTERNET USERS AND NON-USERS: WHO IS ONLINE, WHO IS NOT 16
INTERNET ACCESS AND USE: 2000 VS. 2001 17
NEW USERS VS. VERY EXPERIENCED USERS: WHAT DO THEY DO ONLINE? 18
GOING ONLINE: THE PRIMARY REASON 19
INTERNET USE: HOW OFTEN ARE YOU ONLINE? 19
INTERNET USE: ACROSS ALL AGE RANGES 20
WHAT LANGUAGE DO YOU USE ONLINE? 20
MEN AND WOMEN ONLINE 21
INCOME AND INTERNET USE 22
EDUCATION 22
HOW WOULD YOU RATE YOUR ABILITY TO USE THE INTERNET? 23
WHERE DO YOU USE THE INTERNET? 24
ELECTRONIC DEVICES 24
HOW DO YOU CONNECT TO THE INTERNET? 25
MODEM VS. BROADBAND: HOW LONG ONLINE? 25
NON-USERS: WHY NOT ONLINE? 26
ELECTRONIC DROPOUTS: WHY? 27
EXPERIENCES OF NON-USERS 27
NON-USERS: WILL YOU LOG ON SOON? 28
MEDIA USE AND TRUST 29
MEDIA USE 30
INTERNET USERS AND MULTI-TASKING 30
INTERNET USERS AND ONLINE MEDIA 31
TELEVISION: VIEWING DECLINES AMONG INTERNET USERS 32
THE INTERNET: AN IMPORTANT SOURCE OF INFORMATION? 33
THE INTERNET: HAS IT PEAKED AS A SOURCE OF ENTERTAINMENT? 34
MEDIA AND SEXUAL CONTENT 35
INFORMATION ON THE INTERNET: IS IT RELIABLE AND ACCURATE? 36
CONSUMER BEHAVIOR 37
HOW OFTEN DO YOU BUY ONLINE? 38
WHAT DO YOU BUY ONLINE? 39
HOW MUCH DO YOU SPEND ONLINE? 40
INTERNET PURCHASING: DOES IT AFFECT BUYING IN RETAIL STORES? 40
WHAT ITEMS ARE NOW PURCHASED LESS OFTEN IN RETAIL STORES? 41
CONSUMER BEHAVIOR (CONTINUED)
ARE PRICES ONLINE LOWER THAN TRADITIONAL RETAIL? 42
THE FIRST ONLINE PURCHASE: HOW LONG DID IT TAKE? 42
WHY SO LONG TO MAKE THE FIRST PURCHASE? 43
IS FACE-TO-FACE CONTACT IMPORTANT WHEN SHOPPING? 44
BUYING ONLINE: ARE YOU CONCERNED ABOUT YOUR PRIVACY? 44
“REMOTE” SPENDING: ONLINE VS. MAIL OR PHONE ORDERS 45
HOW DOES INTERNET BUYING AFFECT MAIL OR PHONE ORDERS? 45
DO YOU SHOP IN STORES, BUT THEN BUY ONLINE? 48
DO YOU SHOP ONLINE, BUT THEN BUY IN STORES? 48
CUSTOMER SERVICE: IS IT BETTER ONLINE? 49
RETURNING ONLINE PURCHASES 50
ONLINE BUYING: ARE BRAND NAMES IMPORTANT? 50
DO USERS SPEND MORE THAN THEY INTEND? 50
WILL USERS INCREASE THEIR ONLINE PURCHASING? 51
SALES TAX: WOULD IT AFFECT ONLINE PURCHASING? 52
FREE ONLINE SERVICES: WILL INTERNET USERS PAY FOR THEM? 52
CONCERNS ABOUT CREDIT CARD INFORMATION: A MAJOR PROBLEM 53
COMMUNICATIONS PATTERNS 55
E-MAIL: DOES IT HELP YOU REACH OUT TO OTHERS? 56
USERS AND E-MAIL ATTACHMENTS 58
E-MAIL: USERS STAY IN TOUCH 57
DOES E-MAIL TAKE TOO MUCH TIME? 58
MEETING PEOPLE: IS IT EASIER ONLINE? 59
DO YOU REVEAL PERSONAL DETAILS WHILE ONLINE? 60
DO YOU USE SCREEN NAMES WITH DIFFERENT PERSONALITIES? 61
SOCIAL AND PSYCHOLOGICAL EFFECTS 62
VIEWS ABOUT THE INTERNET 63
BELIEFS ABOUT THE INTERNET 63
PRIVACY 65
IS YOUR PRIVACY AT RISK WHEN YOU GO ONLINE? 65
MAINTAINING PRIVACY FROM PRIVATE BUSINESS AND GOVERNMENT 66
PRIVACY: WHO SHOULD BE RESPONSIBLE? 67
THE INTERNET, FAMILY, AND FRIENDS 68
HOUSEHOLD TIME TOGETHER 68
SOCIALIZING WITH FAMILY AND FRIENDS 69
DOES ONLINE EXPERIENCE AFFECT FAMILY ACTIVITIES? 69
IS THE INTERNET CHANGING WHAT USERS DO AT HOME? 70
ARE INTERNET USERS COMMUNICATING MORE WITH FAMILY AND FRIENDS? 71
DOES THE INTERNET INCREASE THE NUMBER OF PERSONAL CONTACTS? 71
SOCIAL AND PSYCHOLOGICAL EFFECTS (CONTINUED)
ONLINE FRIENDS: DO YOU MEET THEM IN PERSON? 72
VIEWS ABOUT FRIENDS 73
LIFE SATISFACTION 73
INTERNET USE AND FAMILY LIFE 74
CHILDREN AND THE INTERNET 75
WHERE DO CHILDREN USE THE INTERNET? 75
CHILDREN ONLINE AND TELEVISION: THE RIGHT AMOUNT OF TIME? 76
HAS INTERNET USE CHANGED CHILDREN’S TV VIEWING HABITS? 78
SCHOOL GRADES AND THE INTERNET 78
CHILDREN, THE INTERNET, AND INTERACTION WITH FRIENDS 79
DO YOU TELL YOUR PARENTS EVERYTHING YOU DO ONLINE? 80
ADULTS AND INTERNET MONITORING 80
INTERNET ACCESS: A PUNISHMENT TOOL? 81
POLITICAL POWER AND INFLUENCE 82
DOES THE INTERNET HELP WITH POLITICAL KNOWLEDGE? 82
IS THE INTERNET A TOOL TO HELP GAIN POLITICAL POWER? 82
CAN THE INTERNET GIVE USERS MORE SAY ABOUT THE GOVERNMENT? 82
CAN THE INTERNET HELP MAKE OFFICIALS CARE ABOUT USERS’ VIEWS? 82
POLITICAL AFFILIATION 83
THE INTERNET AT WORK 84
DO YOU USE THE INTERNET AT WORK? 84
DOES THE INTERNET AFFECT PRODUCTIVITY? 85
WHY DOES THE INTERNET AT WORK MAKE YOU LESS PRODUCTIVE? 85
CONCLUSIONS 86
ARE USERS SATISFIED OR DISSATISFIED WITH THE INTERNET? 87
HOW HAS COMMUNICATION TECHNOLOGY AFFECTED THE WORLD? 87
ISSUES AND TRENDS 88
SUPPLEMENT 1: THE UCLA CENTER FOR COMMUNICATION POLICY 91
SUPPLEMENT 2: THE WORLD INTERNET PROJECT – CONTACTS 92
SUPPLEMENT 3: RESEARCH METHODS 93
THE UCLA INTERNET REPORT: Surveying the Digital Future 12
The UCLA Internet Report 2001
Surveying the Digital Future
Year Two
Welcome to the report of Year Two of the UCLA Internet Project, “Surveying the Digital Future.”
The UCLA Internet Project is a comprehensive, year-to-year examination of the impact of online
technology on America. This work is part of the World Internet Project, which is organized and
coordinated by the UCLA Center for Communication Policy. Included in the World Internet Project are
UCLA’s work and partner studies in countries in Europe, the Middle East, South America, and Asia.
The second UCLA Internet Report continues to explore how the Internet influences the social, political, and
economic behavior of users and non-users. With the completion of the 2001 study, we are working on one
of the principal goals of the UCLA Internet Project: to compare the evolving responses of Internet users
and non-users over the years.
THE UCLA CENTER FOR COMMUNICATION POLICY:
EXPLORING THE IMPACT OF THE INTERNET
We created this project because the Internet represents the most important technological development of
our generation; its effects may surpass those of television and could someday rival those of the printing
press. Had research been conducted as television evolved in the late 1940s, the information would have
provided policy-makers, the media, and ultimately historians with valuable insights about how broadcasting
has changed the world.
Our objective is to ensure that the UCLA Internet Project and its yearly reports study online technology
and capitalize on the opportunity that was missed as television developed. By beginning our study of the
Internet early in its evolution as a worldwide communications and information-gathering tool, we can
understand the effects of the Internet as it grows, and not as a postscript after it has matured.
THE UCLA INTERNET REPORT: Surveying the Digital Future 13
To achieve this objective, The UCLA Internet Project surveys more than 2,000 households across America,
compiling the responses of Internet users and non-users. Each year we contact the same households to
explore how online technology affects the lives of those who are continuing Internet users, those who
remain non-users, and those who move from being non-users to users. We will also note changes as
continuing users move their Internet access from modem to broadband.
The UCLA Internet Project is not restricted to investigating a particular method of accessing the Internet.
As new types of access – such as wireless or methods yet unknown – become available, the project will
track them. The project is open to exploring the Internet in any form, and will monitor online technology as
it transforms in yet-unexpected ways.
WHY A COMPREHENSIVE REPORT ON THE INTERNET?
Other studies examine the Internet from a variety of viewpoints. The UCLA Internet Project differs from
most other studies in five principal areas:
n The UCLA Internet Project looks at the social impact of the Internet
Most Internet studies gathers data about who is online, how long they are online, and what they do online.
The UCLA Internet Project also compiles this information, but then examines the implications of the use of
online technology, and links this use to a broad range of attitudes and behavior. The UCLA study
comprehensively tracks a wide range of values, behavior, attitudes, and perceptions.
n The project focuses on Internet non-users as well as users
The UCLA Internet Project follows how the behavior and views of Internet users differ from those of non-
users. Especially important is noting changes in the behavior and views of individuals who are initially non-
users and later become users.
n Year-to-year data
The UCLA Internet Project comprehensively examines the effects of this communication technology over
the course of many years – ideally an entire generation. The research team maintains a core sample of
respondents, and tracks short-term and long-term changes in behavior, lifestyle, attitudes, and Internet use.
n A worldwide effort
The UCLA Center for Communication Policy created and organizes the World Internet Project, which
includes the UCLA Internet Project and similar studies in countries worldwide (for contacts at many of the
worldwide partners, see page 92). Through this team of international partners, the World Internet Project
studies and compares changes associated with the Internet in different countries and regions, creating an
international picture of evolving change in online technology and use.
THE UCLA INTERNET REPORT: Surveying the Digital Future 14
n A principal goal of the UCLA Internet Project is to engage government and private industry
decision-makers who can create policy based on our findings
For this project to be truly effective, we involve public and private organizations that are committed to
using our results. We organized an unprecedented alliance of corporations – several of which are direct
competitors – and foundations, including the National Science Foundation, America Online, Microsoft,
Disney, Sony, Verizon, Pacific Bell, DirecTV, Hewlett-Packard, Merrill Lynch, Accenture, and the National
Cable Television Association.
THE UCLA INTERNET PROJECT: KEY AREAS
The 2001 UCLA Internet Project includes findings that compare Internet users to non-users, new users
(less than one year online) to very experienced users (five years or more online), and users within different
demographic groups.
The Survey is organized into five general subject areas:
n Internet Users And Non-Users: Who Is Online? Who Is Not? What Are Users Doing Online?
n Media Use And Trust
n Consumer Behavior
n Communication Patterns
n Social And Psychological Effects
The 2001 UCLA Internet Report includes a broad sampling of more than 100 major issues from this year’s
survey. We hope you will be enlightened by these findings in year two of “Surveying the Digital Future,” as
we work to understand how the Internet is transforming our world.
Jeffrey I. Cole, Ph.D.
Director, UCLA Center for Communication Policy
Founder and Organizer, World Internet Project
THE UCLA INTERNET REPORT 2001
Surveying the Digital Future
YEAR TWO
THE UCLA INTERNET REPORT: Surveying the Digital Future 16
INTERNET USERS AND NON-USERS
WHO IS ONLINE? WHO IS NOT?
WHAT ARE USERS DOING ONLINE?
Who is using the Internet in 2001? How do online experiences of new users (less than one year using the
Internet) differ from those of very experienced users (five or more years on the Internet)? Why do non-
users stay off of the Internet?
The 2001 UCLA Internet Project leaves little doubt that the Internet is now a mainstream activity in
American life that continues to spread among people across all age groups, education levels, and incomes:
n The UCLA Internet Project found that 72.3 percent of Americans are
online in 2001, up from 66.9 percent in 2000.
n Users in 2001 go online about 9.8 hours per week, up from 9.4 hours per
week in 2000.
The majority of Americans have access to the Internet, and that access continues to grow. Who, then, is
going online, and who is not? And, how are Americans using the Internet?
THE UCLA INTERNET REPORT: Surveying the Digital Future 17
INTERNET ACCESS AND USE: 2000 AND 2001
Who is using the Internet? Where do users access it? What services do they use?
The 2001 UCLA Internet Report found continuing growth in use of the Internet; more than 70 percent of
Americans have access to the Internet in 2001.
INTERNET ACCESS
2000 2001
n Total Americans who use the Internet 66.9% 72.3%
n % of students who use the Internet at school 55.3% 64.3%
n % of employed who use the Internet at work outside the home 42.3% 51.2%
THE TOP FIVE MOST POPULAR INTERNET ACTIVITIES (PERCENT OF INTERNET USERS)
1. E-mail and instant messaging 81.6% 87.9%
2.Web surfing or browsing 81.7% 76.3%
3. Buying online 50.7% 48.9%
4.Finding entertainment information 54.3% 47.9%
5.Reading news 56.6% 47.6%
ONLINE SPENDING PER MONTH (PERCENTAGE OF PURCHASERS ONLY)
n $0-$15 21.5% 36.2%
n $15-$175 59.8% 55.4%
n $175+ 18.7% 8.4%
THE UCLA INTERNET REPORT: Surveying the Digital Future 18
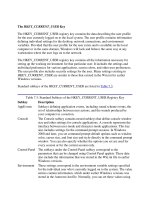
NEW USERS VS. VERY EXPERIENCED USERS: WHAT DO THEY DO ONLINE?
In both the 2000 and 2001 UCLA Internet Projects, one of the most revealing findings compares the
online activities of new users (less than one year online) with those of very experienced users (five or more
years in 2001, four or more years in 2000).
Very experienced Internet users spend a larger proportion of time online sending e-mail, doing professional
work, looking for news, or trading stocks. New Internet users spend a greater proportion of their time
visiting chat rooms, playing games, and browsing online.
The largest differences between new users and very experienced users are participating in chat rooms
(accessed much more by new users) and doing professional work (done far more by experienced users).
Usage patterns in both the 2000 and 2001 surveys show that a new divide is emerging: the difference
between how those with several years of experience and those with little experience online actually use the
Internet.
6.5%
16.1%
5.7%
5.1% 5.2%
2.7%
3.0%
2.0%
3.3%
22.1%
2.9%
0.9%
3.4%
2.7%
1.6%
12.6%
2.8%
3.8%
4.2%
2.7%
3.8%
2.8%
4.3%
23.5%
4.5%
3.1%
6.1%
8.2%
0%
5%
10%
15%
20%
25%
Activities on the Internet
Percent of Time Online
New Users (<1 Year) Very Experienced Users (5 or More Years)
Chat
Rooms
Browsing
Games
Entertainment
Info
Medical
Info
Job
Search
School
Work
Download
Music
Shopping
Trading
Stocks
Banking
News
Professional
Work
THE UCLA INTERNET REPORT: Surveying the Digital Future 19
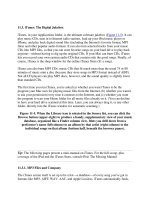
GOING ONLINE: THE PRIMARY REASON
What do users say is the primary reason they started to use the Internet? At the top of the list of reasons is
obtaining information quickly, followed by work needs, and access to e-mail.
INTERNET USE: HOW OFTEN ARE YOU ONLINE?
As in the 2000 study, the 2001 UCLA Internet Project found that the more experience users have with the
Internet, the more time they spend online. With each additional year of Internet experience, users’ time
online grows; very experienced users are online almost twice as long as new users.
Worth noting is the amount of time that even the new Internet users are online: an average of 6.5 hours
per week in the 2001 survey, up from 6.1 hours per week in 2000. Internet users – even new ones –
acquire this time from hours previously devoted to some other activity.
For more about how the time users spend on various activities is changing, see page 30.
6.5
7.5
8.8
11.1
13.2
0
2
4
6
8
10
12
14
< 1 1 to <2 2 to <4 4 to <5 5 or More
Years of Internet Experience
Average Hours per Week
25.0%
11.6%
10.6%
9.3%
8.8%
4.6%
4.5%
3.8%
3.1%
19.0%
0%
10%
20%
30%
To Get
Information
Quickly
For
Work
To Get
It Seemed
To Be New
and
Interesting
For
School
My
Friends
To Learn
More about
Things
That
Interest Me
To be
Up-to-
Date
Was
Given
Access
Other
Primary Reason Began Using the Internet
Percent of Respondents
THE UCLA INTERNET REPORT: Surveying the Digital Future 20
INTERNET USE: ACROSS ALL AGE RANGES
The 2001 survey, as well as the survey in 2000, found that Internet use is not dominated by young people.
Respondents aged 18 and under account for only 15.1 percent of Internet users. Users span all age ranges,
with 60.6 percent in the 26-55 age range.
WHAT LANGUAGE DO YOU USE ONLINE?
In the United States, the predominant language of the Internet is English. Of those whose primary
language online is English, 7.3 percent report also using a language on the Internet other than English.
More than half of online use not in English is conducted in Spanish, and slightly less than one-quarter is in
French.
8.1%
7.0%
8.8%
20.2%
21.8%
18.6%
9.6%
5.9%
0%
10%
20%
30%
40%
< 16 16 - 18 19 - 25 26 - 35 36 - 45 46 - 55 56 - 65 > 65
Age
Percent of Respondents
51.2%
24.5%
12.9%
1.9%
5.9%
4.9%
24.5%
0%
20%
40%
60%
Spanish French German Russian Japanese Chinese Other
Percent of Respondents
(Multiple responses permitted)
THE UCLA INTERNET REPORT: Surveying the Digital Future 21
MEN AND WOMEN ONLINE
Almost equal numbers of men and women use the Internet.
In most age ranges (see chart below) Internet use is about equal among men and women.
93.0%
98.3%
81.3%
80.0%
78.4%
76.2%
66.7%
34.2%
88.1%
99.0%
80.7%
83.5%
76.8%
53.2%
29.2%
80.9%
0%
20%
40%
60%
80%
100%
< 16 16 - 18 19 - 24 25 - 35 36 - 45 46 - 55 56 - 65 > 65
Percent of Respondents
Male Female
Age
71.1%
63.6%
70.7%
74.3%
0%
20%
40%
60%
80%
100%
Male Female
Gender
Percent of Respondents
2000
2001
THE UCLA INTERNET REPORT: Surveying the Digital Future 22
INCOME AND INTERNET USE
In 2001, as in 2000, in general the higher the income, the higher the proportion of those who use the
Internet. And those with higher incomes have been online longer than those with lower incomes.
EDUCATION
The 2000 and 2001 surveys found increases in Internet use among those at all education levels. And, for
both years, the higher the education level achieved by respondents, the more likely they use the Internet.
The very highly educated have correspondingly high levels of use. However, the largest growth rates from
2000 to 2001 were among those with some college (9.1 percent increase) and those with a high school
degree only (5.6 percent increase).
4.6
6.8
7.4
9.5
7.2
4.8
6.9
7.1
10.1
9.9
0
2
4
6
8
10
12
$1 -
$30,000
$30,001 -
$50,000
$50,001 -
$80,000
$80,001 –
$100,000
> $100,000
Income Level
Average Hours per Week
2000
2001
60.4%
53.8%
70.3%
86.3%
86.1%
64.9%
59.4%
79.4%
88.8%
89.2%
0%
20%
40%
60%
80%
100%
< High
School
High School
Graduate
Some
College
College
Graduate
Advanced /
Prof Degree
Education Level
Percent of Respondents
2000
2001
THE UCLA INTERNET REPORT: Surveying the Digital Future 23
HOW WOULD YOU RATE YOUR ABILITY TO USE THE INTERNET?
As expected, confidence using the Internet grows as experience grows; 81.9 percent of users with five or
more years of experience say their Internet abilities are good or excellent, compared to 40.1 percent of
users with less than one year of experience.
The survey also found that overall confidence in using the Internet has grown (see chart below). In the
2001 survey, 65.5 percent of all users say their ability to use the Internet is good or excellent, up
substantially from the 44.6 percent who responded the same way in 2000.
28.4%
27.1%
30.2%
14.4%
6.6%
27.9%
41.8%
23.7%
0%
20%
40%
60%
Poor
Fair
Good
Excellent
Internet Ability
Percent of Internet Users
2000
2001
15.9%
44.0%
33.0%
7.1%
2.5%
15.6%
42.9%
39.0%
0%
10%
20%
30%
40%
50%
Poor Fair Good Excellent
Internet Ability
Percent of Respondents
New Users (<1 Year) Very Experienced Users (5 or More Years)
THE UCLA INTERNET REPORT: Surveying the Digital Future 24
WHERE DO YOU USE THE INTERNET?
Not surprisingly, the home remains the primary point of access to the Internet for most people. In 2001,
users report the most hours online at home, followed by work, and then school.
ELECTRONIC DEVICES
Internet users own much more electronic technology than non-users.
Equal percentages of users and non-users own televisions, and slightly higher numbers of users own VCRs.
However, much higher percentages of users than non-users own electronic devices in every other major
category.
6.0
3.7
2.2
0.4
0.3
0.2
0.1
0
2
4
6
8
At Home At Work At School At Friend's or
Relative’s Home
Via Wireless
Devices
At Public
Library
Other
Access Locations
Hours per Week
85.2%
17.3%
49.9%
74.3%
97.2%
31.2%
78.0%
38.0%
26.2%
23.1%
3.4%
26.7%
88.8%
10.8%
18.0%
6.0%
11.7%
99.4%
40.0%
98.6%
0%
20%
40%
60%
80%
100%
Computers
PDAs
Video Game
System
Cell
Phones
Televisions
VCRs
DVD
Players
Printers
Scanners
Digital
Camera
Types of Technology
Percent of Respondents
Internet Users Internet Non-users
THE UCLA INTERNET REPORT: Surveying the Digital Future 25
HOW DO YOU CONNECT TO THE INTERNET?
Most households with Internet access still connect to online service with a telephone modem. Even though
telecommunications companies are now aggressively marketing cable modems and DSL, access by
telephone modem declined only 6.8 percent in 2001.
Access by cable modem also grew slightly, and DSL use grew substantially in 2001 – but up from a very
low level in 2000.
MODEM VS. BROADBAND: HOW LONG ONLINE?
Even though – or perhaps because – access to the Internet with broadband is much faster than access with
a telephone modem, Internet users with broadband at home go online 3.2 hours more per week than
Internet users who connect with a telephone modem.
7.1
10.3
0
2
4
6
8
10
12
Telephone Modem Broadband
Connection Types
Internet Hours per Week
88.1%
8.0%
3.9%
1.2% 0.6%
0.1%
2.6%
81.3%
11.5%
1.7%
0.5% 0.4%
2.3%
3.7%
0%
20%
40%
60%
80%
100%
Telephone
Modem
Cable
Modem
Web TV DSL ISDN Satellite Other
Internet Access Connections
Percent of Respondents
2000 2001