Effect of sludge processing mode, soil texture and soil ph on metal mobility in undisturbed soil columns
Bạn đang xem bản rút gọn của tài liệu. Xem và tải ngay bản đầy đủ của tài liệu tại đây (912.39 KB, 20 trang )
Eect of sludge-processing mode, soil texture and soil pH on metal
mobility in undisturbed soil columns under accelerated loading
B.K. Richards
a,
*, T.S. Steenhuis
a
, J.H. Peverly
b
, M.B. McBride
c
a
Department of Agricultural and Biological Engineering, Riley-Robb Hall, Cornell University, Ithaca, NY 14853, USA
b
Department of Agronomy, Purdue University, West Lafayette, IN 47907, USA
c
Department of Crop and Soil Sciences, Brad®eld Hall, Cornell University, Ithaca, NY 14853, USA
Received 17 May 1999; accepted 8 September 1999
Abstract
The eect of sludge processing (digested dewatered, pelletized, alkaline-stabilized, composted, and incinerated), soil type and
initial soil pH on trace metal mobility was examined using undisturbed soil columns. Soils tested were Hudson silt loam (Glossaquic
Hapludalf) and Arkport ®ne sandy loam (Lamellic Hapludalf), at initial pH levels of 5 and 7. Sludges were applied during four
accelerated cropping cycles (215 tons/ha cumulative application for dewatered sludge; equivalent rates for other sludges), followed
by four post-application cycles. Also examined (with no sludge applications) were Hudson soil columns from a ®eld site that
received a heavy loading of sludge in 1978. Romaine (Lactuca sativa) and oats (Avena sativa) were planted in alternate cycles, with
oats later replaced by red clover (Trifolium pratense). Soil columns were watered with synthetic acid rainwater, and percolates were
analyzed for trace metals (ICP spectroscopy), electrical conductivity and pH. Percolate metal concentrations varied with sludge and
soil treatments. Composted sludge and ash had the lowest overall metal mobilities. Dewatered and pelletized sludge had notable
leaching of Ni, Cd and Zn in Arkport soils, especially at low pH. Alkaline-stabilized sludge had the widest range of percolate metals
(relatively insensitive to soils) including Cu, Ni, B and Mo. Old site column percolate concentrations showed good agreement with
previous ®eld data. Little leaching of P was observed in all cases. Cumulative percolate metal losses for all treatments were low
relative to total applied metals. Leachate and soil pH were substantially depressed in dewatered and pelletized sludge soil columns
and increased for alkaline-stabilized and ash treatments. # 2000 Elsevier Science Ltd. All rights reserved.
Keywords: Sewage sludge; Trace metals; Preferential ¯ow; Metal mobility; Leaching
1. Introduction
Reuse of municipal wastewater sludge via land appli-
cation recycles the organic matter (which improves soil
physical characteristics) and nutrients in the sludge.
Reuse is, howeve r, complicated by the low but still sig-
ni®cant levels of contaminants present in the sludge. Of
these, trace metals have received the most attention to
date. The risks of human, crop and/or environmental
toxicity posed by these elements are a function of their
mobility and availability.
Sludges can be processed by a variety of methods to
reduce sludge mass, volume, odors and/or pathogen
viability. In an earlier article (Richards et al., 1997) we
showed that the mode (drying, composting, alkaline
stabilization, or incineration) by which dewatered
sludge was processed signi®cantly aected not only
trace element concentrations but also their in vitro
leachability, as determined by the Toxicity Character-
istic Leaching Procedure (TCLP; USEPA, 1992a).
Using these same sludge products, Theis et al. (1998)
found metal concentrations in leachat e from these pro-
ducts followed the pattern of: alkaline-stabilized>dried
pellets>dewatered sludge>incinerated ash>composted.
Attention has been given to the eects of processing
mode on availability of N (Misselbrooke et al., 1996;
Shepherd, 1996) and P (Frossard et al., 1996; Wen et al.,
1997), as also summarized in the recent reviews by
Krogman et al. (1997, 1998).
Soil pH and soil texture play important roles in con-
trolling trace metal mobility, with most metals (in free
0269-7491/00/$ - see front matter # 2000 Elsevier Science Ltd. All rights reserved.
PII: S0269-7491(99)00249-3
Environmental Pollution 109 (2000) 327±346
www.elsevier.com/locate/envpol
* Corresponding author. Tel.: +1-607-255-2463; fax: +1-607-255-
4080
E-mail address: (B.K. Richards).
ionic form) being most mobile in acidic, coarse-textured
soils (McBride, 1994). Solubility and plant uptake of Cd
and Zn were greater from a non-limed sludge than from
a lime-stabilized sludge (Basta and Sloan, 1999). Acid
forest soils with lower total Cd concentrations than
agricultural nevertheless had far greater soluble Cd con-
centrations due to lower pH levels (Ro
È
mkens and Salo-
mons, 1998). Mob ility can, however, also be signi®cant
at circumneutral or higher pH due to metal complexation
with dissolved organic matter (DOM) which itself
becomes more solubl e at those pH levels. As a result,
alkaline-stabilized sludge products have been shown to
have TCLP extractabilities of 25±50% of total Cu, Ni
and Mo (Richards et al., 1997), with similar results for
water extractabilities (McBride, 1998). Organic and
inorganic colloids have been shown to accelerate the
subsurface mobility of many contaminants (McCarthy
and Zachara, 1989) particularly where DOM levels are
elevated and contaminants have a high anity for the
mobile colloids. Xiao et al. (1999) report ed ash/sludge
mixtures as having elevat ed DOM concentrations that
increased trace metal leachability, and Jordan et al.
(1997) found increases in Pb solubility in the presence of
DOM. Lamy et al. (1993) observed DOM facilitation
of Cd mobility following sludge application.
Substantial de®cits of applied sludge-borne meta ls are
apparent for many ®eld studies reporting mass balances
(or when balances are performed on reported data).
These studies are summarized by McBride et al. (1997)
and Richards et al. (1998). More recently, Baveye et al.
(1999) concluded that from 36 to 60% of applied metals
were lost in the experimental sludge app lication plots of
Hinesly et al. (1984), even when total soil dissolution
was employed to ensure soil metal recovery. Tillage
dispersion or incomplete analytical recovery may
account for some of the shortfall in applied metals in
some cases (McGrath and Lane, 1989; Chang et al.,
1984). These factors are not applicable in all cases, and
researchers, assuming soil metal immobility, are often
forced to conclude that reported applications were
incorrect (Baxter et al., 1983; Streck and Richter, 1997).
Leaching losses of metals have been cited as a potential
(if unlikely) mechanism of loss (McGrath and Lane,
1989; Dowdy et al., 1991). Leaching losses are often
ruled out due to lack of observable increases in subsoil
metals concentrations (Baxter et al., 1983), but we have
recently demonstrated that metal leaching is not neces-
sarily accompanied by detectable subsoil readsorption
within 1.5 m depth (Richards et al., 1998). Barbarick et
al. (1998) did detect increases in subsoil Zn despite lim-
ited soil moisture regime (dryland wheat), and Brown et
al. (1997) noted subsoil increases in several metals.
Duncomb et al. (1982) reported little signi®cant
increase in soil solution metal concentrations at depths
of 60 and 150 cm following repeated sludge applica-
tions. Jackson et al. (1999) reported little increases in
soil solution concentrations at 10 cm depth from sludge/
ash applic ations. However, these and other studies used
ceramic cup lysimeters for water sampling which have
been shown to absorb trace metals from samples
(McGuire et al., 1992; Wenzel et al., 1997). Preferential
¯ow paths in the soil are also likely to be missed by
suction cup lysimeters (Boll, 1995), or may be altered
by installation procedures such as packing with slurried
soil (Jacks on et al., 1999).
USEPA (1992b) predicted very limited potential for
leaching of sludge-borne trace metals, but the risk
assessment utilized a very narrow data base, and was
based on modeling approaches that excluded organic-
facilitated transport and that assumed conventional
uniform ¯ow through homogenous soil and aquifer
strata. Preferential ¯ow through soil macropores or via
®ngering phenomena has been shown to result in greater
mobilities (Kung, 1990; Steenhuis et al., 1995, 1996)
than would be predicted by co nventional uniform ¯ow
models for a range of contaminants. Camobreco et al.
(1996) reported that conventionally packed soil columns
(which force uniform water ¯ow) were overly optimistic
about soil metal retention capacity when compared to
more realistic undisturbed soil columns that preserve
preferential ¯ow paths. In contrast, most soil column
studies reporting metal immobility utilized conventional
packed soil columns (Welch and Lund, 1987).
The goal of the present study was to use 90 undis-
turbed soil columns to determine the eects of sludge-
processing mode, initial soil pH and soil texture on the
short- and long-term mobility of metals and nutrients.
The sludge products (detailed in Richards et al., 1997)
used in the study were all derived from the same sludge
feedstock to allow valid comparison of processing
eects. This article reports observed percolate pH, con-
ductivity and soluble metals concentrations as well as
soil pH trends.
2. Experimental approach
The primary experiment (Table 1) exami ned two soils
(coarse vs. ®ne textured) with no prior history of sludge
application. Five sludge productsÐconsisting of de-
watered digested sludge and four sludge products derived
from it via co mposting, alkaline stabilization, drying
and pelletization and incinerationÐwere applied to the
soils. Initial soil pH levels were adjusted to low (pH 5)
and circumneutral (pH 6.5±7) levels. No-sludge controls
were operated at low and neutral pH levels, and addi-
tional `natural control' columns were operated with no
pH adjustments or nutrient additions to provide an
absolute `no additions' baseline. All treatments were
examined using triplicate columns.
A third soil, an `old site' ®ne-textured soil with a
history of sludge application, was used for a series of
328 B.K. Richards et al. / Environmental Pollution 109 (2000) 327±346
controls at low, neutral, natural and high (>7) pH
levels. No additional sludge was applied to these col-
umns. The columns were used to: (1) compare column
leachate results with those from in situ passive wick
lysimeters installed in the original ®eld plots; and (2)
observe the eects of altering soil pH on residual metals
present in the soil.
In all cases, undisturbed soil columns were used to
better simulate ®eld soil conditions by preserving nat-
ural preferential ¯ow paths. Accelerated cropping and
leaching cycles were used, with sucient simulated acid
rain applied during each 3-month cropping cycle to
result in a calendar year's volume of percolate.
2.1. Source soil descriptions
Soil columns were extracted in the summer of 1993
from college farmland adjacent to the Cornell campus
in Ithaca, NY. All soils had similar elevation and slope
aspect (level or slight northward slope), and all were
essentially free of rocks or gravel, simplifying both ®eld
extraction and management in the greenhouse. All sites
were downwind and within approximately 1 km of the
coal-®red University steam plant.
The ®ne-textured soil was Hudson silt loam (®ne,
illitic, mesic, Glossaquic Hapludalf), thought to be
lacustrine in origin, with a silt loam epipedon (surface
horizon) underlain by a silty clay loam subsoil.
Mean horizon depths were A
p
15 cm, E 25 cm and BE
to column depth. Soil cores were excavated from a ®eld
used as unimproved pasture for at least the past 25
years. The coarse-textured soil was an Arkport ®ne
sandy loam (coarse loamy, mixed, mesic, active, Lamellic
Hapludalf), presumably a small deltaic deposit. The
sandy loam topsoil (A1 to 12 cm mean depth, A2 to 25
cm) was underlain by a variety of subsoil horizons: ®ne
sand, loamy sand and silty sand. The Arkport area was
about 0.3 km from the Hudson site, and was similarly
used as long-term unimproved pasture. Thirty-nine
cores were taken from each of these sites.
The old site soil columns were excavated from an
experimental sludge application plot in the Cornell
Orchards, on Hudson silt loam soils that were in fact
contiguous with the pasture from which the other
Hudson columns were taken. Sludge was applied to
the plot (previ ously an old apple orchard) in 1978 in
a single heavy loading (244 tons/ha nominal rate).
Following several years of experimental row crop-
ping, the site was plowed and dwarf apple trees were
planted in 1986. Site history and soil characteristics
are discussed in greater detail elsewhere (McBride et
al., 1997; Richards et al., 1998). Mean horizon depths
were A
p
25 cm (with inclusions of blocks of B
resulting from deep tillage), B1 to 30 cm and B2 to
column depth. Wick lysimeters were installed in 1993
to monitor percolate metal concentrations as report-
ed in Richards et al. (1998). Twelve soil cores
were concurrently extracted from the perimeter of
the excavation pit dug for installation of the wick
lysimeters.
Table 1
Controlled application soil column study experimental matrix, showing number of columns assigned to each treatment of sludge and pH
Sludge and pH treatments Soil type
Sludge type Initial soil pH Arkport sandy loam Hudson silt loam Old site Hudson
1. Digested dewatered 5 3 3 ±
73 3 ±
2. Composted 5 3 3 ±
73 3 ±
3. Alkaline-stabilized (N-Viro) 5 3 3 ±
73 3 ±
4. Dried and pelletized 5 3 3 ±
73 3 ±
5. Incinerated ash 5 3 3 ±
73 3 ±
6. Control 5 3 3 3
73 3 3
Natural 3 3 3
7+ ± ± 3
Total of each soil type 39 39 12
Total soil columns 90
B.K. Richards et al. / Environmental Pollution 109 (2000) 327±346 329
2.2. Soil columns
Whereas the old site columns were dug from the per-
iphery of the wick lysimeter pit in the Orchards sludge
plot, column extraction of the other two soil types was
facilitated by the use of a back hoe to excavate long
trenches. Columns were then hand-excavated along the
edges of these trenches. A column of soil (28 cm dia-
meter and 35 cm deep) was exposed by carefully exca-
vating surrounding soil. The soil pro®le of each column
was described in the ®eld, and soil samples from the
periphery of each column were taken in accordance with
the horizonation. A 35 cm length of 30-cm ID corru-
gated black polyethylene culvert was placed over the
column, and minimal -expansion foam (commercially
available ``Great Stu'' polyurethane) was injected
into the gap between the soil column and culvert
and allowed to cure overnight. The column was
then removed by digging under the column. Excess
soil was removed from the base of the column, and the
base was carefully `picked' to remove any smeared soil
to ensure that ¯ow paths would be intact.
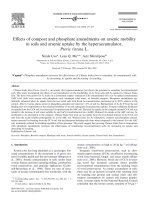
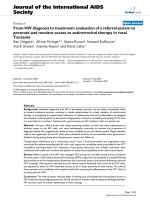
Each column was placed on a support base (Fig. 1),
with a central drain hole. The column rested on two
1.2-m diameter circles of black polyethylene ®lm, which
were drawn up and secured around the column. A circle
of foam padding (2 cm thick) under the black plastic
ensured contact between the plastic and the base soil.
To direct leachate towards the central drain hole, a
ridge of 1.3-cm thick foam weatherstripping was placed
around the outer edge of the foam base, and radial
notches were cut into the foam base. PVC ®ttings
threaded together through the drain hole both secured
the plastic ®lm to the base an d provided a water-tight
seal. Leachate was directed through plastic tubing con-
nected to the elbow to a polyethylene storage jug, with
both tubing and jug darkened to retard algal growth.
Individual reservoirs (3.3 l volume) were ®lled weekly
to dispense water to each soil column. The water ap-
plied for each cropping cycle was designed to result in
approximately 30 cm depth of percolate, the typical
recharge rate for this area. In order to moderate the rate
of in¯ow to each column, each reservoir was ®tted with
a constant-head device a nd a short piece of narrow dia-
meter tubing to serve as an in-line ¯ow restrictor. A
network of short ®berglass wicks was used to distribute
the ¯ow evenly across the soil surface of each column.
Synthetic acid rain was used (Table 2; sulfate was inad-
vertantly 20% lower than 4.96 mg/l target), prepared
each week by diluting a 10000Â concentrate with de-
ionized water. A 500-l polyethylene central mixing tank
and pump were used for mixing and distributing the
water to the column reservoirs.
Column extraction records and soil pro®les were
examined to determine the variability of soil character-
istics between columns. This was done to assure that
column varia bilities were equally represented in the
various treatment s to be examined. For the 39 Hudson
soil columns there were no notable dierences between
columns other than a normal variation in horizon
depths. Replicates were assigned on the basis of location
within the ®eld (one rep licate each from middle, left and
right sides of the excavation area). The 39 coarse-
textured Arkport soil columns were similarly assigned
on the basis of ®eld location. Being a deltaic deposit,
variation of subsoil characteristics was more marked
across the ®eld. However, assignment on the basis of
®eld location well distributed this variation. Columns in
one end of the ®eld (assigned to the ®rst replicate of
each treatment) general ly had a thin silty subsoil horizon
Fig. 1. Soil column system and column cross-section.
Table 2
Arti®cial rainwater ionic composition (T.L. Theis, 1993, personal
communication)
a
Ion Conc. (mg/l)
Na
+
0.15
NH
4
+
0.32
K
+
0.09
SO
4
2À
3.96
b
Ca
2+
0.83
NO
3
À
2.88
Mg
2+
0.08
Cl
À
0.47
a
Approximate pH 4±4.5.
b
Sulfate inadvertently lower than 4.96 mg/l target concentration.
330 B.K. Richards et al. / Environmental Pollution 109 (2000) 327±346
absent in the other two replicates. The 12 columns
extracted from the Cornell Orchards old site were
grouped into three categories: (1) columns with visible
dark veins of organic matter in the A
p
horizon due to
incomplete tillage of sludge when applied; (2) columns
with thin B1 horizons; and (3) all other columns. One
column from each of these three categories was assigned
to each treatment so that any eects due to initial col-
umn conditions would be evenly represented in each
treatment.
Columns were stored indoors, sparingly watered to
prevent desiccation, and covered with black plastic
to kill weeds. Columns were placed in the greenhouse
in summer of 1994. To prevent eects due to location
within the greenhouse (which had a cross¯ow ventila-
tion pattern), the greenhouse was divided into three
areas, with one replicate of each treatment assigned to
each area. Column locations within each replicate's
designated area in the greenhouse were randomly
determined. The upper 10 cm of soil was carefully hand-
tilled in preparation for pH adjustment and sludge
incorporation. Once ¯ow systems were installed and
hand-tilling was complete, several initial leachings with
synthetic acid rain were performed.
In August 1994, additions of lime (reagent grade
CaCO
3
) or acid (0.5 N H
2
SO
4
) were made to adjust soil
pH levels of the upper 10 cm to target initial levels.
Additions were made incrementally and iteratively over
a period of several weeks, based on lime requirement
and acid titration analyses and resulting soil pH levels.
Cumulative lime additions (g CaCO
3
/column) for col-
umns assigned to an initial pH of 7 were 26.8 (Hudson),
24.8 (Arkport) and 55.0 (old site Hudson). Addition
rates for high pH old site Hudson columns were 182.5 g/
column. Acid additions (meq/column) for columns
assigned to an initial pH of 5 were 435 meq (old site
Hudson) and 138 meq (Hudson). Initial pH levels of
Arkport soils were suciently low so that no acid addi-
tions were necessary for low pH conditions. Following
pH adjustment, three more leachings were carried out.
Prior to cropping cycle 8, columns in pH 7 treatments
were restored to near pre-Cycle 1 pH levels by lime addi-
tions, while low pH treatments were not adjusted in order
to simulate unmanaged conditions. Lime addition rates
for pH 7 pellets, compost and control columns were 26.8
(Hudson) and 24.8 (Arkport) g/column. For pH 7 de-
watered sludge treatments, addition rates were 53.6
(Hudson) and 49.6 (Arkport) g/column. Additions for old
site Hudson high pH columns were 182.5 g/column. No
additions were needed for N-Viro or ash columns.
2.3. Sludge characteristics
Historically, comparisons of dierent sludge products
are weakened by the fact that the sludge feedstock for
each process diers in composition. A signi®cant eort
(coordinated by the New York State Energy Research
and Development Authority) was thus made to ensure
direct comparability of the various sludge processes by
producing all products from the same sludge feedstock.
The sludge products used were thus all derived from
dewatered digested sludge produced during a single day
(16 May 1994) at the Onondaga County wastewater
treatment facility in Syracuse, NY. The dewatered
digested sludge (DW) produced at the plant was the
feedstock for the other processes and was itself used in
the study. Composted sludge (COM) was obtained by
shipping 30 tons of the dewatered sludge to Lockport,
NY, where it was mixed with virgin wood chips, com-
posted and cured for several months in a munici pal
composting facility. Dried sludge pellets (PELL) were
obtained by pelletizing and drying several hundred
kilograms of sludge in a pilot-scale mill at Clarkson
University (Potsdam, NY). Incinerated sludge ash (ASH)
was produced by incinerating over 50 metric tons (wet
wt.) in a multiple hearth furnace at Monroe County's
Northwest Quadrant facility (Rochester, NY). Alkaline-
stabilized sludge (NV; N-Viro
TM
process) was obtained
from the Waste Stream Environmental facility at the
Onondaga County wastewater plant. Detailed processing
information and analyses, including TCLP extractability,
have been summarized elsewhere (Richards et al., 1997).
Sludge composition and cumulative loadings are
summarized in Table 3. Application rates of the various
sludge prod ucts were normalized to the amount of
dewatered sludge dry matter initially present in each
process, with the goal being equal loading rates of
sludge-derived metals. Normalization factors (g product
TS per g initial DW TS) were based on total solids for
pellets, nonvolatile solids for ash, reported amendment
ratios for N-Viro and reported wood chip additions and
estimated biodegradation for compost.
A three-phase sludge loading program was followed
(Table 4). During Phase 1, columns were given agro-
nomic (i.e. typical N-based) sludge loadings of 7.5 tons/
ha (DW sludge-equivalent) per cycle for two application/
cropping cycles (Cycles 1 and 2). The only exception
was that the Cycle 2 N-Viro applications for high pH
columns were deferred to and added to the Cycle 3
application. Phase 2 consisted of two heavy loading
cycles (Cycles 3 and 4) of 100 tons/ha DW sludge each,
to rapidly attain cumulative metals loading in the soil to
simulate long-term applications. This phase allowed
rapid attainment of a cumulative metals content in soil
equivalent to 28 years at the 7.5 tons/ha rate (cumula-
tive DW sludge loading rate of 215 tons/ha). Although
these heavy loading rates were obviously much higher
than agronomic rates, they were still in the range of
single-application loadings used for land reclamation.
During Phase 3 no additional sludge was applied, but
cropping and leaching cycles were continued to observe
long-term post-application eects.
B.K. Richards et al. / Environmental Pollution 109 (2000) 327±346 331
Sludge was added to the mixed topsoil layer (pre-
viously hand-tilled to 10 cm depth) at the beginning
of each application/cropping cycle (Cycles 1±4). The
mixed layer was carefully excavated to the original
10 cm depth and mixed in a polyethylene tub. A
soil sample was then taken, preweighed masses of
sludge were added and the soil and sludge were
thoroughly mixed. The soil/sludge mixture was then
returned to the soil column and ®rmly presse d into
place. Any large roots or plant residues in the col-
umns were placed on top of the exposed subsoil in
the column prior to returning the soil. The same
excavation and mixi ng procedure was used to obtain
soil samples in subsequent post-application cropping
cycles.
2.4. Crops and watering
Crops were grown on the soil columns to: (1) provide
an index of phytoavailability and/or phytotoxicity via
crop response (to be reported in subsequent publica-
tions); (2) better simulate ®eld conditions by maintain-
ing an active rhizosphere in the soil and allowing root
growth to open and maintain preferential ¯ow paths;
and (3) provide a more realistic pattern of soil moisture
content and percolation rates over the cropping cycle
(percolation during early growth and after harvest but
little or no percolate during mid-cycle). Relatively short-
season, shallow-rooted crops were grown in alternate
cropping cycles (Table 4). Oats (Avena sativa var. Ogle;
used in Cycles 1, 3 and 5) represent a ®eld crop that is
Table 3
Sludge product cumulative total solids and elemental loadings per column
Sludge product Dewatered Pellets Composted N-Viro Ash
Sludge loading
Normalization factor 1 1 1.1 3 0.45
Dry matter (g/column) 1300 1352 1524 4064 599
Dry matter (tons/ha) 212 221 249 663 98
Metals loadings (kg/ha)
Ca 9020 8360 9670 215 620 10 290
Cd 1.19 1.05 1.42 1.05 0.35
Cr 27.6 30.2 29.7 26.7 21.3
Cu 124 117 134 79 119
Fe 14 390 12 950 15 330 9570 11 230
K 255 457 261 1450 416
Mg 1270 1330 1340 7990 1660
Mn 72.0 120.3 77.5 162.4 81.3
Mo 6.13 4.73 7.09 3.78 5.39
Na 155 135 163 228 213
Ni 7.59 8.08 8.38 8.41 7.30
P 5700 5130 6110 3240 7020
Pb 28.0 27.1 30.1 NA
a
14.1
S 3360 2450 3430 5610 1040
Zn 116 114 125 76 94
a
Direct analysis not available due to spectral interference. Estimated rate 28±30 kg/ha.
Table 4
Undisturbed soil column system: operation summary
a
Cycle Dates Weekly
waterings
Loading rate
tons/ha (DW sludge)
Crop Total nutrients added (number of equal additions in brackets)
0 7/94±10/94 4 none (pre-application) None None
1 11/94±2/95 15 7.5 Oats ASH, CTRL: 40 kgN/ha NV, COM: 19 kgN/ha (1)
2 4/95±7/95 16 7.5 Romaine ASH, CTRL: 120 kgN/ha PELL: 63 kgN/ha COM, NV: 100 kgN/ha (5)
3 9/95±12/95 13 100 Oats ASH, CTRL: 40 kgN/ha (1)
4 1/96±4/96 12 100 Romaine 80 kgN/ha (ASH, CTRL) (2)
5 5/96±8/96 12 0 Oats None
6 1/97±3/97 12 0 Romaine 80 kgN/ha (ASH, CTRL) (2) 80 kgK/ha (all but NCTRL) (1)
7 10/97±1/98 16 0 Red clover None
8 4/98±7/98 12 0 Romaine None
a
DW, dewatered digested sludge; ASH, incinerated sludge ash; CTRL, control; NV, alkaline-stabilized sludge; COM, composted sludge; PELL,
dried sludge pellets.
332 B.K. Richards et al. / Environmental Pollution 109 (2000) 327±346
relatively indierent to trace metals in terms of uptake
and/or phytotoxicity. In Cycle 7 and following, oats
were replaced by red clover (Trifolium pratense), a
common hay/forage crop that exhibits a degree of sen-
sitivity to soil metals. Romaine (or Cos) lettuce (Lactuca
sativa var. Parris Island) was used in even-numbered
cycles. Supplemental N was added to columns (as
Ca(NO
3
)
2
solution to Cycle 5 and as NH
4
NO
3
solution
in Cycle 6) during Cycles 1±6 to maintain target total
available N levels of 80±120 kg/ha for romaine and 40
kg/ha for oats. K was added (as KCl solution) at 80 kg/
ha for all but natural pH control columns in Cycle 6.
Crops were harvest ed at 11±14 weeks after seeding,
representing the `green chop' harvest stage for oats and
clover, and maturity for romaine.
Columns were watered weekly during cropping cycles
by ®lling the reservoirs previously described. Percolate
was collected and sampled 2±3 days after watering, by
which time all percolation had ceased. During any
extended idle periods between cropping cycles, columns
were covered with aluminum foil, and limited amounts
of deionized water (up to 0.5 l/week) were applied to
columns as needed to keep columns from desiccating.
However, additi ons were limited so that percolate
would not be produced between cycles. Supplemental
lighting was used to extend day lengths by 4±8 h during
fall and winter months, but was in general minimized to
prevent excessive evaporation/transpiration rates. The
greenhouse was lightly whitewashed in summer to help
control temperatures and reduce ventilation require-
ments. Additional circulation fans were used to mini-
mize temperature variations within the greenhouse.
2.5. Analytical
Soil samples (collected as described above) were air-
dried at 55
C. Fine roots and other plant matter were
removed, and the samples were ground in a porcelain
mortar and pestle, sieved through a 16-mesh plastic
screen to remove any coarse fragments (all soils were
largely free of stones and pebbles), and stored in poly-
ethylene bags. Soil pH was determined in 1:1 soil/
distilled water suspensions, mixed at 0 and 0.5 h and
measured at 1 h. Reference electrode errors were
reduced by placing the reference electrode in the super-
natant above the settled soil suspension during
measurement.
Percolate was collected weekly during operating
cycles. Percolate volumes are expressed as depth (cm) of
percolate (volume divided by the surface area of the soil
columns). Total percolate mass was determined by
weighing collection jugs in the greenhouse, and 125-m l
subsamples were taken. Electrical conductivity (EC) and
pH analysis was typically carried out either immedi-
ately, or within 24 h, and 35-ml subsamples were frozen.
Mass-weighted monthly composite samples for metals
analysis were produced from these frozen subsamples.
During Cycles 6±8, the monthly composite samples were
again proportionally composited to form a single sam-
ple for each column that represented percolate from the
entire cropping cycle. Samples were agitated during
collection and were vortex-mixed at each stage of the
compositing process. Samples were ®ltered through
coarse acid-washed cellulose ®lters (Fisher Scienti®c Q8,
10 mm porosity), and ®ltrates were analyzed for metals
and other elements via inductively coupled argon
plasma (ICP) spectroscopy using a Thermo-Jarrell-Ash
Model 975 ICP unit at Cornell University's Nutrient
Analysis Laboratory. All results are expressed as the
mean and standard deviation of the triplicate co lumns
for each treatment.
At the end of Cycle 5 the percolate collection jugs
were rinsed with 30 ml of 4 M HCl to test for potential
metal deposition in the jugs. Rinsates were digest ed at
80
C for 16 h. A representative subsampling of 10 col-
umns with detectable percolate metals losses as of Cycle
5 were analyzed via ICP spectroscopy after ®ltration
with coarse acid-washed cellulose ®lters. The mass of
metals recovered were compared with cumula tive per-
colate metals losses as of the end of Cycle 5. Similarly,
the drainage tubing of four columns (old site Hudson,
and Arkport soil dewatered sludge, NV, and natural
control treatments) was replaced at the end of Cycle 7.
The original tubing was scraped and acid-rinsed (4 M
HCl) to remove a dark brown plaque-like coating. Rin-
sates were digested at 80
C for 16 h, ®ltered and ana-
lyzed via ICP spectroscopy. Metals recovered were
compared with cumulative percolate metals losses as of
the end of Cycle 8 .
Statistical testing of the signi®cance of observed
eects was limited by the substantial interaction of
independent variables (sludge treatments with soil pH).
In view of this and the ongoing nature of the study,
conclusions were limited to readily observable trends.
3. Results
This paper presents percolate results and soil pH
levels observed during the ®rst eight cropping cycles of
this ongoing study. Primary comparisons are among
sludge products, soil types and initial pH levels. Com-
parisons are also made between old site Hudson soil
and Hudson control soils.
3.1. Percolation rates
Percolation ratesÐexpressed as mean weekly depth
(cm/week)Ðvaried markedly over the course of each
cropping cycle, decreasing steadily and, in many cases,
ceasing as transpiration increased as a result of crop
growth. Following harvest, percolation would resume
B.K. Richards et al. / Environmental Pollution 109 (2000) 327±346 333
once soil moisture levels recovered. Mean weekly per-
colate depth (cm/wk) for the Arkport soils (Fig. 2) were
typically greater than for the Hudson soils during active
crop growth. This was a resul t of the ®ner Hudson soil's
higher water-holding capacity, which enabled the Hud-
son soil columns to retain and store a larger fraction
of applied water, reducing percolate volumes. Arkport
columns with signi®cant crop yields often began exhibi-
ting signs of water stress at the end of each weekly
watering cycle, whereas this rarely occurred with Hud-
son soils. Treatments with lower crop yields (particu-
larly controls) tended to have correspondingly greater
percolate masses. Variation in percolation rates between
cropping cycles was the result of a number of factors,
including crop, temperatures of greenhouse and venti-
lation air, humidity and amount of supplemental light-
ing, all of which aected the rate of transpiration and
thus percolation. In most cases, percolation rates were
50±150% of the target of 30 cm per cycle, equivalent to
the mean annual recharge rate in New York State. Old
site Hudson column percolation rates (Fig. 3) tended to
be greater than comparable controls due to lower crop
yields.
3.2. Percolate EC
EC values, used as an index of solution concentra-
tions, were summarized as volume-weighted means for
Fig. 2. Hudson and Arkport column percolate depth (cm) and electrical conductivity (EC) (ms/cm), grouped by soil and initial soil pH. Sludge
treatments: *, dewatered digested sludge (DW); *, composted sludge (COM); !, alkaline-stabilized sludge (NV); !, dried sludge pellets (PEL);
&, incinerated sludge ash (ASH); &, control; ^, natural control.
Fig. 3. Old site Hudson (OS) and Hudson control (H) column percolate depth (cm) and electrical conductivity (EC) (ms/cm), plotted by soil and
initial pH: *, OS5; *, OS7; !, OS natural; !, OS>7; &, H5; &, H7; ^, H natural.
334 B.K. Richards et al. / Environmental Pollution 109 (2000) 327±346
each cropping cycle (Fig. 2). Dewatered sludge caused
the largest increases in EC, followed closely by pellets,
N-Viro and compost. Ash had relatively little eect on
percolate EC. The peaks during Cycles 3 and 6 were not
attributable to the nutrient solution additions made to
the columns, since the natural control columns were
given no nutrient supplementation and showed relative
increases similar to the columns. The increases seem to
be associated with the extended idle periods immedi-
ately preceding both cycles. Examination of weekly EC
results (data not shown) show that levels were elevated
at the beginning of these cycles, and steadily declined
for all treatments. It is possible that the interim water-
ings that preceded each cycle translocated salts, making
them available for rapid leaching once regular full
waterings resumed. Old site column percolate EC varied
markedly over time (Fig. 3), apparently due to the inter-
cycle idle periods prior to Cycle 3 and 6 discussed
above. Levels were greater than controls, but were well
below levels observed in the newly sludge-applied
columns.
3.3. Percolate pH
Percolate pH results for the Hudson and Arkport
soils varied markedly with treatment and time (Fig. 4).
For Hudson columns, heavy sludge loadings in Cycles 3
and 4 resulted in sharp decreases in percolate pH for
columns loaded with dewatered and pelletized sludges.
This likely resulted from oxidation of loaded S and N
(supported by percolate S data presented later), both of
which are strongly acidifying reactions. Percolate pH
levels were still recovering as of Cycle 8. Compost
depressed percolate pH slightly, and ash had little eect.
N-Viro resulted in delayed increases in percolate pH.
Cycles 5±8 saw a slight downward trend in percolate pH
for most treatments, possibly due to gradual eects of
the acid rain application. Arkport soil, being more
poorly buered, saw steeper declines in percolate pH for
dewatered and pelletized sludge, reaching levels as low
as pH 4.0. Compost depressed pH more signi®cantly
than in the Hudson columns, and increases due to N-
Viro did not occur until Cycle 7. There was no apparent
eect of the pre-Cycle 8 lime additions to pH 7 columns
except for slight increases in Cycle 8 percolate pH for
the Arkport compost and control columns. Old site
Hudson column (Fig. 5) percolate pH values generally
remained in a narrow range from pH 6.0 to 6.5 despite
dierences in soil pH treatments.
3.4. Soil pH
Soil pH (Fig. 4) was determined on samples taken
initially (prior to any adjustment in soil pH) and at the
end of each cropping cycle. Dewatered sludge columns
saw pH levels decline somewhat during agronomic
Fig. 4. Hudson and Arkport soil column percolate pH and soil pH, grouped by soil and initial soil pH. Sludge treatment: *, dewatered digested
sludge (DW); *, composted sludge (COM); !, alkaline-stabilized sludge (NV); !, dried sludge pellets (PEL); &, incinerated sludge ash (ASH);
&, control; ^, natural control.
B.K. Richards et al. / Environmental Pollution 109 (2000) 327±346 335
sludge loadings (Cycles 1 and 2), followed by substantial
declines resulting from the heavy loadings of Cycles 3
and 4. The decline continued through Cycle 6. The
depression in pH was again attributed to N and S oxi-
dation. The pH levels of 4.5±4.8 as of the end of Cycle 6
may have been buered against further declines by the
organic matter present. Compost applications had a
much less dramatic eect on pH levels, with low pH
columns actually increasing to over pH 5.5 by Cycle 6.
High pH columns declined to 5.6±6.0. Increases in Cycle
8 in pH 7 columns were due to lime reapplications.
Pellets had pH trends similar to compost. It should be
noted that at the end of Cycle 8 many pellets were still
largely intact: soil-coated but ®rm and black-colored
inside, which may explain why soil pH eects were not
more similar to those of dewatered sludge. N-Viro
raised all soil pH levels to 7 by the end of Cycle 2 and
over pH 8 by Cycle 3. Slight dierences among soil
pH treatments remained until Cycle 5, but by the end
of Cycle 8 all treatments were between pH 8.0 and
8.3, which is approximately the maximum pH that a
carbonate-dominated system in equilibrium with atmos-
pheric CO
2
can sustain. Ash exerted an alkaline eect
on soils, although less dramatic than N-Viro. Control
columns showed a steady decline throughout the study
as a result of the synthetic acid rainfall. By the end of
Cycle 7, the Hudson and Arkport pH 7 controls had
nearly returned to their pre-adjustment levels, indicating
that the initial lime additions had nearly been con-
sumed. Hudson natural and low pH controls declined to
4.6±4.7 by the end of Cycle 6, with Arkport natural and
low pH controls slightly lower. The slight increases seen
in Cycle 7 levels may have been linked to overall lower
percolate volumes during the cycle.
Old site soil columns (Fig. 5) showed substantial buf-
fering capacity in their resistance to acid or lime addi-
tions during pH adjustment, with the low pH treatment
rebounding to pH 6 in Cycle 1 and the high pH treat-
ment reaching only pH 6.8. Over the course of the
cropping cycles the high pH and pH 7 treatments con-
verged at circa pH 6.7 while the natural control an d low
pH treatments converged at pH 5.8.
3.5. Percolate metals
The initial leaching (carried out prior to any pH
adjustment or sludge application) resulted in little or no
detectable metals in Hudson or Arkport soil percolates
(Table 5). Percolate metal concentrations (volume-
weighted means) for the entire Cycles 1±8 sequence are
summarized in Table 6. Time-series plots of mean per-
colate concentrations of most analytes are presented in
Figs. 6±11. Graphs have similar y-axis scaling to facil-
itate comparisons among soil treatments.
Percolate concentrations of Cu (Fig. 6) were greatest
for N-Viro treatments, mirroring the pattern (although
not the magnitude) of short-term mobilities observed in
TCLP testing of sludge. (N-Viro TCLP mobilities wer e
50, 43 and 24% of total metals for Mo, Cu and Ni,
respectively.) Concentrations peaked between 0.3 and
0.65 mg/l following the heavy loadings of Cycles 3
and 4, decreasing below 0.1 mg/l by Cycle 8. As dis-
cussed elsewhere (Richards et al., 1997), this is likely
due to transport of Cu±organic complexes mobilized by
organic matter dissolution resulting from elevated pH.
All other sludge treatments had peak concentrations
below 0.05 mg/l, and overall mean concentrations below
0.025 mg/l.
Fig. 5. Old site Hudson (OS) and Hudson control (H) soil column percolate and soil pH, plotted by soil type and initial soil pH: *, OS5; *, OS7;
!, OS natural; !, OS>7; &, H5; &, H7; ^, H natural.
Table 5
Initial baseline leaching ICP analysis results, mean values (as mg/l) for
each group of soil columns
Element Hudson Arkport
Ag nd
a
nd
Cd nd nd
Cr nd nd
Cu nd nd
Mo nd nd
Ni nd nd
P 1.31 1.10
Pb nd nd
Zn 0.005 0.001
a
nd, Not detected.
336 B.K. Richards et al. / Environmental Pollution 109 (2000) 327±346
Table 6
Hudson (H) and Arkport (A) soil column mean percolate concentrations for Cycles 1±8 (mg/l)
a
Sludge pHi B Ca Cd Cr Cu K Mg Mn
HAH A HAHAHAHAH A HA
DW 5 m 0.161 0.081 362 248 0.001 0.004 0.025 0.021 0.010 0.013 31.8 8.6 56.2 35.9 2.13 6.24
sd 0.007 0.011 9 12 0.000 0.001 0.002 0.002 0.002 0.001 6.8 1.5 3.8 3.2 0.41 2.05
7 m 0.178 0.079 353 285 0.001 0.002 0.025 0.021 0.012 0.011 28.4 7.8 50.3 34.4 1.52 3.46
sd 0.050 0.009 15 37 0.001 0.000 0.001 0.003 0.001 0.002 10.1 2.3 5.3 3.7 0.70 0.77
COM 5 m 0.232 0.079 163 128 0.001 0.001 0.018 0.015 0.018 0.019 19.5 5.3 33.1 21.9 0.05 0.15
sd 0.025 0.011 2 20 0.000 0.000 0.001 0.002 0.002 0.002 5.7 1.0 2.1 4.3 0.02 0.04
7 m 0.184 0.092 162 149 0.001 0.001 0.016 0.015 0.016 0.017 19.5 7.0 26.7 19.1 0.08 0.15
sd 0.022 0.008 11 16 0.000 0.000 0.000 0.000 0.003 0.003 7.2 2.9 2.1 0.0 0.07 0.00
NV 5 m 0.290 0.242 278 223 0.001 0.002 0.023 0.021 0.112 0.120 40.7 9.4 49.5 37.5 0.16 1.15
sd 0.016 0.004 17 25 0.001 0.000 0.002 0.003 0.030 0.015 14.5 1.2 4.2 1.9 0.04 0.47
7 m 0.285 0.255 303 256 0.001 0.001 0.023 0.020 0.081 0.151 34.8 9.3 55.3 33.0 0.05 0.84
sd 0.051 0.005 34 12 0.000 0.000 0.004 0.002 0.015 0.021 18.2 2.2 10.3 0.5 0.01 0.40
PELL 5 m 0.197 0.064 276 150 0.001 0.003 0.022 0.016 0.017 0.024 31.3 10.3 41.1 20.0 1.28 3.86
sd 0.032 0.005 33 31 0.000 0.001 0.001 0.002 0.001 0.003 5.0 2.0 1.4 5.3 0.34 0.73
7 m 0.230 0.066 295 181 0.001 0.002 0.020 0.014 0.018 0.019 33.1 8.2 38.4 17.2 0.78 3.41
sd 0.032 0.006 11 29 0.000 0.001 0.002 0.004 0.004 0.003 22.1 1.8 7.1 3.5 0.28 0.88
ASH 5 m 0.239 0.099 110 65 0.001 0.001 0.013 0.008 0.011 0.008 18.0 3.2 23.5 10.0 0.07 0.06
sd 0.029 0.008 8 12 0.000 0.000 0.001 0.002 0.001 0.002 3.9 0.7 1.2 1.1 0.05 0.01
7 m 0.217 0.103 90 65 0.001 0.001 0.010 0.007 0.009 0.006 21.5 6.7 16.0 8.3 0.02 0.03
sd 0.019 0.009 4 5 0.000 0.000 0.001 0.001 0.001 0.001 10.5 4.4 0.9 0.7 0.00 0.00
CTRL 5 m 0.148 0.037 56 26 0.001 0.001 0.008 0.005 0.009 0.008 14.5 2.2 10.9 3.9 0.03 0.07
sd 0.032 0.006 6 3 0.000 0.000 0.002 0.000 0.001 0.002 2.8 1.0 1.5 0.2 0.01 0.07
7 m 0.178 0.063 54 37 0.001 0.001 0.008 0.006 0.012 0.010 19.6 3.0 10.1 4.8 0.02 0.11
sd 0.061 0.011 13 4 0.000 0.000 0.001 0.001 0.002 0.003 4.5 1.3 3.5 0.3 0.00 0.11
Nat m 0.179 0.051 48 24 0.001 0.001 0.007 0.006 0.010 0.008 18.7 1.7 9.4 3.2 0.02 0.03
sd 0.033 0.006 4 2 0.000 0.000 0.001 0.001 0.001 0.001 6.1 0.3 0.9 0.1 0.00 0.00
Mo Na Ni P Pb S Zn
HAH A HAHAHAHAH A
DW 5 m 0.001 0.002 7.92 6.00 0.009 0.095 0.765 0.360 0.001 0.004 115.7 65.1 0.108 0.204
sd 0.000 0.000 0.39 0.30 0.002 0.029 0.102 0.030 0.001 0.002 4.4 2.5 0.026 0.096
7 m 0.002 0.002 7.66 6.24 0.011 0.054 0.557 0.365 0.002 0.003 105.9 80.8 0.068 0.060
sd 0.001 0.000 0.86 0.09 0.002 0.006 0.095 0.027 0.001 0.000 5.7 13.4 0.007 0.025
COM 5 m 0.002 0.002 6.25 4.43 0.006 0.025 0.828 0.299 0.003 0.005 86.5 52.2 0.011 0.019
sd 0.000 0.000 0.23 0.36 0.002 0.006 0.213 0.046 0.001 0.002 2.9 5.5 0.001 0.006
7 m 0.003 0.002 6.01 4.65 0.006 0.035 0.577 0.248 0.002 0.004 81.4 55.8 0.010 0.023
sd 0.001 0.000 0.25 0.40 0.002 0.010 0.219 0.048 0.000 0.000 5.0 3.0 0.003 0.007
NV 5 m 0.012 0.009 10.22 8.01 0.022 0.062 0.532 0.382 0.002 0.005 118.2 113.3 0.014 0.012
sd 0.003 0.005 0.24 0.66 0.010 0.015 0.058 0.086 0.001 0.001 18.7 16.1 0.006 0.004
7 m 0.011 0.013 10.88 8.32 0.015 0.059 0.578 0.363 0.002 0.005 117.2 109.2 0.011 0.017
sd 0.001 0.005 1.35 0.14 0.001 0.021 0.124 0.025 0.001 0.001 7.9 9.5 0.003 0.006
PELL 5 m 0.002 0.003 7.08 4.78 0.009 0.068 1.100 0.370 0.002 0.006 108.4 64.1 0.051 0.053
sd 0.001 0.001 0.59 0.51 0.002 0.009 0.222 0.065 0.000 0.003 17.4 15.6 0.006 0.018
7 m 0.002 0.002 7.16 4.77 0.009 0.079 0.882 0.342 0.001 0.004 102.8 70.0 0.031 0.056
sd 0.000 0.000 1.36 0.60 0.003 0.029 0.241 0.056 0.000 0.001 15.2 4.7 0.010 0.040
ASH 5 m 0.003 0.003 5.07 2.33 0.005 0.007 0.547 0.538 0.003 0.006 64.9 35.5 0.012 0.010
sd 0.001 0.001 0.23 0.02 0.001 0.002 0.053 0.369 0.000 0.001 10.5 3.0 0.003 0.002
7 m 0.007 0.002 4.30 2.39 0.003 0.004 0.457 0.243 0.003 0.005 55.3 36.2 0.007 0.007
sd 0.002 0.001 0.18 0.19 0.000 0.000 0.073 0.056 0.001 0.001 1.7 4.7 0.000 0.001
(Table 6 continued on next page)
B.K. Richards et al. / Environmental Pollution 109 (2000) 327±346 337
Ni percolate concentrations (Fig. 6) varied strongly
with soil type. For Hudson soils, the only notable Ni
mobility came from N-Viro (again mirroring TCLP
results) during Cycle 4, with greater concentrations
observed from the pH 5 columns. Arkport soils had
markedly greater concentrations beginning with Cycle
3. In the low pH columns, dewatered sludge, pellets and
N-Viro had the greatest concentrations, peaking in
Cycle 4. Compost treatment percolates peaked in Cycle
4 at levels far lower than the other treatments but
equivalent to the greatest concentrations observed for
Hudson soils. For pH 7 columns, dewatered sludge
concentrations were lower while peak N-Viro and
pelletized sludge percolate concentrations were similar
to pH 5 levels. Compost followed a pattern similar to
the pH 5 columns.
Cd concentrations (Fig. 7) were near lower detec-
tion limits for all Hudson soils, but showed increases
in percolates from Arkport soils applied with de-
watered and pelletized sludge products during heavy
loadings in Cycles 3 and 4. Zn varied greatly with
soil type and pH. In Hudson soils, dewatered sludge
had the greatest percolate concentrations, reaching
0.24 mg/l in Cycle 4 for the low pH soil, and
decreasing somewhat in Cycle 5. Pelletized sludge Zn
concentrations were approximately one half of de-
watered sludge levels. However, concentrations from
the dewatered sludge treatments reached 0.7 mg/l in
low pH Arkport columns, although those from pelle-
tized sludge were similar to Hudson soil results.
Levels in the pH 7 columns were also similar to the
Hudson pH 7 columns.
Table 6 (continued)
Mo Na Ni P Pb S Zn
HAH A HAHAHAHAH A
CTRL 5 m 0.002 0.002 2.90 1.47 0.004 0.005 0.521 0.326 0.003 0.007 20.5 5.1 0.009 0.007
sd 0.001 0.000 0.61 0.06 0.001 0.002 0.145 0.057 0.000 0.002 3.4 1.4 0.002 0.001
7 m 0.002 0.002 3.29 2.03 0.005 0.010 0.948 0.240 0.004 0.007 9.9 9.9 0.009 0.008
sd 0.000 0.001 0.11 0.36 0.001 0.002 0.602 0.037 0.000 0.001 2.0 4.0 0.001 0.002
Nat m 0.002 0.002 3.14 1.66 0.004 0.006 0.781 0.258 0.003 0.008 10.4 5.1 0.009 0.009
sd 0.001 0.000 0.23 0.09 0.000 0.001 0.157 0.075 0.001 0.001 1.0 0.3 0.001 0.002
a
DW, dewatered digested sludge; COM, composted sludge; NV, alkaline-stabilized sludge; PELL, dried sludge pellets; ASH, incinerated sludge
ash; CTRL, control; m, mean; sd, standard deviation.
Fig. 6. Hudson and Arkport soil column percolate Cu and Ni. Sludge treatments: *, dewatered digested sludge (DW); *, composted sludge
(COM); !, alkaline-stabilized sludge (NV); !, dried sludge pellets (PEL); &, incinerated sludge ash (ASH); &, control; ^, natural control.
338 B.K. Richards et al. / Environmental Pollution 109 (2000) 327±346
Fig. 7. Hudson and Arkport soil column percolate Cd and Zn. Sludge treatments: *, dewatered digested sludge (DW); *, composted sludge
(COM); !, alkaline-stabilized sludge (NV); !, dried sludge pellets (PEL); &, incinerated sludge ash (ASH); &, control; ^, natural control.
Fig. 8. Hudson and Arkport soil column percolate B and Mo. Sludge treatments: *, dewatered digested sludge (DW); *, composted sludge
(COM); !, alkaline-stabilized sludge (NV); !, dried sludge pellets (PEL); &, incinerated sludge ash (ASH); &, control; ^, natural control.
B.K. Richards et al. / Environmental Pollution 109 (2000) 327±346 339
Fig. 9. Hudson and Arkport soil column percolate P and S. Sludge treatments: *, dewatered digested sludge (DW); *, composted sludge (COM);
!, alkaline-stabilized sludge (NV); !, dried sludge pellets (PEL); &, incinerated sludge ash (ASH); &, control; ^, natural control.
Fig. 10. Hudson and Arkport soil column percolate K and Na. Sludge treatments: *, dewatered digested sludge (DW); *, composted sludge
(COM); !, alkaline-stabilized sludge (NV); !, dried sludge pellets (PEL); &, incinerated sludge ash (ASH); &, control; ^, natural control.
340 B.K. Richards et al. / Environmental Pollution 109 (2000) 327±346
B concentrations (Fig. 8) were greatest during initial
leachings, possibly due to aerial deposition of B from
the University coal-®red heating plant, which was
upwind of the ®elds from which the soils were extracted.
Concentrations decreased steadily, stabilizing by Cycle
4 for all treatments but N-Viro. B concentrations from
N-Viro columns increased steadily from Cycles 3 to 5,
reaching 0.5 mg/l in Arkport soils, slightly higher than
Hudson soils. Mo concentrations increased from Cycle
3 for all N-Viro treatments, reaching 0.03 mg/l for
Hudson soil treatments. Increases in Arkport soils were
delayed until Cycle 6, when levels began increasing
steeply, with large variability among triplicates. Ash
also had elevated Mo concentrations in Hudson soil
columns, particularly in the pH 7 columns.
P concentrations (Fig. 9) declined over the course of
operation. The greatest concentrations observed during
the heavy loadings were from pelletized sludge on Hud-
son soils, but concentrations were generally indis-
tinguishable from control levels. Percolate S were
elevated in pH 5 Hudson soils due to acid additions
during pH adjustments (not needed by pH 5 Arkport
columns due to low initial pH levels). Concent rations
from all sludge treatments increased during the Cycle 3
and 4 heavy loadings, exceeding 100 mg/l. All levels
declined subsequently, with levels persisting in Arkport
soil N-Viro columns.
K concentrations (Fig. 10) declined steadily for all
control columns, although initial concentrations were
greatest in Hudson columns. During Cycles 3 and 4,
K concentrations increased for all sludge products.
Increases in Hudson column percolates were greatest for
dewatered sludge, N-Viro and pellets (peaking between
40 and 60 mg/l) but were small for compost and ash.
Levels were lower in Arkport soils but concentrations
followed the same relative pattern. High initial levels of
Na mirrored results seen with B, declining steadily in all
control columns, again suggesting a uniform deposition
source while soils were still in the ®eld. Concentrations
stabilized in all controls during Cycles 4 and 5. Slight
increases in percolate Na were observed from ash addi-
tions for both Hudson and Arkport soils. Concentra-
tions in dewatered, pellets, compost and N-Viro
treatments peaked during Cycle 4, and declined in Cycle
5, although N-Viro levels declined more slowly.
Ca percolate concentrations (Fig. 11) followed pat-
terns that, for a given soil type, were similar for both pH
levels. For Hudson soils, concentrations increased from
dewatered sludge columns to approximately 600 mg/l
for Cycles 3±5. Concentrations were nearly as great
from pellets and N-Viro. High Ca concentrations from
the N-Viro percolates are due to the substantial Ca
loadings. However, in the case of dewatered sludge and
pellets, it is unknown how much of the Ca leached ori-
ginated from the sludge itself and how much was mobi-
lized from the soil due to the strong acidi®cation that
took place as a result of heavy loadings, as evidenced by
percolate and soil pH levels. Compost additions resulted
Fig. 11. Hudson and Arkport soil column percolate Ca and Mg. Sludge treatments: *, dewatered digested sludge (DW); *, composted sludge
(COM); !, alkaline-stabilized sludge (NV); !, dried sludge pellets (PEL); &, incinerated sludge ash (ASH); &, control; ^, natural control.
B.K. Richards et al. / Environmental Pollution 109 (2000) 327±346 341
in increases to 300 mg/l percolate Ca by Cycle 4. In
Arkport soils, Ca concentrations from dewatered sludge
peaked in Cycle 3. N-Vir o results were similar to that
seen with Hudson soils, but pelletized sludge additions
resulted in percolate Ca concentrations that were
substantially lower, similar to composted sludge. Ash
results were similar to Hudson soils. Baseline control
levels in the pH5 and natural control treatments
continued to decline, falling below 25 mg/l. Mg con-
centrations followed a pattern similar to Ca, although
concentrations were about one-®fth of those seen with Ca.
Percolate Cr concentrations were low at approxi-
mately 0.02 mg/l for all sludge-treated columns except
ash, with levels of 0.01 mg/l for ASH and control col-
umns (Table 6). Pb concentrations were near lower
instrumental detection limits. Mn concentrations were
greatest for soil columns treated with dewatered and
pelletized sludges, followed by N-Viro treatments. Con-
centrations were greater from Hudson soils than from
Arkport soils.
Percolate concentrations for the old site Hudson col-
umns (Figs. 12 and 13) showed no clear time-related
trends for most elements. B, K and Na did follow the
trend observed in the Hudson and Arkport co ntrol col-
umn percolates, indicating leaching of apparently aeri-
ally deposited material s. Despite apparent trends
toward lower Cu, Ni and Zn concentrations in the
highest soil pH treatment, analysis of varia nce per-
formed on mean results from Cycles 1 to 5 (data not
shown) found that the old site soil pH treatments had
no signi®cant eect ( p=0.05) on percolate concentra-
tions. The only exception was S, which was elevated in
the low pH treatment simply due to sulfuric acid addi-
tions during pH adjustment. When all old site columns
were considered as a single treatment, mean concentra-
tions of all analytes were signi®cantly dierent from the
Hudson control percolates during Cycles 1±5 , as deter-
mined by analysis of variance ( p=0.05). Unlike all
other analytes, P concentrations were greater in the
control percolates.
For all treatments tested, metals recovered by the
acid-rinsing of the percolate collection jugs were less
than 1% of the cumulative percola te losses except for P
and Pb. P recoveries ranged up to 1.4% of cumulative
losses for Hudson soil columns. Pb recoveriesÐwhich
were lowÐnevertheless represented up to 3.5% of per-
colate losses for Hudson and Arkport columns, and up
to 10% for old site Hudson treatments, possibly a result
of transport of a small amount of lead arsenate-con-
taminated topsoil (from old orchard pesticide sprays)
through the column.
The acid-washing and digestion of plaque lining the
drain tubing of four columns yielded variable results.
Recoveries for the dewatered sludge- and N-Viro-
treated columns were less 2.2% of cumulative Cycles 1±
8 percolate losses except for Cr recoveries, which were
4±4.8% of percolate losses. Mass recoveries from the
Arkport natural control were similar. Old site column
Fig. 12. Old site Hudson (OS) and Hudson control (H) soil column percolate Cu, Ni, Cd, Zn, B and Mo, plotted by soil and initial soil pH: *, OS5;
*, OS7; !, OS natural; !, OS>7; &, H5; &, H7; ^, H natural.
342 B.K. Richards et al. / Environmental Pollution 109 (2000) 327±346
recoveries were below 2% of percolate losses except for
a 9.3% Pb recovery.
4. Discussion
The sludge application experiment demonstrated that
the mode of sludge processing, soil type and initial soil
pH strongly aected metal mobility. The sludge loading
rates used were, by design, much heavier than agro-
nomic use would dictate over the time frame of the
experiment. The heavy loadings were used to build soil
metal contents to levels corresponding to approximately
30 years of agronomic applications. Cumulative dry
matter loading rates for dewatered sludge, pellets and
compost were, also, similar in magnitude to rates used
for land reclamation (Sopper, 1993). However, due to
the low metal contents of the sludge products used,
metals loading rates were substantially lower than
recommended loading limits associated with land recla-
mation. The loading rates used in this study (using the
greatest rate among sludge products in Table 3) ranged
from 9 (Cr, Pb) to 74% (Zn) of the recommended max-
imum loading rates for reclamation of land to be used
as farmland reported in Sopper (1993). Loading rates
were also substantially below the cumulative Part 503
loading limits (USEPA, 1993), ranging from 1 to 10%
of limits for all elements shown in Table 7 but Mo.
Loadings were 39% of the previous Mo limit (subse-
quently withdrawn by USEPA). Dry matter loadings
were approximately one-third of the cumulative load-
ings used by Dowdy et al. (1991), and on the same order
of magni tude as those used by Chang et al. (1984).
The use of normalization factors (Table 3) ensured
that elemental loading rates were comparable among
sludge products, only diering signi® cantly when pro-
cessing resulted in large elemental additions (Ca, Mg
and K in additives for N-Viro stabilization) or selective
losses (such as Cd volatilization during incineration).
The equal relative loading rates do not, however, repre-
sent equivalent agronomic time frames. The loadings
of dewatered sludge, pellets and compost simulated
approximately 30 years of agronomic applications. In
contrast, the 663 tons/ha cumulative loading of N-Viro,
intended for use as a lime substitute, is probably closer
to several hundred years of ®eld applications (which are
texture- and initial pH-speci®c), as re¯ected in the ele-
vated soil pH levels observed. (Logan et al., 1997a,
observed a similar soil pH after 500 tons/ha loadings).
Ash would not normally be used for land application,
and would in this case be prohibited due to Mo con-
centrations exceeding Part 503 ceiling limits (Richards
et al. 1997).
Aside from the expected eects of heavy N-Viro
applications, the extreme depression of pH by de-
watered sludge was more pronounced than anticipated.
With a high Ca sludge loaded at rates similar to this
study, Logan et al. (1997b) observed only a one unit
Fig. 13. Old site Hudson (OS) and Hudson control (H) soil column percolate P, S, K, Na, Ca and Mg, plotted by initial soil pH: *, OS5; *, OS7;
!, OS natural; !, OS>7; &, H5; &, H7; ^, H natural.
B.K. Richards et al. / Environmental Pollution 109 (2000) 327±346 343
decrease in soil pH in a well-buered soil over the
course of several years, followed by a gradual recovery.
However, Harrison et al. (1996) reported depression of
soil pH to 4.5 following a 300 tons/ha sludge loading.
Sludge-processing mode, soil type, soil texture and
time since application had substantial eects on perco-
late metal mobilities following heavy sludge loadings.
Metals and nutrients had a range of response patterns,
indicating that observed mobilities were not simply due
to washing of sludge products through the soil columns.
Analytes had unique patterns of response to one or
more factors in the sludge/soil/soil pH treatment matrix.
B, Cu and Ni leaching was most prominent from N-
Viro and was relatively insensitive to soil pH or type.
Mo leaching was greatest from N-Viro, followed by
ash for Hudson soils. Ni percolate concentrations
were greatest from dewatered sludge and pellets
applied to low pH Arkport soils, followed by pH 7
soils and N-Viro treatments. Zn showed sensitivity to
all three treatment variables, with greatest concentra-
tions from dewatered sludge and pellets; among these
sludge treatments, Arkport soils had greater con-
centrations than Hudson, and for each soil type the
lower initial pH had greater concentrations . Ca trends
were similar to those of Mg, with greatest leaching
from dewatered sludge, N-Viro and pellets. Relatively
little leaching of P was observed from any treatment,
similar to the results of Jackson et al. (1999). The
observed mobilities of Cu, Ni and, in more recent
cycles, Mo mirrored TCLP results (Richards et al.,
1997), although on a diminished scale.
Present results indicate that composted sludge and
ash had the lowest overall trace metal mobilities. Pelle-
tized sludge results were similar to the dewatered sludge,
with notable leaching of Ni, Cd and Zn. N-Viro had the
widest range of leachable elements, including Cu, Ni, B
and Mo. Peak Cu, Ni and Mo levels from N-Viro
exceeded the old site columns concentrations, as did B
concentrations (once old site percolate concentrations
stabilized). This pattern is similar to the results of Theis
et al. (1998) who used the same sludge products under
more intensive leaching conditions.
The overall cumulative percolate losses to date have
been, at most, a small percentage of total applied
metals. It should be remembered that percolate con-
centrations reported here re¯ect only solubl e metals
(free or complexed to soluble organics), since coarse
®ltration was required prior to ICP analysis. Tests of
several column systems indicated little adsorption of
HCl-soluble metals in drain tubing or collection jugs,
but the potential for deposition in the bottom of the soil
column system cannot yet be assessed. The extent of
mixing of sludge with the surface soil layer may have
been greater in this study than would occur with plow-
ing in the ®eld. The lack of the presence of earthworms
(which wer e not added to columns due to potential for
percolate contamination and increased management
requirements) is also a dierence from ®eld conditions:
worms could be expected to open or maintain ¯ow
paths as well as process several of sludge products.
The old site column experiment did not demonstrate
signi®cant soil pH eects on metal mobility due to wide
variation among replicate columns. As cited in the
Experimental approach section, columns with visible
variations in soil (marbling or veins of residual sludge)
were intentionally distributed among the various pH
treatments. This resulted in variable initial soil metal
concentrations among soil columns. Initial topsoil
metal analysis (data not shown) resulted in coecients
of variation (among soil columns) of 10±12% for Cd,
Cu and Zn.
Perhaps the most signi®cant ®nding with the old site
columns was the agreement of observed percolate con-
centrations with lysimeter results measured at the ®eld
Table 7
Comparison of elemental loading rates with recommended maximum reclamation loading rates (for farming use) and USEPA Part 503 cumulative
loading limits
Element Farmland
reclamation limit
(Sopper, 1993)
(kg/ha)
Part 503 maximum
cumulative limit
(USEPA, 1993)
(kg/ha)
Maximum cumulative loading rate used in this study:
from Table 3,
(kg/ha)
as % of
reclamation limit
as % of
Part 503 limit
Cd 3.4 39 1.4 41 3.6
Cr 336 3000 30 9 1.0
Cu 840 1500 134 16 8.9
Mo ± [18]
a
7.1 ± 39
Ni 33 420 8.5 26 2.0
Pb 336 300 30 9 10
Zn 168 2800 125 74 4.5
a
Mo limit subsequently withdrawn.
344 B.K. Richards et al. / Environmental Pollution 109 (2000) 327±346
site. Table 8 compares mean percolate concentra tions of
several key elements from the natural pH soil columns
(which are identical to the soil at the ®eld site) to mean
old site data accumulated over several years (Richards
et al., 1998). Greenhouse soil column data is presented
for two time frames (cumulative means of Cycles 1±5
and of Cycles 1±8) to demonstrate that the agreement is
not coincidental. Results are nearly identical to the ®eld
site, with the greatest dierence being Zn, with mean
percolate concentrations of 0.28±0 .35 mg/l from the
soil columns versus 0.44 mg/l in the ®eld site. As was
the case with the ®eld site (Richards et al., 1998), the
present percola te ¯uxes represent a small fraction of soil
total metals, so it can be expected that these percolate
concentrations could be maintained long term.
Several additional years of operation are planned for
the experimental system (with no additional sludge
additions). As was evident from recent Mo and B
trends, the system is still in ¯ux. Soils in pH 7 treat-
ments were restored to near-initial pH levels by lime
additions prior to Cycle 8, while low pH treatments will
be allowed to acidify, simulating unmanaged condi-
tions. Future work will include determination of mobile
forms of metals (free, colloid-adsorbed or organically
complexed), and soil mass balances. Implications of
metal mobility for long-term groundwater quality also
need to be examined.
Acknowledgements
This project was undertaken with funding from the
New York State Energy Research and Development
Authority (NYSERDA), Project No. 1990-ERER-MW-
93, Barry Liebowitz, Project Manager. The authors
particularly wish to thank the following student workers
for assistance in the labor-intensive construction and
operation of the experimental system: Jessica Adema,
Ben Bar tsch, Walter Blackler, Eric Brewer, Charles
Burger, Seth Charles, Jeannine Danner, Rudra De,
Katy Deddens, Eve Farrington, Rick Gage, Russell
Goodman, Alison Humphries, Quentin Kelley, Kristen
Keske, Je Matthias, Jennifer McDowell, Kenneth
Mui, Sonya Padron, Steve Shaw, Natalie Sierra, Brian
Sprague, Jasper Steenhuis, Mark Tarry, Conrad Taylor
and Eva Wong.
References
Barbarick, K.A., Ippolito, J.A., Westfall, D.G., 1998. Extractable
trace elements in the soil pro®le after years of biosolids application.
J. Environ. Qual. 27, 801±805.
Basta, N.T., Sloan, J.J., 1999. Bioavailability of heavy metals in
strongly acidic soils treated with exceptional quality biosolids.
J. Environ. Qual. 28, 633±638.
Baveye, P., McBride, M.B., Bouldin, D.R., Hinesly, T.D., Dahdoh,
M.S.A., Abdel-Sabour, M.F., 1999. Mass balance and distribution
of sludge-borne trace elements in a silt loam following long-term
applications of sewage sludge. Sci. Total Environ. 227 (1), 13±28.
Baxter, J.C., Aguilar, M., Brown, K., 1983. Heavy metals and persis-
tent organics at a sewage sludge disposal site. J. Environ. Qual. 12,
311±316.
Boll, J., 1995. Methods and tools for sampling the vadose zone. PhD
thesis, Cornell University, Ithaca, NY.
Brown, S., Chaney, R., Angle, J.S., 1997. Subsurface liming and metal
movement in soils amended with lime-stabilized biosolids. J.
Environ. Qual. 26, 724±732.
Camobreco, V.J., Richards, B.K., Steenhuis, T.S., Peverly, J.H.,
McBride, M.B., 1996. Movement of heavy metals through undis-
turbed and homogenized soil columns. Soil Sci. 161 (11), 740±750.
Chang, A.C., Warneke, J.E., Page, A.L., Lund, L.J., 1984. Accumu-
lation of heavy metals in sewage sludge-treated soils. J. Environ.
Qual. 13, 87±91.
Dowdy, R.H., Latterell, J.J., Hinesly, T.D., Grussman, R.B., Sullivan,
D.L., 1991. Trace metal movement in an Aeric Ochraqualf follow-
ing 14 years of annual sludge applications. J. Environ. Qual. 20,
119±123.
Duncomb, D.R., Larson, W.E., Clapp, C.E., Dowdy, R.H., Linden,
D.R., Johnson, W.K., 1982. Eect of liquid wastewater sludge
application on crop yield and water quality. J. Water Poll. Ctrl. Fed.
54 (8), 1185±1193.
Frossard, E., Sinaj, S., Zhang, L.M., Morel, J.L., 1996. The fate of
sludge phosphorus in soil±plant systems. Soil Sci. Soc. Am. J. 60,
1248.
Table 8
Percolate metals concentrations (mg/l) greenhouse old site soil columns (native pH, mean of Cycles 1±5 and 1±8) in comparison to ®eld site sludge
plot lysimeter samples
Element Old site soil columns Old site sludge plot lysimeter samples
Cycles 1±5 Cycles 1±8
Mean SD Mean SD Mean SD
Ca 164 14 160 12 177 43
Cd 0.008 0.005 0.009 0.004 0.008 0.000
Cr 0.029 0.003 0.032 0.003 0.033 0.008
Cu 0.176 0.055 0.188 0.052 0.132 0.013
Ni 0.127 0.038 0.128 0.036 0.199 0.008
P 0.470 0.070 0.505 0.048 0.398 0.158
Zn 0.279 0.178 0.351 0.209 0.444 0.034
B.K. Richards et al. / Environmental Pollution 109 (2000) 327±346 345
Harrison, R.B., Gessel, S.P., Zabowski, S., Henry, C.L., Xue, D.,
Cole, D.W., Compton, J.E., 1996. Mechanisms of negative impacts
of three forest treatments on nutrient availability. Soil Sci. Soc. Am.
J. 60, 1622±1628.
Hinesly, T.D., Hansen, L.G., Dotson, G.K., 1984. Eects of using
sewage sludge on agricultural and disturbed lands (EPA-600/S2-83-
113, Order No. PB 84-117 142). Nat. Tech. Info. Service, Spring-
®eld, VA.
Jackson, B.P., Miller, W.P., Schumann, A.W., Sumner, M.E., 1999.
Trace element solubility from land application of ¯y ash/organic
waste mixtures. J. Environ. Qual. 28, 639±647.
Jordan, R.N., Yonge, D.R., Hathhorn, W.E., 1997. Enhanced mobi-
lity of Pb in the presence of dissolved natural organic matter. J.
Contaminant Hydrology 29, 59±80.
Krogman, U., Boyles, L.S., Martel, C.J., McComas, K.C., 1997. Bio-
solids and sludge management. Water Env. Res. 69 (4), 534±550.
Krogman, U., Qu, M., Boyles, L.S., Martel, C.J., 1998. Biosolids and
sludge management. Water Env. Res. 70 (4), 557±580.
Kung, K J.S., 1990. Preferential ¯ow in a sandy vadose zone: 1. ®eld
observation. Geoderma 46, 51±58.
Lamy, I., Bourgeois, S., Bermond, A., 1993. Soil cadmium mobility as a
consequence of sewage sludge disposal. J. Environ. Qual. 22, 731±737.
Logan, T.J., Goins, L.E., Lindsay, B.J., 1997a. Field assessment of
trace element uptake by six vegetables from N-Viro soil. Water
Environ. Res. 69 (1), 28±33.
Logan, T.J., Lindsay, B.J., Goins, L.E., Ryan, J.A., 1997b. Field
assessment of sludge metal bioavailability: sludge rate response. J.
Environ. Qual. 26, 534±550.
McBride, M.B., 1994. Environmental Chemistry of Soils. Oxford
University Press, New York.
McBride, M.B., Richards, B.K., Steenhuis, T.S., Peverly, J.H., Russel,
J.J., Suave, S., 1997. Mobility and solubility of toxic metals and
nutrients in soil ®fteen years after sludge application. Soil Sci. 162
(7), 487±500.
McBride, M.B., 1998. Soluble trace metals in alkaline stabilized sludge
products. J. Environ. Qual. 27, 578±584.
McCarthy, J.F., Zachara, J.M., 1989. Subsurface transport of con-
taminants. Environ. Sci. Technol. 23 (5), 496±503.
McGrath, S.P., Lane, P.W., 1989. An explanation for the apparent
losses of metals in a long-term ®eld experiment with sewage sludge.
Environ. Pollut. 60, 235±256.
McGuire, P.E., Lowery, B., Helmke, P.A., 1992. Potential sampling
error: trace metal adsorption on vacuum porous cup samplers. Soil
Sci. Am. J. 56 (1), 74±82.
Misslebrook, T.H., Shepard, M.A., Pain, B.F., 1996. Sewage sludge
applications to grassland: in¯uence of sludge type, time and method
of application on nitrate leaching and herbage yield. J. Agri. Sci.
126, 343.
Richards, B.K., Steenhuis, T.S., Peverly, J.H., Liebowitz, B.N., 1997.
Eect of processing mode on trace elements in dewatered sludge
products. J. Environ. Qual. 26, 782±788.
Richards, B.K., Steenhuis, T.S., Peverly, J.H., McBride, M.B., 1998.
Metal mobility at an old, heavily-loaded sludge application site.
Environ. Pollut. 99, 365±377.
Ro
È
mkens, P., Salomons, W., 1998. Cd, Cu and Zn solubility in arable
and forest soils: consequences of land use changes for metal mobi-
lity and risk assessment. Soil Sci. 163 (11), 859± 871.
Shepherd, M.A., 1996. Factors aecting nitrate leaching from sewage
sludges applied to a sandy soil in arable agriculture. Agric. Ecosyst.
Environ. 58, 171.
Sopper, W.E., 1993. Municipal Sludge Use in Land Reclamation.
Lewis Publishers, Boca Raton, FL.
Steenhuis, T.S., Parlange, J Y., Aburime, S.A., 1995. Preferential
¯ow in structured and sandy soils: consequences for modeling and
monitoring (Chapter 5). In: Everett, L., Cullen, S., Wilson, L.
(Eds.), Handbook of Vadose Zone Characterization and Monitor-
ing. Lewis Publishers, Ann Arbor, MI, pp. 61±77.
Steenhuis, T.S., Ritsema, C.J., Dekker, L.W., 1996. Introduction. In:
Steenhuis, T.S., Ritsema, C.J., Dekker, L.W. (Eds.), Fingered Flow
in Unsaturated Soil: From Nature to Model. Special Issue of Geo-
derma 70, 83±85.
Streck, T., Richter, J., 1997. Heavy metal displacement in a sandy soil
at the ®eld scale: I. Measurements and parameterization of sorption.
J. Environ. Qual. 26, 49±56.
Theis, T.L., Brown, R.L., Gibbs, J., Collins, A.G., 1998. Land
application of biosolids: comparison among stabilization methods.
In: Wilson, T.E. (Ed.), Water Resources and the Urban Environ-
ment-98, Proceedings of the (1998) National Conference on
Environmental Engineering, Chicago, Illinois, June 1998. Reston, VA.
USEPA, 1992a. Toxicity characteristic leaching procedure (Method
1311). In: Test Methods for Evaluating Solid Waste, 3rd Edition
(Publication SW-846). Oce of Solid Waste and Emergency
Response, Washington, DC.
USEPA, 1992b. Technical Support Document for Land Application
of Sewage Sludge, Vol. I (Publication 822/R-93-00a). United States
Environmental Protection Agency. Washington, DC.
USEPA, 1993. Clean Water Act. Part 503. Vol. 58, No. 32. (40 CFR
Part 503). USEPA, Washington, DC.
Welch, J.E., Lund, L.J., 1987. Soil properties, irrigation water
quality, and soil moisture level in¯uences on the movement of nickel
in sewage sludge-treated soils. J. Environ. Qual. 16 (4), 403±410.
Wen, G.T., Bates, E., Voroney, R.P., Winter, J.P., Schellenbert, M.P.,
1997. Comparison of phosphorus availability with application of
sewage sludge, sludge compost and manure compost. Commun. Soil
Sci. Plant Anal. 28, 1481.
Wenzel, W.W., Sletten, R.S., Brandstetter, A., Wieshammer, G., Stin-
geder, G., 1997. Adsorption of trace metals by tension lysimeters:
nylon membrane vs. porous ceramic cup. J. Environ. Qual. 26,
1430±1434.
Xiao, C., Ma, L.Q., Sarigumba, T., 1999. Eects of soil on trace metal
leachability from papermill ashes and sludge. J. Environ. Qual. 25,
321±333.
346 B.K. Richards et al. / Environmental Pollution 109 (2000) 327±346