Báo cáo khoa học: Structural recognition of an optimized substrate for the ephrin family of receptor tyrosine kinases pot
Bạn đang xem bản rút gọn của tài liệu. Xem và tải ngay bản đầy đủ của tài liệu tại đây (885.09 KB, 10 trang )
Structural recognition of an optimized substrate for the
ephrin family of receptor tyrosine kinases
Tara L. Davis
1,2
, John R. Walker
1
, Abdellah Allali-Hassani
1
, Sirlester A. Parker
3
, Benjamin E. Turk
3
and Sirano Dhe-Paganon
1,2
1 Structural Genomics Consortium, University of Toronto, Canada
2 Department of Physiology, University of Toronto, Canada
3 Department of Pharmacology, Yale University School of Medicine, New Haven, CT, USA
Introduction
The ephrin receptor class of receptor tyrosine kinases
(EPH RTKs) is the largest subgroup of RTKs in the
kinome, and encodes a wide range of biological activi-
ties. Many of these activities relate directly to cell–cell
communication, including signaling involved in cell
morphology and cell movement, and also effect cell
proliferation, differentiation and survival [1–3]. The
EPH RTKs are uniquely suited to these types of sig-
naling pathways because of the distinctive mode of
interaction between the RTK and the ephrin ligand;
cells expressing and presenting the ligand interact with
neighboring cells expressing transmembrane RTK, and
this contact induces ‘bidirectional’ signaling in both
ephrin-expressing and kinase-expressing cell types
[2,4,5]. It follows that both the ephrin ligand and the
EPH RTKs are attractive drug targets for diseases inti-
mately connected with pathological cell contact,
including many types of cancers; tumorigenic growth,
invasiveness and angiogenic pathways are clearly and
directly impacted by ephrin and EPH expression levels
in tumor cells [3,6,7].
Of the 16 EPH RTKs encoded by the human gen-
ome, EphA3 has emerged as a novel target for thera-
peutics aimed at cancer and leukemia. EPHA3 is
involved in neural and retinal development in mam-
mals, and was originally described as a determinant of
Keywords
ephrin kinase; peptide array; receptor
tyrosine kinase; substrate recognition; X-ray
crystallography
Correspondence
S. Dhe-Paganon, Structural Genomics
Consortium, University of Toronto, 101
College Street, Toronto, Ontario M5G 1L7,
Canada
Fax: +1 416 946 0880
Tel: +1 416 946 3876
E-mail:
(Received 4 May 2009, accepted 10 June
2009)
doi:10.1111/j.1742-4658.2009.07147.x
Ephrin receptor tyrosine kinase A3 (EphA3, EC 2.7.10.1) is a member of a
unique branch of the kinome in which downstream signaling occurs in both
ligand- and receptor-expressing cells. Consequently, the ephrins and ephrin
receptor tyrosine kinases often mediate processes involving cell–cell con-
tact, including cellular adhesion or repulsion, developmental remodeling
and neuronal mapping. The receptor is also frequently overexpressed in
invasive cancers, including breast, small-cell lung and gastrointestinal can-
cers. However, little is known about direct substrates of EphA3 kinase and
no chemical probes are available. Using a library approach, we found a
short peptide sequence that is a good substrate for EphA3 and is suitable
for co-crystallization studies. Complex structures show multiple contacts
between kinase and substrates; in particular, two residues undergo confor-
mational changes and by mutation are found to be important for substrate
binding and turnover. In addition, a difference in catalytic efficiency
between EPH kinase family members is observed. These results provide
insight into the mechanism of substrate binding to these developmentally
integral enzymes.
Abbreviations
AL, activation loop; AMP-PNP, adenylyl-imidodiphosphate, tetralithium salt; EphA3, ephrin receptor tyrosine kinase A3; RTK, receptor
tyrosine kinase.
FEBS Journal 276 (2009) 4395–4404 Journal compilation ª 2009 FEBS. No claim to original US government works 4395
retinotectinal mapping [8–10]. Surprisingly, EPHA3
knockouts showed a clear heart phenotype, developing
abnormal atria that led to high postnatal mortality
[11]. The molecular basis for these findings has not
been elucidated. Later work has shown overpopulation
of EPHA3 mutations in colorectal, lung, liver and kid-
ney cancers [12–14], and in glioblastoma, melanoma
and rhabdomyosarcoma cell lines, among others
[15,16], suggesting that the EphA3 kinase domain is an
attractive candidate for drug development in these
highly aggressive tumors. EphA3 (along with most of
the EPH A class RTKs) is a highly promiscuous recep-
tor for ephrins, which allows for cross-talk between
four of the five ephrin A-type ligands in addition to
ephrin B2 [3,7,17–19]. Because EphA3 is widely
expressed in tissues from placental stages and through-
out development, as are many of the ephrin ligands, it
is important to find pharmacological strategies for
studying EphA3 that are specifically targeted towards
this isoform.
Along these lines, our laboratory has previously
studied the autoregulatory mechanism of the EphA3
kinase domain by determining a group of EphA3
structures in various states of activation [20]. In this
study, a de novo peptide has been developed, showing
a marked increase in affinity for EphA3 over peptides
derived from autophosphorylation sites in the juxta-
membrane region of EphA3. Two structures in com-
plex with peptide rationalize the increase in affinity
observed in solution. Two residues contributed by the
kinase domain in the structure seem to explain the
high affinity towards substrate, and mutational analy-
sis confirms their importance in the kinase–substrate
interaction. Finally, the selectivity of this peptide for
EphA3 over other ephrin receptor kinases gives insight
into substrate specificity for this biologically relevant
class of receptor tyrosine kinases and provides a valu-
able tool for future research.
Results and discussion
The juxtamembrane region of the cytosolic domain is
a validated autophosphorylation site for Eph kinases
and was initially targeted for co-crystallization efforts.
The juxtamembrane EphA3 peptide, D
598
PHTYED-
PTQ
606
, in which the numbers correspond to the resi-
due numbers of the EphA3 receptor, is a substrate for
the EphA3 kinase domain with catalytic efficiency of
200 min
)1
Æmm
)1
(K
m
= 1 ± 0.02 mm; k
cat
= 199 ±
9 min
)1
) [20]. Unfortunately, extensive attempts to
crystallize EphA3 with this peptide were unsuccessful,
perhaps because of poor affinity for the kinase
domain. To screen for more suitable substrates, a posi-
tional scanning peptide approach was utilized that
evaluates the phosphorylation of a set of arrayed
degenerate peptides having fixed amino acids at one of
the five preceding, or four succeeding, positions rela-
tive to the phospho-acceptor tyrosine (described as
positions )5 through +4 throughout the text). In
addition to the 20 unmodified amino acids, the array
also included peptides containing phosphothreonine or
phosphotyrosine at each fixed position. The results of
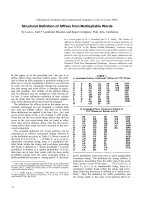
this screen indicated that EphA3 was largely unselec-
tive at positions upstream of the phosphorylation site
with the exception of the )1 position, where the kinase
selects primarily acidic residues (including phosphoty-
rosine and phosphothreonine) and asparagine, and is
also tolerant of hydrophobic residues such as leucine
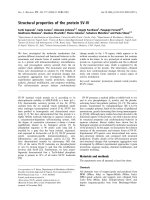
and isoleucine (Fig. 1 and Table S1). The positions
following the substrate tyrosine generally showed
greater stringency with clear preferences for tryptophan
at the +4, aliphatic residues (including proline) at the
Fig. 1. Phosphorylation motifs and optimal substrate design for
EphA3. Biotinylated peptides bearing the indicated residue at the
indicated position relative to a central tyrosine phosphoacceptor
site were subjected to phosphorylation by EphA3 with radiolabeled
ATP. Aliquots of each reaction were subsequently spotted onto a
streptavidin membrane, which was washed, dried and exposed to
a phosphor screen. The upper panel shows a representative array
from three separate experiments. Quantified spot intensities repre-
senting the average of the three runs are provided in the lower
panel; amino acids in bold show the highest significant difference
for array positions from )2 to +4; numbers in parentheses indicate
the relative signal-to-noise ratio at each position. The optimized
sequence derived from these results was used for all kinetic and
structural work; this sequence (named EPHOPT in the manuscript)
is KQWDNYE-pY-IW.
Complex structure of EPHA3 with peptide substrate T. L. Davis et al.
4396 FEBS Journal 276 (2009) 4395–4404 Journal compilation ª 2009 FEBS. No claim to original US government works
+3, and acidic residues at the +1 position. Strikingly,
the enzyme strongly preferred phosphotyrosine at the
+2 position of the array, with other polar residues being
selected to a much lesser extent.
Based on the combinatorial peptide array results,
the following peptide was synthesized: KQWDNYEp-
YIW (hereafter referred to as EPHOPT), in which pY
at the position +2 to the substrate tyrosine denotes a
phosphotyrosine incorporated into the peptide during
synthesis. This peptide was tested under similar condi-
tions to the original juxtamembrane substrate and
showed a remarkable augmentation in regards to both
turnover and binding affinity; catalytic efficiency
increased > 200-fold, with a decrease in K
m
of almost
two orders of magnitude (from 1 mm to 18 ± 4 lm)
and a fourfold increase in k
cat
(from 199 to
850 ± 44 min
)1
) (Table 2, peptide EPHOPT).
Co-crystals of the EphA3 kinase domain with ade-
nylyl-imidodiphosphate, tetralithium salt (AMP-PNP)
and EPHOPT were obtained under identical conditions
as that of unliganded EphA3, and a 1.7 A
˚
dataset was
collected. Statistics for data collection and processing
are provided in Table 1.
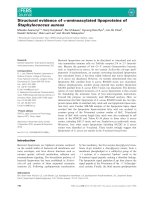
The complex structure between EphA3 and EPH-
OPT shows clear density for most of the substrate pep-
tide, including main chain atoms for the )4 through to
the +4 position, but partial or no density for the side
chains of the N-terminal three residues and C-terminal
tryptophan residue. Density for the substrate tyrosine
and the phosphorylated tyrosine at position +2 is
clear and unambiguous (Fig. 2B). Overall, the struc-
ture of the kinase domain is found to be in the acti-
vated form, as described previously (for example, an
AMP–PNP bound structure, PDB code 2QO9); the
juxtamembrane region is mostly disordered, concomi-
tant with a greater degree of order found in the activa-
tion loop (AL) region (Fig. 2A). The orientation of the
Tyr742:Ser768 residue pair, described previously as a
marker of EPH kinase activation [20], is in the noncla-
shing ‘active’ rotamer position. As expected, most
structural rearrangements to accommodate AMP–PNP
binding are accomplished by the N-terminal lobe, espe-
cially the b1–b2 loop (G loop) and aC regions. Crys-
tallization of the complex between the EphA3 kinase
domain and the EPHOPT peptide did not result in the
full ordering of the AL; instead, the N-terminal part of
the AL was found ordered to residue Asp774, whereas
the C-terminal part of the AL was ordered to residue
Gly784. This represents an appearance in density of
only one residue on either end of the AL over our
most ordered structure to date (PDB 2QOC, represent-
ing a kinase domain without the juxtamembrane
segment and bound to AMP–PNP) [20]. Perhaps this
is because of the relatively short peptide that was used
for crystallization, or to apparent crystal contacts that
place a symmetry-related molecule relatively close to
where the AL order ends.
Interactions between the EphA3 kinase domain and
the EPHOPT substrate do not effect large conforma-
tional changes in the N- or C-terminal lobes of the
kinase (Fig. 2A). There is slight movement in the
aF–aG loop in the C-terminal lobe, which has the
effect of moving the loop residues Met828–Gln831
0.9 A
˚
closer to the substrate. There are, however,
some conspicuous differences in the AL loop residues
beginning at Gly784 and continuing through to
Table 1. Crystallographic statistics. Atomic coordinates for the
structures discussed in the text have been deposited into the
RCSB and PDB codes are listed in the Experimental procedures
and in the table.
EphA3:EPHOPT EphA3:OPTYF
Dataset
Spacegroup P 1 21 1 P 1 21 1
Unit cell (A
˚
) 53.46 38.20
76.65
53.82 38.26
76.37
Unit cell (°) 90.00 102.15
90.00
90.00 102.05
90.00
Data collection
Beamline FRE-HR FRE-HR
Wavelength 1.54178 1.54178
Resolution 26.5–1.7 26.73–1.8
Unique reflections 33335 29459
Data redundancy (fold)
a
3.4 (2.4) 3.6 (3.5)
Completeness (%) 98 (84) 100 (100)
I ⁄ sigI 28 (3) 21 (4)
Rsym
b
0.044 (0.312) 0.049 (0.224)
Refinement
Resolution 1.70 1.8
No. reflections 31644 26963
All atoms (solvent) 5839 (301) 5457 (233)
R
work
(R
free
)
c
0.166 (0.19) 0.179 (0.21)
Rmsd bond length 0.01 0.011
Rmsd bond angle 1.28 1.26
Ramachandran plot
Most favoured (%) 91.5 90.9
Additionally allowed (%) 8.1 8.7
Generously allowed (%) 0.4 0.4
Disallowed (%) 0 0
PDB code 3FXX 3FY2
Modelled residues
Kinase 606–774; 784–892;
895–904
607–773; 784–892;
896–904
Peptide QWDNYE-pY-IW WDNYE-F-IW
a
Highest resolution shell is shown in parentheses.
b
Rsym =
100 · sum(|I ) < I >|) ⁄ sum(< I >), where I is the observed intensity
and < I > is the average intensity from multiple observations of
symmetry related reflections.
c
R
free
value was calculated with 5%
of the data.
T. L. Davis et al. Complex structure of EPHA3 with peptide substrate
FEBS Journal 276 (2009) 4395–4404 Journal compilation ª 2009 FEBS. No claim to original US government works 4397
Trp790 in the EPHOPT complex structure (Figs 2C
and 3). These residues are described in greater detail
below. In addition, the availability of models repre-
senting low-activity (PDB 2QOQ), intermediate
(2QOB, 2QO9, 2GSF) and high-activity (PDB 2QOC)
conformations of EphA3 can be used with the current
models in order to directly compare conformational
changes induced by the ATP analog to the effects of
substrate interaction.
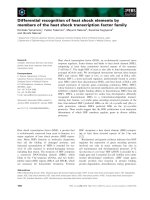
Several residues undergo significant changes in the
substrate-bound complex. Arg745, for example, is
found in three discrete positions in all EphA3 struc-
tures. In the substrate complex, Arg745 is found
moved further towards the activation loop which can
be compared with previously determined active confor-
mations that also move slightly towards the AL
(Figs 2C and 3A). The conformer found in the
EphA3:EPHOPT complex is quite similar to that
found in activated insulin receptor kinase, where the
corresponding residue interacts with a phosphotyrosine
in the AL of that protein [21]. This Arg745 flip is not
simply a consequence of phosphorylation of the AL
tyrosine pTry799; in the substrate-bound complex it is
found in a unique position even compared with other
EphA3 structures where this tyrosine is phosphorylated
based on LC-MS ⁄ MS analysis [20]. Arg823, located in
the aF–aG loop region (Fig. 3A), is also found in a
unique rotamer position in the EphA3:EPHOPT com-
plex relative to all other EphA3 structures. In the sub-
strate complex, Arg823 moves to coordinate both the
backbone of Asn–1 (2.96 A
˚
) and Od1 in Asp–2
(2.87 A
˚
) (Figs 2C and 3A). This residue, like Arg745,
is conserved among almost all EPH RTK isoforms,
except the psuedokinase EPHA6 and a substitution
from Arg745 to Lys in EPHA1. Similarly, Glu827
moves in the substrate complex, coordinates the back-
bone N and O of Lys–5 (2.81, 2.65 A
˚
) and also sup-
ports orientation of Arg823. Finally, Asn830
coordinates Oe1 of Glu+1 (2.65 A
˚
) (Fig. 2C) and this
moves aG towards the substrate in an orientation
unique to the EphA3:EPHOPT complex (Fig. 3A).
However, the most striking residue movement in the
EphA3:EPHOPT complex is Lys785, in the C-terminal
region of the kinase activation loop (Fig. 2C). Other
structures have a random orientation or disorder at
this position, but in the substrate complex this residue
is clearly ordered, flipped out towards solvent, and
nestled in between the Y0 ⁄ E+1 ⁄ pY+2 sequence of
peptide (Fig. 3A,B). Although not making direct elec-
trostatic interactions with the phosphotyrosine moiety
– which might have been predicted based on the com-
plementary charge of the lysine – the structure implies
that the function of Lys785 could be to lock the C-ter-
minal AL into position relative to substrate sequences.
Based on the EPHOPT complex, a series of variant
peptides was synthesized to probe the relevance of the
+2 substrate position in affinity and turnover effi-
ciency. By contrast to data from the in vitro peptide
screen, the effect of changing the substrate +2 phosp-
hotyrosine residue to a phenylalanine (peptide OPT-
YF) results in only minor changes in K
m
and k
cat
(30 ± 5.7 lm and 421 ± 30 min
)1
; a relative change
A
B
C
Fig. 2. Views of the EphA3: EPHOPT com-
plex structure. (A) The structure of EphA3
kinase in complex with the EPHOPT pep-
tide. EphA3 is shown in a ribbon representa-
tion and in teal; the substrate is shown in
purple and in a stick representation. The
ATP analog AMP–PNP is shown in a stick
representation in orange. (B) Representative
density, 1.3 r. Shown is the backbone for
four residues and phosphotyrosine of pep-
tide and the Lys785 region of kinase. (C)
Enlarged view of the EphA3: EPHOPT inter-
face. Coloring is as in (A).
Complex structure of EPHA3 with peptide substrate T. L. Davis et al.
4398 FEBS Journal 276 (2009) 4395–4404 Journal compilation ª 2009 FEBS. No claim to original US government works
of approximately twofold in each parameter) (Table 2).
In order to rationalize this finding, EphA3 was
co-crystallized with the OPTYF peptide; the structure
is quite similar to that of the EPHOPT complex, with
an RMSD of 0.17 A
˚
over all Ca atoms and the major-
ity of EphA3 residue side chains in conformations as
described previously. The substrate tyrosine and the
phenylalanine aromatic side chain at the +2 position
are superimposable with the substrate tyrosine and
phosphorylated tyrosine in the EPHOPT complex
(Fig. 3C). The subtle difference in phosphorylation
efficiency between the two peptides might be explained
by the conformations of a few key kinase residues in
the OPTYF complex, including Arg712, Arg823 and
the Glu827–Asn830 region, which are in a low to inter-
mediate activity conformation, and do not coordinate
with substrate as they do in the EPHOPT complex
(Fig. 3). In addition, the backbone atoms of the Trp–
A
B
C
Fig. 3. Structural changes in EphA3 kinase
upon binding substrates, and comparison of
the EPHOPT and OPTYF complex struc-
tures. (A) A series of EphA3 structures with-
out substrate bound [20] are shown
superimposed upon the EphA3:EPHOPT
complex structure. Coloring is as follows:
light green, EphA3:EPHOPT complex (PDB
ID 3FXX); dark green, a low activity EphA3
conformation (2QOQ); orange and blue, two
intermediate activity conformations (2QOB
and 2GSF); pink, a higher activity conforma-
tion (2QO9); red, a high activity conforma-
tion (2QOC). The EPHOPT substrate is not
shown so that the differences in conforma-
tion in the region around AL residue Lys785
and aG residue Asn830 can be seen clearly.
In order to assess the relative flexibility of
these two regions, several other kinase resi-
dues within 4 A
˚
of the EPHOPT substrate
are also shown. These residues are clearly
fixed in their orientation regardless of
whether substrate is bound or the activity
state the contributing structure represents.
(B) A general view of the EphA3:EPHOPT
interface. (C) The EphA3:OPTYF interface
(PDB 3FY2). Compare the orientation of
OPTYF residues Trp–4, Asn–3, Asp–2 and
Glu+1 with those of EPHOPT in (B).
Table 2. Kinetic data. The upper panel shows the effect of varying
amino acids at the +2 position of the substrate. The sequences of
the tested peptides are as follows: EPHOPT,KQWDNYEpYIW;
OPTYF, KQWDNYEFIW; OPTYK, KQWDNYEKIW. The lower panel
shows the effect of mutating EphA3.
Peptide K
m
(lM)
k
cat
(min
)1
)
k
cat
⁄ K
m
(lMÆmin
–1
)
EPHA3 wild-type protein
EPHOPT 18 ± 4.4 850 ± 44 47.22
OPTYF 30 ± 5.7 421 ± 30 14.03
OPTYK 107 ± 15.6 220 ± 27 2.056
EPHA3 N830A mutant
EPHOPT 39.5 ± 0.7 33 ± 1.4 0.835
OPTYF 152 ± 35 30 ± 1.4 0.197
EPHA3 K785E mutant
EPHOPT 188 ± 64 34 ± 0.7 0.181
OPTYF 148 ± 10 23 ± 8.0 0.155
T. L. Davis et al. Complex structure of EPHA3 with peptide substrate
FEBS Journal 276 (2009) 4395–4404 Journal compilation ª 2009 FEBS. No claim to original US government works 4399
3–Asp–2 region of the OPTYF substrate have moved
relative to the EPHOPT peptide and are no longer
coordinated by EphA3 kinase; and the )4 residue is
disordered. The glutamate at substrate position +1 is
pointing away from kinase residue Asn830, a drastic
change from the coordination seen in the EPHOPT
complex (Fig. 3). Finally, the AMP-PNP molecule
included in the co-crystal trials is disordered in the
OPTYF structure. Although the structural changes are
subtle, the phosphotyrosine at the +2 plays an impor-
tant role in reordering the structure of the region of
the C-terminal lobe that interacts with these substrates.
In the absence of the phosphate group, the side chain
of substrate residue Glu+1 has reoriented to point
towards kinase residue Lys785 (a 2 A
˚
movement) and
the N-terminal part of the substrate has moved out of
the kinase subsite delineated by residues Arg712 and
the region including residues Arg823–Asn830.
The side chain of Lys785 in the EphA3:OPTYF com-
plex is also flipped out in the same distinctive way as in
the EPHOPT complex, implying that this ordered
movement is concomitant with substrate binding and is
perhaps minimally sufficient for substrate coordination.
This would also explain why, even though there are
several rearrangements in the OPTYF complex that
result in fewer interactions with the C-terminal lobe,
there is still significant affinity of this peptide for
EphA3. In line with these findings, and also in agree-
ment with the peptide array data, replacement of the
phosphotyrosine with a lysine (peptide OPTYK) leads
to a decrease in catalytic efficiency of one order of
magnitude, mainly because of K
m
effects (107 ±
15.6 lm, an approximately 10-fold effect; Table 2).
This is presumably because a lysine at the +2 position
of the substrate would be expected to clash strongly
with Lys785 from the kinase domain, again suggesting
that the concerted movement of Lys785 is directly
related to the substrate coordination.
To test the relative importance of the Asn830 and
Lys785 interactions with substrate, EphA3 mutants
were generated and their catalytic efficiencies tested.
EphA3(N830A) showed a more than one order of
magnitude decrease in catalytic efficiency against the
EPHOPT substrate, largely because of k
cat
effects
(k
cat
⁄ K
m
0.835 lmÆmin
)1
, a 56-fold difference)
(Table 2). EphA3(N830A) also showed a fivefold
weaker affinity for the OPTYF peptide than for the
EPHOPT peptide. Based on the structural data, this
result is likely to be because the EPHOPT sequence
forms interactions with the second substrate-binding
subsite comprised of residues Arg712 and the region
including residues Arg823–Asn830, whereas the OPT-
YF peptide does not; therefore, the loss of the interac-
tion with Asn830 would be more significant for the
OPTYF peptide. In comparison, the EphA3(K785E)
mutation negatively affected both K
m
and k
cat
by
about an order of magnitude relative to wild-type
enzyme (188 ± 64 lm and 34 ± 0.7 min
)1
). The cata-
lytic efficiency for EphA3(K785E) against EPHOPT
was almost negligible (260-fold decrease). In line with
the identical orientation of Lys785 seen in the OPTYF
structure, the catalytic efficiency for EphA3(K785E)
against OPTYF was equally low (K
m
= 148 ± 10 lm;
k
cat
=23±8min
)1
, k
cat
⁄ K
m
= 0.155 lmÆmin
)1
)(Table2).
Both kinase mutants were competent for autophospho-
rylation (four sites verified by LC-MS; data not
shown), so it is unlikely that the dramatic decreases in
catalytic efficiency seen were because of trivial misfold-
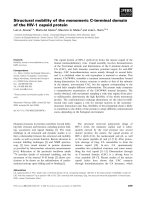
ing of the mutant EphA3 kinase domain. Finally, both
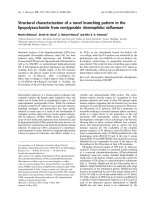
Asn830 and Lys785 are completely conserved across
EPH isoforms (excepting the pseudo-kinases EPHA10
and EPHB6) (Fig. 4), suggesting that these residues
are involved more generally in both binding and effec-
tive catalysis of the substrate in the EPH RTK family.
In fact, all of the residues that interact directly with
the EPHOPT substrate based on the EphA3 complex
structure are conserved across both the EPHA and
EPHB kinase classes. However, there are neighboring
residues that are poorly conserved, including the AL
residue at position 782 in EphA3 (Fig. 4). Although
the density for this residue has not been observed in
the structures of EPH kinases, the side chain would
likely be found near the phosphotyrosine at position
+2 and is a good candidate for substrate recognition.
This residue is variously an arginine in EphA3, a
serine, threonine or glutamine in the EPHA isoforms
or a serine–leucine or alanine–leucine insert in EPHB
isoforms (Fig. 4).
To test whether the EPHOPT peptide is specific for
EphA3, a group of five additional EPH kinase
domains, including EphA5, EphA7, EphB3, EphB4
and EphB2, was analyzed. We found that the EPH-
OPT peptide was mildly to strongly selective for
EphA3, with catalytic efficiencies decreasing from 3- to
88-fold for the other isoforms tested (EphA3 >
EphA5 @ EphB3 >> EphA7 @ EphB4 >> EphB2)
(Table S2). Utilizing array technology, the in vitro sub-
strate specificity for EphA4 was recently published and
can be summarized as {not R, H, K, P}-Y-[E ⁄ D]-
[E ⁄ D]-[PILF] [22]. These results are similar to our
EphA3 motif, and would indicate that EphA4 should
be active against the EPHOPT substrate as well. The
identity of the EphA3 residue Arg782 in EphA7, B4
and B2 kinases are all nonarginine, and indeed lower
catalytic efficiencies for our substrate against those
isoforms was found. However, why EphB3 was nearly
Complex structure of EPHA3 with peptide substrate T. L. Davis et al.
4400 FEBS Journal 276 (2009) 4395–4404 Journal compilation ª 2009 FEBS. No claim to original US government works
as efficient as EphA5 and had nearly identical sub-
strate affinity as EphA3 is presently unclear.
In summary, we have identified a substrate with low
micromolar affinity for EphA3, a target of interest
because of its isoform-specific participation in cancer
pathologies. Complex structures revealed a binding
conformation in the catalytic cleft that is likely adopted
in the recognition of physiologically relevant substrates
and provides a molecular basis for our observed pep-
tide affinities and enzyme isoform specificities. These
results will facilitate future studies focused on the
rational design of peptide-like chemical probes.
Experimental procedures
Cloning and expression
The construct used for expression of the EphA3 kinase
domain has been described previously [20]. For site-directed
mutagenesis, plasmids were subjected to QuikChange
(Stratagene, L Jolla, CA, USA) mutagenesis using muta-
genic primers spanning the altered codons. Resultant plas-
mids were transformed into BL21 Gold (DE
3
) cells
(Stratagene) for large-scale protein expression. Cells were
grown in supplemented Terrific Broth media at 37 °Cto
D
600
= 5–6 and were induced overnight at 15 °C with
100 lm isopropyl thio-b-d-galactoside.
Purification
Cell pellets were resuspended in lysis buffer (50 mm Tris pH
8.0, 500 mm NaCl, 1 mm phenylmenthylsulfonyl fluoride
and 0.1 mL general protease inhibitor Sigma P2714), lysed
by sonication at 4 °C and mixed for 30 min with HisLink
resin (Promega, Madison, WI, USA). Resin was washed
using the batch-method and loaded into gravity columns;
protein was eluted with elution buffer (lysis buffer plus
250 mm imidazole and 10% glycerol). The tag was removed
with thrombin [one unit added (Sigma T9681) per mg of
protein] by incubation overnight at 4 °C. The sample was
subjected to size-exclusion chromatography using HiLoad
Superdex 200 resin (GE Healthcare, Piscataway, NJ, USA)
pre-equilibrated with gel-filtration buffer [lysis buffer plus
1mm Tris (2-carboxyethyl) phosphine hydrochloride and
Fig. 4. Alignment of EPH kinase domains highlighting the region of substrate interaction. Alignment was performed using CLUSTAL X [35,36],
coloring is by chemical property. Specific residues discussed in the text are labeled and highlighted with boxes; residue numbers correspond
to EphA3 numbering. The alignment corresponds to EphA3 residues 698–854. Secondary structural elements are indicated below the
alignment.
T. L. Davis et al. Complex structure of EPHA3 with peptide substrate
FEBS Journal 276 (2009) 4395–4404 Journal compilation ª 2009 FEBS. No claim to original US government works 4401
1mm EDTA]. Protein was concentrated to 250 lm and incu-
bated overnight at 4 °C with 10 mm MgCl
2
and 5–10 mm
ATP in order to drive complete autophosphorylation of the
kinase. Excess nucleotide or other reagents were removed by
a HiTrapQ HP column (GE Healthcare). Purified protein
was exchanged into gel-filtration buffer by concentration
and dilution and used at 10–20 mgÆmL
)1
for crystallization
studies.
Crystallization, data collection and structure
solution
As described previously, crystals of EphA3 form in multiple
conditions, but only after degradation to construct bound-
aries corresponding to Thr595–Thr912 [20]. For all crystalli-
zation experiments used in this study, protein purified as
above was exposed to 10 mm AMP-PNP (Sigma, St Louis,
MO, USA) and 10 mm MgCl
2
, along with the peptide of
interest, and incubated at 4 °C for at least 30 min prior to
co-crystallization trials. EPHOPT peptide and OPTYK pep-
tides were ordered from the peptide synthesis core facility at
Tufts University (Medford, MA, USA); EPHOPT is soluble
to 100 mm in aqueous buffer; OPTYF was used as a 60 mm
stock in aqueous solution. Optimal conditions for co-
crystallization were found to be 22–28% polyethylene gly-
col 3350, 50 mm Tris (pH 7.5) and 40 mm (NH
4
)
2
SO
4
, using
the hanging drop vapour diffusion method and 1 + 1 lL
drops. Crystals typically appeared 24 h after incubation at
18 °C; the typical size of crystals was 400 · 200 · 200 lm.
Crystals were harvested into cryoprotection buffer (1 : 1
mixture of glycerol and mother liquor; final concentration
of glycerol was 15%) and frozen in liquid nitrogen. Diffrac-
tion data from co-crystals of EphA3 with peptide were
collected on an FR-E generator equipped with an RAXIS-
IV++ detector (Rigaku, Houston, TX, USA) and inte-
grated and scaled using either the hkl2000 program
package for the EPHOPT complex [23,24], or imosflm and
scala for the OPTYF complex [25,26]. phaser was used
with the coordinates of 2GSF as the starting model in order
to obtain initial phasing [27]. Manual rebuilding was per-
formed using wincoot [28] and refined using refmac
[29,30] in the ccp4i program suite [31]. The coordinates and
structure factors for the structures of EphA3 described in
the text have been deposited into the PDB with codes 3FXX
(EPHOPT complex) and 3FY2 (OPTYF complex). All mod-
els have excellent stereochemistry as judged by procheck
[32] and molprobity [33], with no residues in disallowed
regions of Ramachandran space. Statistics of model refine-
ment for both structures are provided in Table 1.
Kinase specificity determination
EphA3 phosphorylation site sequence specificity was deter-
mined by screening a 198-member positional scanning pep-
tide library [34]. Unphosphorylated EphA3 (1.1 mgÆmL
)1
),
purified as described above, was activated by incubation in
20 mm Tris (pH 8.0), 10 mm MgCl
2
, 100 mm NaCl, 2 mm
dithiothreitol, 5% glycerol with 5 mm ATP for 30 min at
ambient temperature. Peptides were arrayed at 50 lm in
multiwell plates in 50 mm Tris (pH 7.5), 10 mm MgCl
2
,
1mm dithiothreitol, 0.1% Tween 20. Reactions were begun
by adding activated EphA3 to 70–800 ngÆmL
)1
and ATP to
50 lm (including 0.3 lCiÆlL
)1
[
33
P]ATP[cP]). Peptides had
the general sequence GAXXXXX-Y-XXXXAGKK(biotin),
where X is a roughly equimolar mixture of the 18 amino
acids excluding cysteine, and tyrosine. In each peptide, one
of the X positions was replaced with 1 of 22 residues (one
of the 20 unmodified amino acids, pSer or pTyr). After
incubation at 30 °C for 2 h, aliquots of each reaction were
simultaneously transferred to streptavidin membrane, which
was processed as previously described [34].
Kinase assays
For all enzymatic assays presented in the current study,
EphA3, EphB3, EphA5 and EphA7 proteins were preincu-
bated with 10 mm each ATP and MgCl
2
as described above
in order to promote full autophosphorylation prior to assay-
ing for enzymatic activity against peptide substrates. All
proteins were purified using a HiTrapQ HP column (GE
Healthcare) as described above in order to remove excess
nucleotide from the reaction; all proteins were exchanged
into identical reaction buffer by concentration and dilution.
EphB2 and EphB4 were purchased from New England Bio-
labs (Ipswich, MA, USA) in their active form and were not
further modified before kinetic analysis. Enzymatic activity
of all wild-type EPH RTKs and EphA3 mutants (N830A
and K785N) were determined using the ADP-Quest Kit and
following the protocol provided by DiscoveRx (Fremont,
CA, USA) as described previously [20]. ADP production
was followed by monitoring the increase in fluorescence
(excitation at 530 nm and emission at 590 nm) using a fluo-
rescence plate reader (Spectramax Gemini; Molecular
Devices, Palo Alto, CA, USA). All reactions were per-
formed at room temperature in a final volume of 50 l L.
Kinetic constants were determined by varying EPHOPT,
OPTYF and OPTYK peptide concentrations from 1 to
4000 lm at 200 lm ATP. Protein concentrations of 10 nm
to 5 lm were used in the assays. All experiments were per-
formed in duplicate, and the values determined for kinase
activity were corrected for background ADP production.
K
m
and V
max
values were calculated using the Michaelis–
Menten equation using sigmaplot 9.0, and standard devia-
tion was calculated from two independent experiments.
Acknowledgements
The Structural Genomics Consortium is a registered
charity (number 1097737) that receives funds from the
Complex structure of EPHA3 with peptide substrate T. L. Davis et al.
4402 FEBS Journal 276 (2009) 4395–4404 Journal compilation ª 2009 FEBS. No claim to original US government works
Canadian Institutes for Health Research, the Canadian
Foundation for Innovation, Genome Canada through
the Ontario Genomics Institute, GlaxoSmithKline,
Karolinska Institutet, the Knut and Alice Wallenberg
Foundation, the Ontario Innovation Trust, the
Ontario Ministry for Research and Innovation, Merck
& Co., Inc., the Novartis Research Foundation, the
Swedish Agency for Innovation Systems, the Swedish
Foundation for Strategic Research and the Wellcome
Trust. S. Parker and B. Turk are supported by a grant
from the U.S. National Institutes of Health
(GM079498).
References
1 Himanen JP, Saha N & Nikolov DB (2007) Cell-cell
signaling via Eph receptors and ephrins. Curr Opin Cell
Biol 19, 534–542.
2 Pasquale EB (2008) Eph-ephrin bidirectional signaling
in physiology and disease. Cell 133, 38–52.
3 Surawska H, Ma PC & Salgia R (2004) The role of
ephrins and Eph receptors in cancer. Cytokine Growth
Factor Rev 15, 419–433.
4 Lackmann M & Boyd AW (2008) Eph, a protein family
coming of age: more confusion, insight, or complexity?
Sci Signal 1, re2.
5 Noren NK & Pasquale EB (2004) Eph receptor–ephrin
bidirectional signals that target Ras and Rho proteins.
Cell Signal 16, 655–666.
6 Smith FM, Vearing C, Lackmann M, Treutlein H,
Himanen J, Chen K, Saul A, Nikolov D & Boyd AW
(2004) Dissecting the EphA3 ⁄ ephrin-A5 interactions
using a novel functional mutagenesis screen. J Biol
Chem 279, 9522–9531.
7 Clifford N, Smith L, Powell J, Gattenlo
¨
hner S, Marx A
& O’Connor R (2008) The EphA3 receptor is expressed
in a subset of rhabdomyosarcoma cell lines and sup-
presses cell adhesion and migration. J Cell Biochem
105, 1250–1259.
8 Cheng H-J, Nakamoto M, Bergemann AD & Flanagan
JG (1995) Complementary gradients in expression and
binding of ELF-1 and Mek4 in development of the
topographic retinotectal projection map. Cell 82, 371–
381.
9 Feldheim DA, Nakamoto M, Osterfield M, Gale NW,
DeChiara TM, Rohatgi R, Yancopoulos GD & Flana-
gan JG (2004) Loss-of-function analysis of EphA recep-
tors in retinotectal mapping. J Neurosci 24, 2542–2550.
10 Lai C & Lemke G (1991) An extended family of pro-
tein-tyrosine kinase genes differentially expressed in the
vertebrate nervous system. Neuron 6, 691–704.
11 Stephen LJ, Fawkes AL, Verhoeve A, Lemke G & Brown
A (2007) A critical role for the EphA3 receptor tyrosine
kinase in heart development. Dev Biol 302, 66–79.
12 Bardelli A, Parsons DW, Silliman N, Ptak J, Szabo S,
Saha S, Markowitz S, Willson JK, Parmigiani G, Kin-
zler KW et al. (2003) Mutational analysis of the tyro-
sine kinome in colorectal cancers. Science 300, 949.
13 Ding L, Getz G, Wheeler DA, Mardis ER, McLellan
MD, Cibulskis K, Sougnez C, Greulich H, Muzny DM,
Morgan MB et al. (2008) Somatic mutations affect key
pathways in lung adenocarcinoma. Nature 455, 1069–
1075.
14 Wood LD, Calhoun ES, Silliman N, Ptak J, Szabo S,
Powell SM, Riggins GJ, Wang TL, Yan H, Gazdar A
et al. (2006) Somatic mutations of GUCY2F, EPHA3,
and NTRK3 in human cancers. Hum Mutat 27, 1060–
1061.
15 Balakrishnan A, Bleeker FE, Lamba S, Rodolfo M,
Daniotti M, Scarpa A, van Tilborg AA, Leenstra S,
Zanon C & Bardelli A (2007) Novel somatic and germ-
line mutations in cancer candidate genes in glioblas-
toma, melanoma, and pancreatic carcinoma. Cancer
Res 67, 3545–3550.
16 Fox BP, Tabone CJ & Kandpal RP (2006) Potential
clinical relevance of Eph receptors and ephrin ligands
expressed in prostate carcinoma cell lines. Biochem Bio-
phys Res Commun
342, 1263–1272.
17 Day B, To C, Himanen JP, Smith FM, Nikolov DB,
Boyd AW & Lackmann M (2005) Three distinct molec-
ular surfaces in ephrin-A5 are essential for a functional
interaction with EphA3. J Biol Chem 280, 26526–26532.
18 Himanen JP, Chumley MJ, Lackmann M, Li C, Barton
WA, Jeffrey PD, Vearing C, Geleick D, Feldheim DA,
Boyd AW et al. (2004) Repelling class discrimination:
ephrin-A5 binds to and activates EphB2 receptor signal-
ing [see comment]. Nat Neurosci 7, 501–509.
19 Murai KK & Pasquale EB (2003) ‘Eph’ective signaling:
forward, reverse and crosstalk. J Cell Sci 116, 2823–
2832.
20 Davis TL, Walker JR, Loppnau P, Butler-Cole C, All-
ali-Hassani A & Dhe-Paganon S (2008) Autoregulation
by the juxtamembrane region of the human ephrin
receptor tyrosine kinase A3 (EphA3). Structure 16, 873–
884.
21 Hubbard SR (1997) Crystal structure of the activated
insulin receptor tyrosine kinase in complex with peptide
substrate and ATP analog. EMBO J 16, 5572–5581.
22 Warner N, Wybenga-Groot LE & Pawson T (2008)
Analysis of EphA4 receptor tyrosine kinase substrate
specificity using peptide-based arrays. FEBS J 275,
2561–2573.
23 Minor W, Cymborowski M & Otwinowski Z (2002)
Automatic system for crystallographic data collection
and analysis. Acta Physiol Pol 101, 613–619.
24 Otwinowski Z & Minor W (1997) Processing of X-ray
diffraction data collected in oscillation mode. Methods
Enzymol 276, 307–326.
T. L. Davis et al. Complex structure of EPHA3 with peptide substrate
FEBS Journal 276 (2009) 4395–4404 Journal compilation ª 2009 FEBS. No claim to original US government works 4403
25 Leslie AG (2006) The integration of macromolecular
diffraction data. Acta Crystallogr D Biol Crystallogr 62,
48–57.
26 Evans P (2006) Scaling and assessment of data quality.
Acta Crystallogr D Biol Crystallogr 62, 72–82.
27 Read RJ (2001) Pushing the boundaries of molecular
replacement with maximum likelihood. Acta Crystallogr
D Biol Crystallogr 57, 1373–1382.
28 Emsley P & Cowtan K (2004) Coot: model-building
tools for molecular graphics. Acta Crystallogr D Biol
Crystallogr 60, 2126–2132.
29 Potterton E, Briggs P, Turkenburg M & Dodson E
(2003) A graphical user interface to the CCP4 program
suite. Acta Crystallogr D Biol Crystallogr 59, 1131–
1137.
30 Winn MD, Isupov MN & Murshudov GN (2001) Use
of TLS parameters to model anisotropic displacements
in macromolecular refinement. Acta Crystallogr D Biol
Crystallogr 57, 122–133.
31 Collaborative Computational Project, Number 4 (1994)
The CCP4 suite: programs for protein crystallography.
Acta Crystallogr D Biol Crystallogr 50, 760–763.
32 Laskowski RA, Macarthur MW, Moss DS & Thornton
JM (1993) Procheck – a program to check the stereo-
chemical quality of protein structures. J Appl Crystal-
logr 26, 283–291.
33 Davis IW, Murray LW, Richardson JS & Richardson
DC (2004) MOLPROBITY: structure validation and
all-atom contact analysis for nucleic acids and their
complexes. Nucleic Acids Res 32, W615–W619.
34 Hutti JE, Jarrell ET, Chang JD, Abbott DW, Storz P,
Toker A, Cantley LC & Turk BE (2004) A rapid
method for determining protein kinase phosphorylation
specificity. Nat Methods 1, 27–29.
35 Jeanmougin F, Thompson JD, Gouy M, Higgins DG &
Gibson TJ (1998) Multiple sequence alignment with
Clustal X. Trends Biochem Sci 23, 403–405.
36 Thompson JD, Gibson TJ, Plewniak F, Jeanmougin F
& Higgins DG (1997) The CLUSTAL_X windows
interface: flexible strategies for multiple sequence align-
ment aided by quality analysis tools. Nucleic Acids Res
25, 4876–4882.
Supporting information
The following supplementary material is available:
Table S1. Quantified peptide array data for EphA3.
Table S2. The isoform-specific nature of the EPHOPT
substrate sequence.
This supplementary material can be found in the
online article.
Please note: As a service to our authors and readers,
this journal provides supporting information supplied
by the authors. Such materials are peer-reviewed and
may be re-organized for online delivery, but are not
copy-edited or typeset. Technical support issues arising
from supporting information (other than missing files)
should be addressed to the authors.
Complex structure of EPHA3 with peptide substrate T. L. Davis et al.
4404 FEBS Journal 276 (2009) 4395–4404 Journal compilation ª 2009 FEBS. No claim to original US government works