The Porritt Lecture, Whanganui, 3 November 2010 potx
Bạn đang xem bản rút gọn của tài liệu. Xem và tải ngay bản đầy đủ của tài liệu tại đây (1.2 MB, 36 trang )
MI Asher, Porritt Lecture, 3 November 2010 1
The Porritt Lecture, Whanganui, 3 November 2010
Professor Innes Asher
Department of Paediatrics: Child and Youth Health
The University of Auckland
The annual lecture is named after Baron Lord Arthur Porritt, the Wanganui-born surgeon, soldier,
Olympic athlete and former Governor General, who delivered the first Porritt Lecture in 1965.
1. Title
2. Acknowledgements
Ehara taku toa i te toa takitahi, ēngari
he toa takimano e.
My strength is not mine alone, but
that of many.
I started training in paediatrics in
1974, and have been a paediatrician
for 30 years. I would especially like to
thank the children and their families
with whom it has been a real privilege
to work, and from whom I have learnt
so much. I would also like to thank
the Child Poverty Action Group from
whom I have learned a great deal
about the broader issues affecting child health, and The Paediatric Society of New Zealand who are
great experts and advocates for our children. Their slogan is „Health of our Children, Wealth of our
Nation.‟ This is the theme of my lecture tonight.
Improving the Poor Health Outcomes for Children
in New Zealand - What Can Be Done?
The Porritt Lecture
Professor Innes Asher
Head of Department of Paediatrics: Child and Youth Health,
The University of Auckland
&
Respiratory Paediatrician,
Starship Children‟s Health
Ehara taku toa i te toa takitahi
ēngari he toa takimano e
My strength is not mine alone,
but that of many
MI Asher, Porritt Lecture, 3 November 2010 2
3. This Lecture
In this lecture I will be talking firstly
about child health outcomes in New
Zealand – international comparisons
and inequalities within New Zealand;
secondly determinants of health – a
triple jeopardy; thirdly child rights;
and finally working together.
4. International Comparisons
5. UNICEF
When UNICEF published its report 3
years ago – „An overview of child
well-being in rich countries‟ [1] it was
no surprise to those working in child
health in New Zealand that our
outcomes were poor.
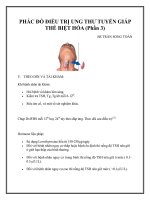
The measure used for health and
safety shown here was a composite of
infant death rates, national
immunisation rates, and deaths from
injuries.
These are Organisation for Economic
Cooperation and Development
(OECD) countries on the y-axis. This vertical line is the average for the composite score for the
In This Lecture
1. Child health outcomes in NZ – international
comparisons, inequalities within NZ.
2. Determinants of health – a triple jeopardy.
3. Child rights.
4. Working together.
International comparisons
NZ Children’s Health and Safety – OECD
(infant deaths, immunisation rates, deaths from injuries)
UNICEF. An overview of child well-being in rich countries, 2007.
% OECD Average
NZ 24/25
MI Asher, Porritt Lecture, 3 November 2010 3
countries, scaled to 100%. The x-axis shows the distance from the average, with New Zealand
sitting here at 80% of the average, 24
th
out of 25 countries. Among these OECD countries our infant
death rates are the fourth worst; our immunisation rates the third worst, and our childhood deaths
from injury are the worst.
6. OECD
Last year the OECD published a
report – „Doing better for children‟
[2]. In regard to New Zealand they
specifically noted that we have the
highest rates of suicide among the 15-
19 year age group; child mortality is
higher than average; and
immunisation rates are poor
especially for measles and pertussis.
They went on to say that New
Zealand needs to take a stronger
policy focus on child poverty and
child health; that New Zealand spends
less than the OECD average on young
children; and that New Zealand should spend considerably more on younger, disadvantaged
children.
7. New Zealand Child and Youth
Epidemiology Service
In 2004 a big step forward was made
in understanding our child health
outcomes with the establishment of
the New Zealand Child and Youth
Epidemiology Service (NZCYES)
which published the first National
Indicators Report in 2007 [3]. I wish
to acknowledge the leadership and
outstanding work of Dr Liz Craig for
this service. For the first time we
have, for the whole of New Zealand,
standardised data on outcomes for key
indicators, analysed by deprivation,
ethnicity and trends over time. While there are some aspects of the report which are reassuring,
other aspects make concerning reading. I will be focussing on some concerning health areas, using
data mainly from NCZYES.
Outcomes for NZ Children are Weak in
Several Key Areas…
OECD. Doing better for children, 2009.
● Highest rates of suicide among the 15-19 year age group.
● Child mortality higher than average.
● Immunisation rates are poor especially for measles &
pertussis.
NZ needs to take a stronger policy focus on:
Child poverty and child health…
NZ spends less than the OECD average on young children…
NZ should spend considerably more on younger,
disadvantaged children.
New Zealand Child and Youth
Epidemiology Service 2004
Dr Liz Craig PhD
PSNZ
Māori SIDS Programme
University of Auckland
University of Otago
Funding: Ministry of Health &
District Health Boards
MI Asher, Porritt Lecture, 3 November 2010 4
8. International Comparisons
Using the NZCYES data we are able
to compare our rates for specific
diseases with other countries. I have
selected some serious bacterial
infections and respiratory diseases for
my focus. I have standardised the
rates for other countries to a value of
1 and have listed the OECD countries
where the data is available for these
diseases. Starting with meningococcal
disease the New Zealand relative rate
at the peak of the epidemic was 5 to
17 times greater than these other
countries, but now is on a par with
them, following natural decline in the epidemic and then the immunisation programme. Rheumatic
fever remains our worst indicator of our child health with our rates about 14 times the rates of other
comparable countries and on a par with places like India. Serious skin infections are double,
whooping cough 5 to 10 times, pneumonia 5 to 10 times, and bronchiectasis 8 to 9 times the rates in
other OECD countries. I will explain a bit more about three of these conditions.
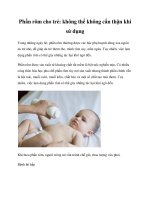
9. Rheumatic Fever
Streptococcal sore throats can cause
rheumatic fever which can damage
heart valves. The first picture shows a
streptococcal sore throat. The next
picture shows a normal heart valve.
The third picture shows a valve
damaged by rheumatic fever. This
valve can‟t close so blood goes
backwards as well as forwards
through it, putting the heart under
enormous strain, which can lead to
heart failure. Some young people with
rheumatic fever are too sick to work,
or even die at a young age [4].
Disease
Other OECD Countries
Relative Rate
NZ
Relative Rate
Meningococcal disease
1
(Australia, Canada, USA)
5-17 (1998)
1 (2007)
Rheumatic fever
1
(OECD)
13.8
Serious skin infections
1
(USA, Australia)
2
Whooping cough
1
(UK, USA)
5-10
Pneumonia
1
(USA)
5-10
Bronchiectasis
1
(Finland, UK)
8-9
Rates for Serious Bacterial Infections and
Respiratory Diseases: International Comparisons
Craig E, et al. NZCYES: Indicator Handbook. 2007.
Streptococcal sore throats can cause rheumatic fever which
can damage heart valves.
Rheumatic Fever
Damaged valve
which leaks
Strep sore throat Normal heart
valve
Too sick to work or
death e.g. aged 30 years
MI Asher, Porritt Lecture, 3 November 2010 5
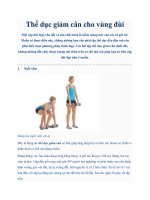
10. Bronchiectasis
Repeated or severe pneumonia can
cause permanent progressive lung
damage and scarring, called
bronchiectasis. The first picture
shows a child with severe
bronchiectasis – note the chest
deformity, and thinness due to his
disease. The second picture shows
normal lungs, but with the lobe at the
bottom right damaged with
bronchiectasis. The third picture
shows all lobes of the lung damaged
by bronchiectasis. In our New
Zealand children known to have
bronchiectasis, more than half of them have more than half their lung lobes affected by
bronchiectasis [5] leading to tiredness and chronic infection. Young people with severe
bronchiectasis may be too sick to work and may even die at a young age. More New Zealand adults
die prematurely from bronchiectasis than asthma. In New Zealand the national incidence of
bronchiectasis is „„too high‟‟ for a developed country [6].
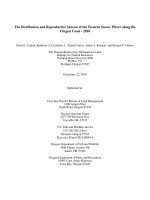
11. Serious Skin Infections
A scratch or an insect bite can
proceed to serious skin infection
where the flesh gets infected. This
does not cause permanent damage or
death. However it often means
intravenous antibiotics in hospital and
may result in surgery for abscesses.
Repeated or severe pneumonia can cause permanent
progressive lung damage = bronchiectasis.
Bronchiectasis
Child with
bronchiectasis
Normal lungs with
bronchiectasis
on bottom right
Bronchiectasis
all areas of the
lungs
Too sick to work or
death e.g. aged 35 years
A scratch or an insect bite can proceed to serious skin
infection where the flesh gets infected.
Impetigo
Serious skin infections
Serious Skin Infections
MI Asher, Porritt Lecture, 3 November 2010 6
12. International Comparisons
All these diseases except serious skin
infections can cause permanent
damage or premature death –
tragedies from really preventable
diseases.
13. Inequalities Within New
Zealand
14. Inequalities Within New
Zealand
Now I will look at the same diseases
by inequality within New Zealand,
using the New Zealand Deprivation
Score (NZDep) [7]. In the first
column is the risk of disease in the
most wealthy household areas in New
Zealand (NZDep 1), standardised to a
value of 1. In the last column is the
relative rate in the most deprived 10%
of household areas in New Zealand
(NZDep 10). You can see that in the
most deprived areas there are higher
rates, but look at how high they are
compared with the least deprived: meningococcal disease 5 times, rheumatic fever 28 times (a
shocking figure), serious skin infections 5 times, tuberculosis 5 times, gastroenteritis twice,
Disease
Other OECD Countries
Relative Rate
NZ
Relative Rate
Meningococcal disease
1
(Australia, Canada, USA)
5-17 (1998)
1 (2007)
Rheumatic fever
1
(OECD)
13.8
Serious skin infections
1
(USA, Australia)
2
Whooping cough
1
(UK, USA)
5-10
Pneumonia
1
(USA)
5-10
Bronchiectasis
1
(Finland, UK)
8-9
Rates for Serious Bacterial Infections and
Respiratory Diseases: International Comparisons
Craig E, et al. NZCYES: Indicator Handbook. 2007.
Inequalities within New Zealand
Hospitalisation for Serious Bacterial Infections
and Respiratory Diseases, Risk by
DEPRIVATION, 0-14 years, 2002-2006
Craig E, et al. NZCYES: Indicator Handbook. 2007.
Cause of Hospital Admission
Least Deprived
(NZDep1)
Most Deprived
(NZDep10)
Meningococcal disease
#
1
4.93
Rheumatic fever
1
28.65*
Serious skin infection
1
5.16
Tuberculosis
1
5.06
Gastroenteritis
1
2.00
Bronchiolitis
†
1
6.18
Pertussis
1
3.70*
Pneumonia
1
4.47
Bronchiectasis
1
15.58
Asthma
1
3.35
#
0-24 years;
†
<1 year; * NZDep9-10
MI Asher, Porritt Lecture, 3 November 2010 7
bronchiolitis 6 times, pertussis nearly 4 times, pneumonia 4 times, bronchiectasis 15 times and
asthma 3 times higher. These inequalities are in a supposedly egalitarian country. These differences
show us that there are two New Zealands – one which is healthy, and one which is not.
15. Serious Skin Infection
We see here the data presented in a
different way, for serious skin
infection as an example. It shows
nearly uniform rates in the most
advantaged neighbourhoods and how
the rates exponentially deteriorate in
the most disadvantaged 30% of our
neighbourhoods by New Zealand
Deprivation Score measurement.
16. Inequalities by Ethnicity
Now we will look at data by ethnicity.
In the first column are European
children, standardised to a rate of 1.
Māori are in the next column and
show double the rate for most
illnesses. If we look at certain
conditions such as rheumatic fever
(23 times), tuberculosis (11 times)
and bronchiectasis (4 times) the
difference is even higher for Māori
children. Pacific children are the
worst affected, with most rates nearly
four times those of European children.
Some conditions such as rheumatic
fever (nearly 50 times, the most shocking of all comparisons), serious skin problems (nearly 5
times), tuberculosis (45 times) and bronchiectasis (10 times) show extreme risks for Pacific
children. The Asian/Indian outcomes are similar to Europeans or even lower, except for
tuberculosis, probably reflecting high rates of tuberculosis in their countries of origin.
0
1
2
3
4
5
6
7
8
9
10
1
2
3
4
5
6
7
8
9
10
Rate
Ratio
NZDep Index Decile
Serious Skin Infection Hospital Admissions
0-14 Years by NZDep Decile, 2002-6
Craig E, et al. NZCYES: Indicator Handbook. 2007.
Hospitalisation for Serious Bacterial Infections
and Respiratory Diseases, Risk by ETHNICITY,
0-14 years, 2002-2006
Craig E, et al. NZCYES: Indicator Handbook. 2007.
Cause of Hospital Admission
European
Māori
Pacific
Asian/Indian
Meningococcal disease
#
1
2.13
4.05
0.31
Rheumatic fever
1
22.97
48.62
0.99
Serious skin infection
1
2.77
4.77
0.88
Tuberculosis
1
11.10
45.18
54.98
Gastroenteritis
1
0.88
1.45
1.10
Bronchiolitis
1
2.95
4.34
0.45
Pertussis
1
2.25
2.77
0.29
Pneumonia
1
2.04
5.07
1.05
Bronchiectasis
1
4.03
10.63
0.70
Asthma
1
2.19
3.14
1.14
#
0-24 years
MI Asher, Porritt Lecture, 3 November 2010 8
17. Serious Skin Infections by
Ethnicity
Here I illustrate the disparities in a
different way, for serious skin
infections as an example, illustrating
the disproportionate burden of this
disease on Pacific and Māori children.
18. Trends in Rheumatic Fever
This shows trends in rheumatic fever
first admissions from 1996 to 2005
[8]. Again, huge ethnic disparities are
illustrated. Of particular concern is
that while European rates are low and
declining, Māori and Pacific rates are
increasing.
19. Complex Origins
These problems have complex origins
and many influences. Positive family
influences including „good parenting‟
are a key to good child health, and
this is strongly influenced by parental
education. Dr Simon Denny in his
talk this afternoon showed how
teenagers do better if they are well
connected to their parents and school
[9]. In my talk I am going to focus on
broader societal influences – the
determinants of health.
Serious Skin Infection Hospital Admissions,
0-14 Years by Ethnicity, 2002-6
0
1
2
3
4
5
6
7
8
9
10
European
Māori
Pacific
Asian/Indian
Rate
Ratio
Ethnicity
Craig E, et al. NZCYES: Indicator Handbook. 2007.
Jaine R, et al. J Paediatr Child Health 2008; 44: 564-71.
Rheumatic Fever, Annual Rates of First
Admissions, 1996-2005
These problems have complex origins
- the determinants of health
MI Asher, Porritt Lecture, 3 November 2010 9
20. Professor Sir Geoffrey Rose
From an international perspective,
world renowned epidemiologist
Professor Sir Geoffrey Rose in his
landmark book „The Strategy of
Preventive Medicine‟ [10], stated that
“The primary determinants of disease
are mainly economic and social, and
therefore its remedies must also be
economic and social. Medicine and
politics cannot and should not be kept
apart.” He went on to say that
“Maternal educational achievement
is the single most important
determinant of child health.”
21. National Health Committee
In New Zealand in 1998, the National
Health Committee led by Professor
Robert Beaglehole produced this
report [11], and in it was stated that
“Social cultural and economic factors
are the most important determinants
of health. There are deficiencies in
income, education and housing in
New Zealand which contribute to ill
health and the marked ethnic
disparities.” They stated 12 years ago
that “there are immediate health
gains to be made by applying
information and knowledge that is
already available”, but little has been done to achieve these gains since this report came out.
22. Professor Sir Michael Marmot
In 2008 the WHO Report „Closing the
Gap in a Generation: Health Equity
through Action on the Social
Determinants of Health‟ was released,
led by Professor Sir Michael Marmot
[12]. This report discussed global
poverty and health and stated that
“Social injustice is killing people on a
grand scale.”
The primary determinants of disease
are mainly economic and social,
and therefore its remedies must
also be economic and social.
Medicine and politics cannot
and should not be kept apart.
Maternal educational achievement is
the single most important
determinant of child health
Professor Sir Geoffrey Rose, 1992
Social, cultural and economic factors
are the most important determinants
of health…
There are deficiencies in income,
education and housing which
contribute to ill health, and the
marked ethnic disparities…
There are immediate health gains to
be made by applying information and
knowledge that is already available.
Professor Robert Beaglehole et al, 1998
Social injustice is killing people on a
grand scale.
WHO. Closing the Gap in a Generation: Health Equity through Action on the Social Determinants of Health 2008
Professor Sir Michael Marmot et al, 2008
MI Asher, Porritt Lecture, 3 November 2010 10
23. Professor Sir Michael Marmot –
New Zealand
The evidence suggests that in New
Zealand, social injustice is killing and
maiming our children on a grand
scale.
24. Serious Skin Infections Tipping
Point
I am now going to look at time trends
within New Zealand for children‟s
diseases, focussing on serious skin
infections. The x-axis shows dates
from 1990 to 2006. From
approximately 1994 to 1995, through
to approximately 2000 there is a
doubling of the rate of serious skin
infections admissions. What could
cause a doubling of a rate of hospital
admission for a highly preventable
disease over a five year period? It
appears that there was a tipping point
at about 1994-5 after which there was a doubling of serious skin infections over 5 years. You will
see that since the rise little has changed. The rates are not continuing to increase, but are certainly
not going down. What has been going on?
25. Triple Jeopardy
From examination of the data I have
presented, and my own observations
in paediatric practice over the last 36
years I contend that many of the New
Zealand children who get sick with
the diseases I have mentioned are
affected by three factors which I have
called a triple jeopardy for their
health: poverty (25% of children);
poor quality housing (cold, damp,
overcrowded); and poor access to
primary health care.
Glasgow has some of the worst child
In New Zealand, social injustice is killing and
maiming our children on a grand scale.
2010
A Doubling of Serious Skin Infection
Hospital Admissions 1994-2000 Indicates a
Tipping Point for Child Health Around 1994
Tipping point
Craig E, et al. NZCYES: Indicator Handbook. 2007.
(years shown 1990-2006)
The ‘Triple Jeopardy’ for Health of Many
Children in New Zealand
1. Poverty – 25% of children.
2. Housing – cold, damp, overcrowded.
3. Primary health care – poor access.
MI Asher, Porritt Lecture, 3 November 2010 11
poverty in Europe. When I presented to their population health unit in 2004 it became apparent that
the very high rates of preventable diseases we are seeing in New Zealand are not occurring there.
Why not? Their poverty may not be as deep as ours; most housing is not damp and cold; and in the
United Kingdom children have access to free General Practitioner visits at all hours. Their
disadvantaged children have much better health outcomes than in New Zealand.
26. Jeopardy One – Poverty
27. Defining Poverty
Absolute poverty is a lack of
resources for the bare minimum
existence. For example, the children
in Haiti after the major earthquake,
the flood stricken families in Pakistan,
and many areas of Africa. Relative
poverty is defined by UNICEF as
“The twilight world where their
physical needs may be minimally met,
but they are excluded from the
activities that are considered normal
by their peers.” [13] Relative poverty
is what we are talking about in New
Zealand. Defined in economic way,
the definition that is used by the New Zealand government is less than 60% of the median national
household income after housing costs.
Jeopardy One
Poverty
Defining Poverty
● Absolute poverty: A lack of resources for the bare minimum
existence.
● Relative poverty: “The twilight world where their physical
needs may be minimally met, but they are excluded from
the activities that are considered normal by their peers.”
(UNICEF 2000)
In NZ Relative poverty = Less than 60% of the median
national household income after housing costs
(NZ Ministry of Social Development).
MI Asher, Porritt Lecture, 3 November 2010 12
28. A Practical Definition of
Poverty
In New Zealand a practical definition
of poverty is insufficient income for:
health care (transport, doctors fees,
prescription costs, hospital parking);
nutritious food; adequate housing (not
crowded, damp, cold or too costly);
clothing, shoes, bedding, washing &
drying facilities; and education (early
childhood education fees, transport,
stationery, school donations, exam
fees, school trips). As Rita Davenport,
talk-back host, once said „money is
not everything but its right up there
with oxygen‟.
29. Twice as Many in Poverty
This shows the percentage of children
in poverty, from 1982 to 2008 using
the New Zealand income definition
for poverty. In the 1980s 11-15% of
our children were in poverty – too
many, but the rate doubled from
1990-1992, and has remained at
approximately this level since. The
2009 rate is 25%. This is still
approximately double the 1980s rate.
There was a tipping point here
between 1990 and 1992 [14].
30. Time Trends in Poverty by
Ethnicity
This shows similar data by ethnicity.
Children in all ethnic groups have
been affected. They all started at
similar levels. European rates
doubled, and are coming down, but
they are still considerably higher than
the 1980s. Māori rates went over 40%
and have come down to some extent,
but are still more than twice the 1980s
rate. The line for Pacific children is
the most disturbing. Their rates
exceeded 50% and still remain about
40%, well above the other ethnic
groups and about twice the 1980s levels [15].
Insufficient income for:
● Health care (transport, doctors fees, prescription costs,
hospital parking).
● Nutritious food.
● Adequate housing (not crowded, damp, cold or too costly).
● Clothing, shoes, bedding, washing & drying facilities.
● Education (transport, stationery, school donations,
exam fees, school trips).
A Practical Definition of Poverty in
New Zealand
Percentage of New Zealand Children in
Poverty by Ethnicity, 1982-2004
Ministry of Social Development. 2007.
Tipping point
0
5
10
15
20
25
30
35
40
45
1980 1982 1984 1986 1988 1990 1992 1994 1996 1998 2000 2002 2004 2006 2008 2010
% Children
in Poverty
Year
Tipping point
Perry. Ministry of Social Development. 2010.
Twice As Many New Zealand Children Are in
Poverty* Now Compared With the 1980s
*Below 60% contemporary median household income after housing costs
MI Asher, Porritt Lecture, 3 November 2010 13
31. Estimate of New Zealanders in
Poverty
This shows a population pyramid for
New Zealand and the proportion of
the population in poverty in recent
years. The bars are 5 year age bands.
These bottom four bars are the child
age range 0-19 years. We see that
there is a large proportion of the child
population in poverty compared to
adults and the elderly. In New
Zealand, children are
disproportionately affected by
poverty.
32. Changes in Policy
There were many policy changes
whose cumulative effects contributed
to the tipping point and the sustained
poor outcomes [16]: Low wages and
relatively high taxes for the low paid;
family income support has been
maintained at an inadequate level for
low income families – there has been
no indexing of family income support
for 20 years (1989-2008) and in 1991
the universal family benefit was
abolished; and beneficiary families
are treated very harshly – in 1991
benefits were cut by 21% and have
not been restored in relative terms, and in 1996 the Child Tax Credit was introduced, excluding
children of beneficiaries (renamed the Working for Families In Work Tax Credit in 2007).
33. Living Standards 2004 by
Family Type and Income Source
These histograms show how children
in beneficiary families are very much
more likely to be in severe or
significant hardship than children in
families with a market income [17] –
more than 50% are in those
categories.
200 150 100 50 0 50 100 150 200
0-4 Years
5-9 Years
10-14 Years
15-19 Years
20-24 Years
25-29 Years
30-34 Years
35-39 Years
40-44 Years
45-49 Years
50-54 Years
55-59 Years
60-64 Years
65-69 Years
70-74 Years
75-79 Years
80-84 Years
85-89 Years
90-94 Years
95-99 Years
Population (1,000s)
Male Female
Estimate of New Zealanders in Poverty
Poverty
Several Changes in Policy Adversely Affecting
Incomes of Low Income Households With Children
● Low wages and relatively high taxes for the low paid.
● Family income support inadequate for low income families:
– No indexing of family income support for 20 years (1989-
2008).
– 1991: The universal family benefit abolished.
● Beneficiary families treated very harshly:
– 1991: Benefits cut by 21% and not restored relatively.
– 1996: Child Tax Credit introduced excluding children of
beneficiaries.
– 2007: Working for Families In Work Tax Credit.
Child Poverty Action Group. www.cpag.org.nz.
Ministry of Social Development. 2006.
Living Standards 2004: Families With Dependent
Children by Family Type and Income Source
32
6
31
5
25
16
33
6
15
24
9
17 17 17
19
10
21
6
28
2 2
26
0
1
0
7
11
15
0
5
10
15
20
25
30
35
Sole-parent beneficaries Sole-parent market
incomes
Two-parent beneficaries Two-parent market
incomes
Family type and income source
Population percentage
Left to right: Severe hardship, significant hardship, some hardship, fairly comfortable,
comfortable, good, very good living standards.
MI Asher, Porritt Lecture, 3 November 2010 14
34. Living Standards 2004 by
Ethnicity
These histograms show how more
Māori and even more Pacific children
are living in severe and significant
hardship than children of other
ethnicities [17].
35. The New Zealand Paradox
Many more income-tested beneficiary
families are in severe or significant
hardship while the elderly (supported
by the non-income tested
superannuation „benefit‟) are
protected [18].
36. Success in Protecting Older
People
Why has New Zealand been so
successful protecting older people
from poverty? We made income a
priority with New Zealand
Superannuation [19]. It is universal –
everyone gets it; it is not income-
tested; it is simple and adequate; it
does not change with work status; it
does not reduce in hard times; it is
linked to prices and wages (indexed);
and we don‟t judge people receiving
it. None of these characteristics apply
to the income support provided to
families with dependent children.
20
30
4
8
10
12
12
11
14
19
10
11
17
18
20
18
23
12
24
24
12
9
24
22
4
0
5
6
0
5
10
15
20
25
30
35
Māori
Pacific Other European
Family ethnicity
Population Percentage
Ministry of Social Development. 2006.
Left to right: Severe hardship, significant hardship, some hardship, fairly comfortable,
comfortable, good, very good living standards.
Living Standards 2004: Families With Dependent
Children by Ethnicity
Ministry of Social Development. 2009 (data from before onset of recession).
The New Zealand Paradox:
Many more children in beneficiary families are in severe or significant
hardship while the elderly (supported by superannuation) are protected
Left to right: Severe hardship, significant hardship, some hardship, fairly comfortable,
comfortable, good, very good living standards.
26
4
2
21
6
2
18
10
3
19
20
1010
25
23
5
26
46
0
10
14
0
10
20
30
40
50
Income-tested benefit Market <65 65+
Population Percentage
Why Has New Zealand Been So Successful
in Protecting Older People From Poverty?
We made income a priority with NZ Superannuation:
● Universal – everyone gets it.
● Not income-tested.
● Simple & adequate.
● Does not change with work status.
● Does not reduce in hard times.
● Linked to prices and wages (indexed).
● We don‟t judge.
Source: Susan St John
MI Asher, Porritt Lecture, 3 November 2010 15
In contrast, New Zealand Government support of children in low income families is not a success
story. In fact we had a relatively high (by current standards) level of support up to the 1980s. Since
that time the level of support has decreased for the lowest income families, underpinning the graphs
I have shown you.
37. Expenditure on Superannuation
and Main Benefits
This histogram illustrates the
preference New Zealand has for
looking after the elderly through
superannuation „benefit‟ compared
with those on income-tested benefits,
of whom the most vulnerable are our
children [20, 21]. Note how little the
„main benefits‟ have changed, while
superannuation goes up and up. It is
the same society but there is
differential treatment by age.
38. Income-Tested Benefits, 1986-
2008
This graph shows the number of
individuals on income tested benefits
from 1986 to 2009 [14].
Expenditure on New Zealand
Superannuation & Main Benefits
0
1,000
2,000
3,000
4,000
5,000
6,000
7,000
8,000
9,000
10,000
2004 2005 2006 2007 2008 2009 2010 2011
$ Millions
(Nominal)
New Zealand Superannuation
Main Benefits
Year
Source of slide: Alan Johnson
Number of Individuals in Receipt of Working Age
Income-tested Benefits, 1986-2009
Perry. Ministry of Social Development. 2010.
Numbers on the DPB are fairly constant but the sickness and invalid
benefits show increases
0
100
200
300
400
500
1984 86 88 90 92 94 96 98 00 02 04 06 08 2010
Number
Receiving
(000s)
Total working age
UB
DPB
SB/IB
Year
MI Asher, Porritt Lecture, 3 November 2010 16
39. Income-Tested Benefits, 1986-
2008
Note that after benefits were cut by
21% in 1991 there was no reduction
in numbers on the Domestic Purposes
Benefit or sickness and invalid
benefits [14]. Cutting benefits did not
push people into work – it resulted in
more children in hardship.
40. The 1990s New Zealand
Experiment
I contend that the 1990s New Zealand
experiment of a stick (benefit cuts)
rather than a carrot (increased wages
and lower taxes for the low paid)
failed, and damaged our children.
Cutting benefits does not incentivise
parents to take up paid work for many
reasons including: their children need
their presence and care; child care is
not accessible or affordable; there are
few jobs with child friendly hours of
work; there are often few jobs
available within practical travel
distance; and available jobs are too lowly paid or insecure. These are the issues that need to be
adequately addressed to incentivise parents who are at home caring for their children into paid
work.
41. The Spirit Level
This recent publication, „The Spirit
Level‟ by Richard Wilkinson and
Kate Pickett (2009), describes the far
reaching effects of income inequality
on societal indicators of health and
well being [22]. The measure they use
is the ratio of the income share of the
richest 20% of country population to
the poorest 20%.
The 1990s New Zealand Experiment of a Stick
(benefit cuts) Rather Than a Carrot (increased
wages and lower taxes for the low paid) Failed,
and Damaged Our Children
Cutting benefits does not incentivise parents to take up paid
work for many reasons including:
● Their children need their presence and care.
● Child care is not accessible or affordable.
● There are not jobs at child friendly hours.
● There is not local availability of jobs.
● Jobs are too lowly paid, or insecure.
Within Country Income Inequality
The measure (World Bank):
The ratio of the income share of the
richest 20% of country population to
the poorest 20%.
Number of Individuals in Receipt of Working Age
Income-tested Benefits, 1986-2009
Perry. Ministry of Social Development. 2010.
Numbers on the DPB are fairly constant but the sickness and invalid
benefits show increases
0
100
200
300
400
500
1984 86 88 90 92 94 96 98 00 02 04 06 08 2010
Number
Receiving
(000s)
Total working age
UB
DPB
SB/IB
Year
No decrease in numbers on
DPB & SB/IB after 1991 cuts
MI Asher, Porritt Lecture, 3 November 2010 17
42. Spirit Level Graph
Here is a graph from that book which
looks at health and social problems in
countries by their within-country level
of inequality. This index of health and
social problems includes the 10 issues
listed at the left of the graph.
43. Spirit Level Graph – New
Zealand
Among OECD countries New
Zealand (shown with ellipse) has high
inequality, with high rates of health
and social problems.
44. 2010 Tax Changes
Unfortunately the 2010 tax changes
are likely to only increase inequality,
potentially harm more children, and
be worse for the health and well being
of our society.
New Zealand Herald, Page 1, 10 February 2010.
The 2010 Tax Changes Will Only Increase
Inequality and Potentially Harm More Children
MI Asher, Porritt Lecture, 3 November 2010 18
45. Jeopardy Two – Housing
46. Main Issues
In New Zealand we have two main
issues for housing – crowding and
quality.
47. Meningococcal Disease and
Housing
For centuries it has been known that
adequate housing is necessary for
health. During our meningococcal
epidemic, household crowding was
shown to be the strongest risk factor
for meningococcal disease – adding 6
adults to a household of 2 to 3 adults
increased the rate of meningococcal
disease nearly 11 times [23]. This
research was a turning point in
changing housing policies in New
Zealand and stimulated more housing
research. Why have we have got such
a housing problem in New Zealand?
Jeopardy Two
Housing
Housing: 2 main issues
1. Crowding.
2. Quality – cold and damp.
Family of 2-3 adults living in a 6 room house
Additional adults Risk of meningococcal disease
2x
5x
10.7x
Baker M, et al. Ped Inf Dis J 2000.
Meningococcal Disease:
Risk from household crowding
MI Asher, Porritt Lecture, 3 November 2010 19
48. Housing Quality
300,000 New Zealand homes are
wooden, un-insulated, damp and cold.
Insulation for new housing became
compulsory only in 1978. Cold damp
homes can cause ill health, and cost a
lot to heat. Heating costs can be
unaffordable for low income families,
so they live in the cold. Low income
families may double up to reduce
costs of rent and heating, leading to
household crowding.
49. Housing Quality
Since 2001 some healthy housing
programmes have been implemented
and evaluated, showing good health
improvements. Leading examples of
this research have been healthy homes
in the Wellington region which
improved self-rated health, self-
reported wheezing, days off school
and work, and visits to general
practitioners as well as showing a
trend for fewer hospital admissions
for respiratory conditions [24]; and
healthy housing (Auckland and
Northland regions) which resulted in
a 37% lower rate of housing-related potentially avoidable hospitalisations. The largest decrease for
the latter study was for respiratory conditions in children [25]. A further study showed that
insulation and non-polluting, more effective heating in the homes of children with asthma
significantly reduced their symptoms, days off school and healthcare visits [26].
50. Housing Quality
By 2008, less than half of old state
houses had been retrofitted with
insulation, but a commitment was
made to complete retrofitting for all
state houses by 2013. For private
accommodation, subsidies are
available such as EECA Energywise,
Warm up counties and Snug homes,
but there is no compulsion to improve
the quality of private homes including
rental accommodation.
300,000 New Zealand homes are wooden, un-insulated,
damp and cold.
Cold damp homes can:
● Cause ill health.
● Cost a lot to heat – unaffordable for low income families.
1978: Insulation for new housing became compulsory.
Housing Quality
Since 2001 some healthy housing programmes have been implemented and
evaluated, showing good health improvements:
● Healthy homes (Wellington region) improved self-rated health, self-
reported wheezing, days off school and work, and visits to general
practitioners as well as showing a trend for fewer hospital admissions for
respiratory conditions. (Howden Chapman P, et al 2007.)
● Healthy housing (Auckland & Northland region) – 37% lower rate of
housing-related potentially avoidable hospitalisations. Largest decrease
especially for respiratory conditions in children. (Jackson G. et al.2007)
● Healthy heating Insulation and non-polluting, more effective heating in the
homes of children with asthma significantly reduced their symptoms, days
off school and healthcare visits. (Howden Chapman P, et al 2009.)
Improved Housing Quality Helps Health
By 2008, less than half of old state houses had been
retrofitted with insulation, but a commitment was made
to complete retrofitting for all state houses by 2013.
For other houses, subsidies are available such as:
● EECA Energywise.
● Warm up counties.
● Snug homes.
Housing Quality
MI Asher, Porritt Lecture, 3 November 2010 20
51. Jeopardy Three – Primary
Care Access
52. Janet Frame
The importance of no fee for health
care is illustrated in Janet Frame‟s
posthumous publication „Towards
another summer‟ [27]. She writes
about Michael Savage, Prime
Minister from 1935 to 1940 who
introduced the Welfare State with free
GP visits and hospital stays:
“Grace said…I always think of
Mickey Savage as the great New
Zealand Prime Minister. She
remembered the huge photograph
which covered one wall of their
kitchen at home; his gentle face
smiling, un-scribbled upon, because even as children they had revered him – they could never
forget the moments of pure happiness when the notice came from the Health Department that
medical and hospital attention were to be free, free, and their father had collected all the unpaid
hospital and doctor’s bills, brushed the dust from their windows, opened them, smoothed them, read
them aloud, shuffled them into a pile, and with a shout of joy, puckered the ring from the stove and
thrust them into the fire.”
Jeopardy Three
Primary health care access
Access to Primary Care
MI Asher, Porritt Lecture, 3 November 2010 21
53. General Practitioner Visits –
International Comparisons
While more New Zealand children
now have free access to General
Practitioner visits, especially under 6
years, this is not the experience for
many families who may have high
fees to pay, especially after hours
[28]. This table demonstrates how
costly some General Practitioner
visits may be for New Zealand
children compared with some other
countries, where no fee, or a low fee,
is the norm.
54. Direct Cost Of Primary Care
Visits For Children
The Ministry of Health‟s 2005 After
Hours Primary Health Care Working
Party noted that “High fees for after
hours services create access barriers
for patients, who may delay seeking
the urgent primary health care
treatment they require” [28]. In the
global context there are two recent
statements expressing concern about
user fees for children: Médecins sans
Frontières, in their 2008 publication
„No cash No care. How user fees
damage health‟ [29] stated that “The
people most excluded from primary health care are the poor.” The United Nations in their 2009
publication „Great leap forward on free healthcare‟ [30] stated that “User fees punish the most
vulnerable members of society, especially women and children.” Among New Zealand children we
have the disease levels of developing countries, so these statements intended for the developing
world may have some relevance in our context.
55. Under 6 Years
A Ministry of Health report on after
hours fees presented to Cabinet in
October 2007 stated that “the
problem of after-hours fees is more
widespread than previously thought”
and identified 119 locations where
after hours consultations for children
under the age of six cost more than
$15, and 20 clinics which charged at
least $41 [31]. Although by 2010
nearly 80% of practices were
providing free care to the children
Direct Cost of General Practitioner Visits
For Children
New
Zealand
UK and Europe
(excluding Ireland)
Canada
Australia
In hours
(25% of the week)
$0-$33
$0
$0
$0-$7.50 for a
$50 visit
Out of hours
(75% of the week)
$0-$120
$0
$0
$0-$7.50 for a
$50 visit
Data from 2008
Ministry of Health (NZ) 2005, After Hours Working Party:
“High fees create access barriers, patients may delay
seeking urgent primary health care treatment.”
Médecins Sans Frontières 2008, No cash No care. How
user fees damage health:
“The people most excluded from primary health care are
the poor.”
United Nations 2009, Great leap forward on free healthcare:
“User fees punish the most vulnerable members of
society, especially women and children.”
Direct Cost of Primary Care Visits For
Children
Under 6 Years:
Ministry Survey for Cabinet in 2008
● 50 clinics charged more than $15 for casual child patients.
● 19 charged this even for those enrolled with a Public
Health Organisation.
● 10 clinics charged at least $41.
Obtained by Tony Ryall MP under the Official Information Act
in 2008.
MI Asher, Porritt Lecture, 3 November 2010 22
under six years (in hours), reducing cost barriers to primary care access for young children should
remain an important target [32].
56. Immunisations
As we know, immunisations are one
of the most cost-effective public
health interventions. This table shows
our track record in New Zealand – our
rates for full immunisation at 2 years
over the last 19 years. Although there
have been some improvements, our
rates are still lower than planned for,
despite repeated Ministry goals to
increase them to at least 90% [33, 34].
There has been only slight
improvement since the national
immunisation register was introduced
in 2005, demonstrating that we cannot rely on this register alone to increase our coverage. It is vital
to address other factors as well. Recently making childhood immunisation a national health target
has helped to boost the rates, showing we can rapidly improve if this issue is properly championed.
As UNICEF states (1), national immunisation rates serve as a measure of the comprehensiveness of
preventative health services for children. Immunisation rates also serve as a measure of the national
commitment to primary health care for all children. We clearly have been doing poorly, and to date
we are not doing well enough, but there are encouraging signs of progress.
57. The Way Forward
The way forward is to work together
towards eliminating disparities.
New Zealand Immunisation Rates
A measure of national commitment to primary
health care for all children.
Ministry of Health data – fully immunised at 2 years of age:
Year
New Zealand Average
(Target 95%)
Ministry of Health Plan
1991/2
56%
● 85% full immunisation by 1997.
● With Māori equalling non-Māori.
● Then 95% by 2000.
1999
63.1%
● 90% by 2003.
2005
77.4%
● 95% but no target date provided.
June 2008
78%
June 2009
80%
June 2010
86%
● 85% by July 2010.
● 90% by July 2011.
● 95% by July 2012.
The Way Forward
Work together towards eliminating disparities.
MI Asher, Porritt Lecture, 3 November 2010 23
58. Child Rights – New Zealand
Context
When we have difficulties achieving
consistently good outcomes for our
children, we can look to reference
points in New Zealand society to
guide us.
The Treaty, declarations and
legislation provide reference points
for us to work together for the benefit
of children.
59. Treaty of Waitangi
In the Treaty of Waitangi, the
founding document of New Zealand,
Māori ceded to the Queen a right of
governance in return for the promise
of royal protection and citizenship –
that is, equality of opportunity.
However as we are all well aware, the
spirit of the Treaty has not always
been followed. There are examples in
health.
60. Hauora
Papaarangi Reid and Bridget Robson
in 2007 [35] wrote that there are
“…consistent, comprehensive and
compelling disparities in health
outcomes and exposure to the
determinants of ill-health.” They went
on to say that “despite the strength of
these longstanding heath inequalities,
they do not create dismay, disbelief or
horror. They have become expected.
This acceptance and normalisation of
inequalities provides an excuse for
government inaction.”
Child Rights – New Zealand Context
● Te Tiriti o Waitangi.
● UNCROC: United Nations Convention on the Rights of the
Child.
● Rights of Indigenous Peoples.
● Human Rights.
1840 Te Tiriti o Waitangi
…consistent, comprehensive and
compelling disparities in health
outcomes and exposure to the
determinants of ill-health.
…despite the strength of these
longstanding heath inequalities, they
do not create dismay, disbelief or
horror.
They have become expected.
This acceptance and normalisation of
inequalities provides an excuse for
government inaction.
Drs Papaarangi Reid & Bridget Robson, 2007
MI Asher, Porritt Lecture, 3 November 2010 24
61. Encircled Lands
We have a lot to learn from history,
even recent history. Judith Binney‟s
award winning book „Encircled
Lands‟ [36] catalogues the history of
Tūhoe from 1820 to 1921. I will
illustrate the effects of one of the
determinants of health – nutrition.
Malnutrition makes children
especially vulnerable to infections.
62. Encircled Lands
In 1866 large tracts of coastal land
were illegally confiscated by the
Crown. As the Waitangi Tribunal
wrote “The best agricultural land of
the Tūhoe tribal estate (14,000 acres)
was taken. Most of the land behind
the confiscation line was unsuitable
for farming, being inland hills, valleys
and gorges.” Crop failures in the
more mountainous terrain followed
this theft, leading to episodes of
famine among Tūhoe.
63. Tutukangahau
In „Encircled Lands‟, Judith Binney
wrote that Tutukangahau, a Tūhoe
chief, whose 7 year old grand-
daughter died (probably of measles)
at Te Whaiti during a famine on 13
September 1897 cried out during the
procession to bring her home to
Maungapohatu: “This dying of our
young people is a new thing. In
former times our people… scarce
knew disease; they died on the battle
field or of old age… These diseases
which slay our people were brought
by the white man. They brought the
epidemics, the influenza, scabs, measles, fever ‟
Judith Binney
Encircled Lands. Te Urewera 1820-1921
Land Confiscated, 17 January 1866
Confiscation line
Maungapohatu
“The best agricultural land of the Tūhoe tribal estate (14,000 acres) was taken.
Most of the land behind the confiscation line was unsuitable for farming,
being inland hills, valleys and gorges.” (Waitangi Tribunal)
Tutukangahau, a Tūhoe chief, whose 7 year old
granddaughter died of measles at Te Whaiti during a famine
(a legacy of fertile lands stolen by government) on 13
September 1897 cried out during the procession to bring her
home to Maungapohatu:
“This dying of our young people is a new thing. In former
times our people… scarcely knew disease; they died on
the battle field or of old age… These diseases which slay
our people were brought by the white man. They brought
the epidemics, the influenza, small pox, the measles…”
MI Asher, Porritt Lecture, 3 November 2010 25
64. Te Puea
Another determinant of health is
access to health care. In his biography
of Te Puea [37], Michael King
writing about Waikato Māori in 1906
said “There were few doctors who
would attend Māori patients, and no
hospitals to admit them and no
preventive health measures. The
nearest hospitals were in Auckland
and Hamilton, but they rarely took
Māori patients and did not want to.”
65. King History
King went on to report in The
Penguin History of New Zealand [38]
that “for a long time the official
attitude to problems of Māori health
and welfare was to ignore them. The
Auckland Health Officer in whose
district the bulk of the Māori
population lived stated in 1911, that
Māori health should be of concern to
Europeans – but only because the
unchecked spread of Māori diseases
could eventually lead to Europeans
contracting them. As matters stand,”
he wrote, “the Native race is a
menace to the wellbeing of the European.” Contrast this view with the lament from Tutukangahau
only 14 years earlier.
Fortunately there have been massive improvements in Māori health since then. However there is
still room for improvement. We can appreciate that in recent history there were hardened racist
attitudes against Māori by doctors. There is prejudice in our European whakapapa.
1977
2003