Báo cáo khoa học: Protein crystallography for non-crystallographers, or how to get the best (but not more) from published macromolecular structures potx
Bạn đang xem bản rút gọn của tài liệu. Xem và tải ngay bản đầy đủ của tài liệu tại đây (912.9 KB, 21 trang )
REVIEW ARTICLE
Protein crystallography for non-crystallographers, or how
to get the best (but not more) from published
macromolecular structures
Alexander Wlodawer
1
, Wladek Minor
2,3
, Zbigniew Dauter
4
and Mariusz Jaskolski
5,6
1 Macromolecular Crystallography Laboratory, NCI, Frederick, MD, USA
2 Department of Molecular Physiology and Biological Physics, University of Virginia, Charlottesville, VA, USA
3 Midwest Center for Structural Genomics, USA
4 Macromolecular Crystallography Laboratory, NCI, Argonne National Laboratory, IL, USA
5 Department of Crystallography, Adam Mickiewicz University, Poznan, Poland
6 Center for Biocrystallographic Research, Institute of Bioorganic Chemistry, Polish Academy of Sciences, Poznan, Poland
Introduction
Macromolecular crystallography has come a long way
in the half-century since the first protein structure (of
myoglobin at 6 A
˚
resolution) [1] was published. The
establishment of the Protein Data Bank (PDB) [2,3] as
the single repository for crystal structures (and later
structural models obtained by NMR spectroscopy,
fiber diffraction, electron microscopy, and some other
techniques) provided a unique resource for the scien-
tific community. The pace of structure determination
has accelerated in the last decade due to the introduc-
tion of powerful new algorithms and computer pro-
grams for diffraction data collection (these days,
usually synchrotron-based), structure solution, refine-
ment, and presentation. Of particular importance are
structural genomics (SG) efforts conducted in a num-
ber of centers worldwide, which can be credited with
at least 3500 deposited crystal structures as of Septem-
ber 2007 (W. Minor, unpublished data). Although the
total number of protein folds that can be found in nat-
ure is still under debate [4] and the structures of many
proteins, especially those integral to cell membranes,
are still lacking, the gaps in our knowledge are being
Keywords
protein crystallography; Protein Data Bank;
restraints; resolution; R-factor; structure
determination; structure interpretation;
structure quality; structure refinement;
structure validation
Correspondence
A. Wlodawer, Protein Structure Section,
Macromolecular Crystallography Laboratory,
NCI at Frederick, Frederick, MD 21702, USA
Fax: +1 301 846 6322
Tel: +1 301 846 5036
E-mail:
(Received 1 October 2007, revised
1 November 2007, accepted 5 November
2007)
doi:10.1111/j.1742-4658.2007.06178.x
The number of macromolecular structures deposited in the Protein Data
Bank now exceeds 45 000, with the vast majority determined using crystal-
lographic methods. Thousands of studies describing such structures have
been published in the scientific literature, and 14 Nobel prizes in chemistry
or medicine have been awarded to protein crystallographers. As important
as these structures are for understanding the processes that take place in
living organisms and also for practical applications such as drug design,
many non-crystallographers still have problems with critical evaluation of
the structural literature data. This review attempts to provide a brief out-
line of technical aspects of crystallography and to explain the meaning of
some parameters that should be evaluated by users of macromolecular
structures in order to interpret, but not over-interpret, the information
present in the coordinate files and in their description. A discussion of the
extent of the information that can be gleaned from the coordinates of
structures solved at different resolution, as well as problems and pitfalls
encountered in structure determination and interpretation are also covered.
Abbreviations
PDB, Protein Data Bank; SG, structural genomics.
FEBS Journal 275 (2008) 1–21 Journal compilation ª 2007 FEBS. No claim to original US government works 1
filled quite rapidly. It is now possible to download,
with a few clicks of a mouse, the structure of a protein
of interest and display it using a variety of graphics
programs, freely available to anyone with even the
simplest modern computer. Once presented as an ele-
gant picture, the structure seems beyond suspicion as
to its validity, or perhaps the validity of its interpreta-
tion by its authors. But is that always the case?
An assessment of the quality of macromolecular
structures, corrected for technical difficulty, novelty,
size, resolution, etc., has recently been published [5].
The authors of that study concluded that, on average,
the quality of protein structures has been quite con-
stant over the last 35 years, and there is little differ-
ence in quality between structures solved in traditional
laboratories and by SG efforts (if anything, the latter
are slightly better, at least from some centers). How-
ever, a very clear correlation emerged between the
quality of the structure and the prestige of the journal
in which it was published, with structures in the most
exclusive journals being, in general, of statistically
lower quality (interestingly, structures published in this
journal were found to be, on average, of the highest
quality). Of course, the high-impact journals put a
proper spin on these results, relating them to the
higher complexity of the structures that they accept for
publication [6]. However, as interpretation of these
structures is at the forefront of structural biology, it is
important that readers should be able to assess their
quality independently.
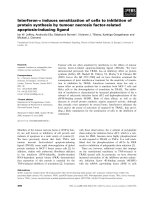
The structure of the enzyme frankensteinase (appro-
priately named after the birthplace of one of the
authors of this review, and for some other rather obvi-
ous reasons) is presented in Fig. 1A. It certainly looks
quite nice, especially to a non-crystallographer, but it
does have a few problems, the main one being that no
such enzyme exists. However, how could a biochemist
or biologist who is not trained in protein crystallo-
graphy (and, these days, practically nobody is fully
trained in this field) recognize this? The purpose of this
review is to provide readers with hints that may help
them in assessing the level of validity and detail pro-
vided by crystal structures (and, to a lesser extent,
structures determined by other techniques), define sev-
eral relevant terms used in crystallographic papers, and
give advice on where to find red flags that could affect
interpretation of such data. This is not a primer of
protein crystallography for non-crystallographers, but
rather the musings of four structural biologists, active
in various aspects of crystallography, both technical
and biological, with a combined total of over 125 years
of experience, written for the benefit of those that do
not want or need to learn about all the details that go
into the solution and refinement of macromolecular
structures, but would like to gain confidence in their
interpretation.
How is a crystal structure determined?
Structural crystallography relies almost exclusively on
the scattering of X-rays by the electrons in the mole-
cules constituting the investigated sample. (Some other
scattering methods, for example, of neutrons or elec-
trons, although very important, are responsible for
only a tiny fraction of the published macromolecular
structures.) Because the highly similar structural motifs
forming the individual unit cells are repeated through-
out the entire volume of a crystal in a periodic fashion,
it can be treated as a 3D diffraction grating. As a
result, the scattering of X-radiation is enhanced enor-
mously in selected directions and extinguished com-
pletely in others. This is governed only by the
geometry (size and shape) of the crystal unit cell and
the wavelength of the X-rays, which should be in the
same range as the interatomic distances (chemical
bonds) in molecules. However, the effectiveness of
interference of the diffracted rays in each direction,
and therefore the intensity of each diffracted ray,
depends on the constellation of all atoms within the
unit cell. In other words, the crystal structure is
encoded in the diffracted X-rays – the shape and sym-
metry of the cell define the directions of the diffracted
beams, and the locations of all atoms in the cell define
their intensities. The larger the unit cell, the more dif-
fracted beams (called ‘reflections’) can be observed.
Moreover, the position of each atom in the crystal
structure influences the intensities of all the reflections
and, conversely, the intensity of each individual reflec-
tion depends on the positions of all atoms in the unit
cell. It is, therefore, not possible to solve only a
selected, small part of the crystal structure without
modeling the rest of it, in contrast to other structural
techniques such as NMR or extended X-ray absorp-
tion fine structure which can describe only part of the
molecule.
A diffraction experiment involves measuring a large
number of reflection intensities. Because crystals have
certain symmetry, some reflections are expected to be
equivalent and thus have identical intensity. The aver-
age number of measurements per individual, symmetri-
cally unique reflection is called redundancy or
multiplicity. Because every reflection is measured with
a certain degree of error, the higher the redundancy,
the more accurate the final estimation of the averaged
reflection intensity. The spread of individual intensities
of all symmetry-equivalent reflections, contributing to
Protein crystallography for non-crystallographers A. Wlodawer et al.
2 FEBS Journal 275 (2008) 1–21 Journal compilation ª 2007 FEBS. No claim to original US government works
the same unique reflection, is usually judged by the
residual R
merge
(sometimes called R
sym
or R
int
), defined
later.
Each reflection is characterized by its amplitude and
phase. However, only reflection amplitudes can be
obtained from the measured intensities and no direct
information about reflection phases is provided by the
diffraction experiment. According to the well-estab-
lished diffraction theory, to obtain the structure of the
individual diffracting motif (in our case the distribu-
tion of electrons in the asymmetric part of the crystal
unit cell), it is necessary to calculate the Fourier trans-
formation of the so-called structure factors, or F val-
ues, which represent the reflection amplitudes and
phases. Several methods are used in protein crystallo-
graphy to determine the phases. Typically, they lead to
an initial approximate electron-density distribution in
the crystal, which can be improved in an iterative fash-
ion, eventually converging at a faithful structural
model of the protein.
The primary result of an X-ray diffraction experi-
ment is a map of electron density within the crystal.
A
B
Fig. 1. Crystal structure of the enzyme frankensteinase. (A) A stereoview showing a tracing of the protein chain in the common rainbow col-
ors (slowly changing from blue N-terminus to red C-terminus). Active site residues are in ball-and-stick rendering, the Mg
2+
ion is shown as
a gray ball, and water molecules as red spheres. Frankensteinase was conceived and refined with
COOT [22] and drawn with PYMOL [21]. (B)
Detail of the Mg
2+
binding site. Atoms are shown in ball-and-stick rendering, with carbon atoms colored green, oxygen red, and nitrogen
blue. A few problems with this structure need to be emphasized. (a) No such protein has ever existed or is likely to exist in the future. (b)
The coordinates were freely taken from several real proteins, but were assembled in a way that would satisfy only M. C. Escher. (c) An
‘active site’ consisting of the side chains of phenylalanine, leucine, and valine is rather unlikely to have catalytic properties. (d) Identification
of a metal ion that is not properly coordinated by any part of the protein is rather doubtful. (e) The distances between the ion and the coordi-
nating atoms are shown with four decimal digit precision, vastly exceeding their accuracy. Besides, the ‘bond’ distances are entirely unac-
ceptable for magnesium. PDB accession code: For obvious reasons the model of frankensteinase was not deposited in the PDB. It can be
obtained upon request from the corresponding author.
A. Wlodawer et al. Protein crystallography for non-crystallographers
FEBS Journal 275 (2008) 1–21 Journal compilation ª 2007 FEBS. No claim to original US government works 3
This electron distribution is usually interpreted in
(chemical) terms of individual atoms and molecules,
but it is important to realize that the molecular model
consisting of individual atoms is already an interpreta-
tion of the primary result of the diffraction experi-
ment. Finally, the atomic model is ‘refined’ by varying
all model parameters to achieve the best agreement
between the observed reflection amplitudes (F
obs
) and
those calculated from the model (F
calc
). This agreement
is judged by the residual or crystallographic R-factor,
defined later. It should be stressed that both R
merge
and the R-factor are global indicators, showing the
overall agreement, respectively, between equivalent
intensities or observed and calculated amplitudes, and
cannot be used to pinpoint individual poorly measured
reflections or local incorrectly modeled structural fea-
tures.
The refinement process usually involves alternating
rounds of automated optimization (e.g. according to
least-squares or maximum-likelihood algorithms) and
manual corrections that improve agreement with the
electron-density maps. These corrections are necessary
because the automatically refined parameters may get
stuck in a (mathematical) local minimum, instead of
leading to the global, optimum solution. The model
parameters that are optimized by a refinement pro-
gram include, for each atom, its x, y and z coordi-
nates, and a parameter reflecting its ‘mobility’ or
smearing in space, known as the B-factor (or displace-
ment parameter, sometimes referred to as ‘temperature
factor’). B-factors are usually expressed in A
˚
2
and
range from 2to 100. [If their values in the PDB
files are systematically lower than 1.0, they should be
multiplied by 80 (8p
2
) to be brought to the B scale.]
The B-factor model used is usually isotropic, i.e.
describes only the amplitude of displacement, but
more elaborate models describe the individual aniso-
tropic displacement of each atom. Even in the iso-
tropic approximation, crystallographic models of
macromolecules are tremendously complex. For exam-
ple, a protein molecule of 20 kDa would take about
6000 parameters to refine! Frequently, the number of
observations (especially at low resolution, vide infra)is
not quite sufficient. For this reason, refinement is car-
ried out under the control of stereochemical restraints
which guide its progress by incorporating prior knowl-
edge or chemical common sense [7,8]. The most popu-
lar libraries of stereochemical restraints (their
standard or target values) have been compiled based
on small-molecule structures [9–11] but there is grow-
ing evidence from high-quality protein models that the
nuances of macromolecular structures should also be
taken into account [12].
Another way of model refinement, introduced more
recently into macromolecular crystallography, involves
dividing the whole structure into rigid fragments and
expressing their vibrations in terms of the so-called
TLS parameters which describe the translational, libra-
tional and screw movements of each fragment [13].
Selection of rigid groups should be reasonable, corre-
sponding to individual (sub)domains, for example. An
exceedingly large number of very small fragments
unreasonably increases the number of refined parame-
ters and leads to models not fully justified by the
experimental data.
Although many of the steps in crystal structure anal-
ysis have been automated in recent years, the interpre-
tation of some fine features in electron-density maps
still requires a significant degree of human skill and
experience [14]. A degree of subjectivity is thus inevita-
ble in this process and different people working with
the same data may occasionally produce slightly differ-
ent results. This review is primarily intended to advise
those who do not have a deep knowledge of crystallo-
graphy, but need to know how the objectivity and sub-
jectivity embedded in the available crystal structures
should be balanced. Detailed procedures used in mac-
romolecular crystallography are explained in a number
of books, some describing them in more advanced
terms [15,16], other in simpler ways [17,18].
Electron-density maps and how to
interpret them
As mentioned earlier, electron-density maps are the
primary result of crystallographic experiments, whereas
the atomic coordinates reflect only an interpretation of
the electron density. Although maps based on the
initial experimentally derived phases are sometimes
analyzed only by software rather than human eye (a
practice that the authors of this review very strongly
oppose), we still need to understand what to expect
from them.
The basic electron-density map can by calculated
numerically by Fourier transformation of the set of
observed (experimental) reflection amplitudes F
obs
and
their phases. However, because the phases, u
calc
, are
not available experimentally, they are calculated from
the current model. Such a (F
obs
, u
calc
) map represents
an approximation of the true structure, depending on
the accuracy of the calculated phases, that is, on how
good the model is from which the phases were com-
puted. Another type of electron-density map, the so-
called difference map, calculated using differences
between the observed and calculated amplitudes
and calculated phases, (F
obs
– F
calc
, u
calc
), shows the
Protein crystallography for non-crystallographers A. Wlodawer et al.
4 FEBS Journal 275 (2008) 1–21 Journal compilation ª 2007 FEBS. No claim to original US government works
difference between the true and the currently modeled
structures. In such a map, the parts existing in the
structure, but not included in the model, should show
up in the positive map contours, whereas the parts
wrongly introduced into the model and absent in the
true structure will be visible in negative contours. In
practice, it is customary to use (2F
obs
– F
calc
, u
calc
)
maps, corresponding to a superposition of both previ-
ous maps, to show the model electron density as well
as the features requiring corrections. Also, the ampli-
tudes used in map calculation are often weighted by
statistical factors, reflecting the estimated accuracy of
individual amplitudes and phases.
Because all data used to compute maps (both ampli-
tudes and phases) contain a degree of error, the maps
also contain some level of noise. Usually a good dis-
play contour for the (2F
obs
– F
calc
, u
calc
) map 1r
and for the (F
obs
– F
calc
, u
calc
) map about is ± 3r,
where r is the rmsd of all map points from the aver-
age value. Higher contour levels may sometimes be
used to accentuate certain features, but the use of
lower contour levels may be misleading because this
may emphasize noise rather than real features.
It is well established that the appearance of Fourier
maps depends more on the phases than on amplitudes.
Therefore, even if the correct amplitudes are known
from a well-conducted diffraction experiment, inaccu-
rate phases may introduce map bias, which may be dif-
ficult to eliminate in the iterative refinement and
modeling process. This happens because the wrong
phases will always reproduce the same erroneous
model features, which in turn will produce the same
set of erroneous phases. A map used to overcome such
a bias is the so-called ‘omit map’, a variation of the
difference map, in which the F
calc
values are computed
from a model with the suspicious fragments deleted.
Refinement of such a ‘truncated’ model is supposed to
remove any ‘memory’ of those fragments in the set of
calculated amplitudes and phases. The omit map
should then show an unbiased representation of the
omitted fragment.
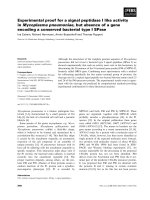
The difference between the initial, experimental and
final, optimal electron-density maps is illustrated in
Fig. 2. The fragment of the initial map agrees with the
final model, but it would not be easy to convincingly
build this part of the model into such a map. The map
quality is poor because the phases used to construct it
were rather inaccurate, and does not result from lack
of order, as the protein chain of this fragment is well
defined in the crystal, as evidenced by the map calcu-
lated with the final phases.
In general, the clarity and interpretability of elec-
tron-density maps, even those based on accurate
phases, depend on the resolution of the diffraction
data (related to the number of reflections used in the
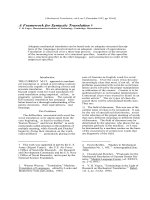
calculations). Figure 3 illustrates the appearance of
A
B
Fig. 2. Stereoviews of electron-density maps. The final atomic
model of a fragment of the DraD invasin (PDB code 2axw) [79] is
superimposed on the maps. (A) The 1.75 A
˚
resolution map calcu-
lated with F
obs
amplitudes and initially estimated phases, contoured
at the 1.5r level. This map was used to construct the first model
of the protein molecule. (B) The 1.0 A
˚
resolution map calculated
with F
obs
amplitudes and the phases obtained upon completion of
the refinement, contoured at 1.7r. The final map shows the com-
plete fragment of the chain with considerably better detail, since it
was calculated at much higher resolution (using over five times
more reflections) and with very accurate phases.
A. Wlodawer et al. Protein crystallography for non-crystallographers
FEBS Journal 275 (2008) 1–21 Journal compilation ª 2007 FEBS. No claim to original US government works 5
typical electron-density maps calculated with data
truncated at various resolution limits. Whereas at low
resolution it is not possible to accurately locate indi-
vidual atoms, a priori knowledge of the stereochemis-
try of individual amino acids and peptide groups
allows the crystallographer to locate these protein
building blocks quite well. With increasing resolution,
the maps become clearer, showing separated peaks cor-
responding to the positions of individual atoms. At
atomic resolution, individual peaks are well resolved
and their height permits differentiation between atom
types. Atomic-resolution maps may show certain non-
standard structural features, such as unusual confor-
mations or very short hydrogen bonds. It would not
be possible to convincingly model such features into
low- or medium-resolution maps. In practice, maps
obtained with low-resolution data are even worse than
those presented in the Fig. 3, because the relative error
of diffraction intensities in the resolution shell of 3.5–
3.0 A
˚
for crystals diffracting to 3 A
˚
is much larger
than for crystals diffracting to 1.5 A
˚
.
Most proteins contain regions characterized by ele-
vated degree of flexibility. In crystals, such flexibility
may result either from static or dynamic disorder.
Static disorder results from different conformations
adopted by a given structural fragments in different
unit cells. Dynamic disorder is the consequence of
increased mobility or vibrations of atoms or whole
molecular fragments within each individual unit cell.
The time scale for such vibrations is much shorter than
the duration of the diffraction experiment and, as a
result, the electron density corresponds to the averaged
distribution of electrons in all unit cells of the crystal.
In the case of static disorder, maps are averaged
spatially over all unit cells irradiated by the X-rays. In
the case of dynamic disorder, the electron density is
averaged temporally over the time of data collection.
In both cases, the electron density is smeared over
multiple conformational states of the disordered frag-
ments of the structure. At low resolution, the smeared
electron density may be hidden in the noise and such
fragments will not be interpretable, but at higher reso-
lution they may appear as distinct, alternative posi-
tions if static disorder is present. Figure 4 illustrates
a typical case of a fragment existing in multiple
conformations.
A special case of disorder is always present in the
solvent region of all macromolecular crystals. The
dominating component of the solvent region are
water molecules, although obviously any compound
Fig. 3. The appearance of electron density
as a function of the resolution of the experi-
mental data. The N-terminal fragment
(Lys1–Val2–Phe3) of triclinic lysozyme (PDB
code 2vb1) [80] with the (F
obs
, u
calc
) maps
calculated with different resolution cut-off.
Whereas at the highest resolution of 0.65 A
˚
there were 184 676 reflections used for
map calculation, at 5 A
˚
resolution only 415
reflections were included.
Fig. 4. Electron density for a region with static disorder. The model
and the corresponding (F
obs
, u
calc
) map for ArgA63 in the structure
of DraD invasin (PDB code 2axw) [79], with its side chain in two
conformations. The map was calculated at 1.0 A
˚
resolution and dis-
played at the 1.7r contour level.
Protein crystallography for non-crystallographers A. Wlodawer et al.
6 FEBS Journal 275 (2008) 1–21 Journal compilation ª 2007 FEBS. No claim to original US government works
from the crystallization medium may also be present
in the interstices between protein molecules. Some
water molecules, hydrogen-bonded to atoms at the
protein surface in the first hydration shell, are located
at well-ordered, fully occupied sites and can be mod-
eled with confidence. Water molecules at longer dis-
tances from the protein surface often occupy
alternative, partially filled sites and are difficult to
model even at very high resolution. The ‘bulk solvent’
region contains completely disordered molecules and
does not show any features except more or less flat
level of electron density. This bulk solvent region usu-
ally occupies 50% of the crystal volume, although
some crystals contain either less or more solvent than
usual. The amount of solvent can be estimated from
the known protein size and the volume of the crystal
unit cell, using the so-called Matthews coefficient [19].
Crystals containing more solvent usually display lower
diffraction power and resolution, in keeping with the
degree of disorder, which is a consequence of weaker
stabilization of the protein molecules through inter-
molecular interactions.
A quick look at the files provided by
the Protein Data Bank
Virtually all journals that publish articles describing
3D protein structures require that the authors deposit
their results in the PDB. When deposited, each struc-
ture is given a unique PDB accession code consisting
of four characters. If a structure is later withdrawn or
replaced, the code is not reused. Any changes to
atomic coordinates result in a new accession code; the
old files are then moved into the ‘obsolete area’, but
can still be accessed (with some effort). Structural
information can be subsequently downloaded by the
users as a text-formatted file. For a structure with the
accession code 9xyz, the corresponding file would be
9xyz.pdb. (For easier handling by computer programs,
the same information is also stored in a Crystallo-
graphic Information File, 9xyz.cif.) The text file con-
tains a header section with the experimental details
and a coordinate section with all experimentally
located atoms in the structure of interest. Each atom is
identified by an ‘inventory tag’ specifying its name, res-
idue type, chain label, and residue number, which is
followed by five numerical values specifying its loca-
tion (orthogonal x, y, z coordinates expressed in A
˚
),
site occupancy factor (a fraction between 0 and 1), and
its displacement parameter or B-factor (expressed
in A
˚
2
), which (at least in theory) provides information
about the amplitude of its oscillation. Any person in
the world with Internet access can freely download
these files or display them on the computer screen
using one of several applications available from the
PDB site ( For greater flexi-
bility, it is also possible to use one of the more
advanced graphical programs, for example, rasmol
[20], pymol [21] or coot [22]. These programs, and
some others, provide a variety of ways for displaying
and manipulation of the 3D structures and allow their
detailed examination.
A file header gives a description of the X-ray experi-
ment, the calculations that have led to structure deter-
mination, and some parameters that can help the
reader assess the quality of the structure. Traditionally,
the ‘Materials and methods’ section of papers that
described crystallographic experiments explained in
detail how the structure was solved and provided
information that allowed the reader to evaluate the
quality of the experimental data. Recently, high-impact
journals have been enforcing much stricter limits of
the size of the papers and, at best, an extract of this
information can be found in ‘Supplementary material’
section, which is usually only available online and fre-
quently is not fully reviewed.
Evaluation of structure quality based on the con-
tents of PDB file headers is not easy for non-crystal-
lographers, yet we must stress that any user of such
information should look at the header first, before
spending too much time looking at the (potentially
illusory) details of the structure. A PDB file usually
contains information about data extent and quality
(resolution, completeness, I ⁄ r, R
merge
, both overall and
in the highest resolution shell), as well as indicators of
the quality of the resulting structure, such as R-factor
and R
free
(vide infra). In principle, the information that
is provided in a PDB deposit should be sufficient to
create the ‘Materials and methods’ section by an
appropriate software utility. However, the information
in the headers of PDB files is often incomplete, contra-
dictory, or erroneous. An extreme case is illustrated by
the deposition 2hyd [23] that corrected a series of
faulty structures withdrawn from the PDB (together
with papers retracted from several high-impact jour-
nals, vide infra). The header of the 2hyd.pdb file does
not contain any information on how the correct struc-
ture was arrived at – all fields that describe structure
solution and quality of the data are designated as
‘NULL’. Although, as discussed in the following sec-
tions, none of these parameters alone is a rock-solid
indicator of the quality of a protein structure, they do
provide information that helps in assessing the level of
detail that could be gleaned from such a structure. We
consider PDB files that do not contain this informa-
tion to be seriously deficient.
A. Wlodawer et al. Protein crystallography for non-crystallographers
FEBS Journal 275 (2008) 1–21 Journal compilation ª 2007 FEBS. No claim to original US government works 7
In addition to the text file (e.g. 9xyz.pdb), each crys-
tallographic PDB deposition should be accompanied
by a corresponding file with the experimental structure
factor amplitudes (9xyz-sf.cif). Most regretfully, for
many of the PDB entries no structure factors are avail-
able, and even for the most recent depositions (after
1 January 2000) they are found in only 79% of
the cases, despite the National Institutes of Health
(NIH) requiring that all deposits that have resulted
from NIH-sponsored research should include experi-
mental structure factors as well (most other funding
agencies have similar rules). The availability of struc-
ture factors allows re-refinement of the structure and
independent evaluation of model quality and the
claimed accuracy of details (although, of course, such
checks are not expected to be performed too fre-
quently).
How to assess the quality of the
diffraction data
The quality of macromolecular crystal structures is
ultimately dependent on the quality of the diffraction
data used in their determination. The most important
indicators of data quality are parameters such as reso-
lution, completeness, I ⁄ r (or signal-to-noise ratio), and
R
merge
, overall and in the highest resolution shell. It is
very important to understand their meaning and the
relationship between their numerical values.
Resolution of diffraction data
An important parameter to consider when assessing
the level of confidence in a macromolecular structure
is the resolution of the diffraction data utilized for its
solution and refinement (often referred to as resolution
of the structure). Resolution is measured in A
˚
and can
be defined as the minimum spacing (d) of crystal lattice
planes that still provide measurable diffraction of
X-rays. This term defines the level of detail, or the
minimum distance between structural features that can
be distinguished in the electron-density maps. The
higher the resolution, that is, the smaller the d spacing,
the better, because there are more independent reflec-
tions available to define the structure. The terms cus-
tomarily applied to resolution are ‘low’, ‘medium’,
‘high’, and ‘atomic’ (Fig. 5). The appearance of elec-
tron density as a function of resolution is shown in
Fig. 3. The lowest-resolution crystal structures that
have been published with the coordinates start at a res-
olution of 6A
˚
, which is usually sufficient to provide
a very rough idea about the shape of the macromole-
Low Medium
High
Atomic
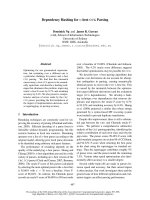
Fig. 5. Criteria for assessment of the quality of crystallographic models of macromolecular structures. For the resolution and R criteria, the
more ‘green’ (i.e. lower) the value, the better. With R
free
– R and rmsd from ideality the situation is different because there is some optimal
value and drastic departures in both directions also set a red flag, although for different reasons. When the difference between R
free
and R
exceeds 7%, it indicates possible over-interpretation of the experimental data. But if it is very low (say below 2%), it strongly suggest that
the test data set is not truly ‘free’, for example, because the structure is pseudosymmetric or, even worse, because the test reflections
have been compromised in a round of refinement or were not properly transferred from one data set to another. When rmsd(bonds) is very
high, it is an obvious signal of model errors. However, when it is very low (e.g. 0.004 A
˚
), it indicates that through too tight restraints the
model underwent geometry optimization, rather than refinement driven by the experimental diffraction data. There are different opinions
about how rigorous the stereochemical restraints should be. However, because the ‘ideal’ bond lengths themselves suffer from errors in
the order of 0.02 A
˚
, it is reasonable to require the model to adhere to them also only at this level.
Protein crystallography for non-crystallographers A. Wlodawer et al.
8 FEBS Journal 275 (2008) 1–21 Journal compilation ª 2007 FEBS. No claim to original US government works
cule, especially if it contains many helices, as was the
case of the first published structure of myoglobin [1].
However, very few crystal structures of even the largest
macromolecules are currently published at such low
resolution. For example, although early reports of the
structure of ribosomal subunits, among the largest
asymmetric assemblies studied to date by crystallogra-
phy, were based on 5 A
˚
data [24], they were quickly
followed by a series of structures at 2.4–3.3 A
˚
[25–27].
Today’s standard for medium resolution starts at
2.7 A
˚
, where there is the first chance to see
well-defined water molecules, whose hydrogen-bonding
distances are typically that long. Increasingly more
structures are now determined to a resolution exceed-
ing 2 A
˚
. The value of 1.5 A
˚
corresponds to typical
C–C covalent bonds in macromolecules. When the
resolution is significantly beyond this limit (e.g.
d < 1.4 A
˚
), an anisotropic model of atomic displace-
ments can be refined. At 1.2 A
˚
, full atomic resolution
is achieved [28,29]. This corresponds to the shortest
interatomic distances not involving hydrogen (C=O
groups). Direct location of hydrogen atoms in the elec-
tron-density map becomes possible at resolution higher
than 1.0 A
˚
, because covalent bond distances of hydro-
gen are in the range 0.9–1.0 A
˚
. The resolution of
0.77 A
˚
corresponds to the physical limit defined by
copper Ka X-ray radiation (1.542 A
˚
). Such resolution
is very rarely achieved in macromolecular crystallogra-
phy [30,31], and is beyond the routine limits of even
small-molecule crystallography. Ultra-high resolution
allows mapping of deformation electron density, for
example, of individual atomic or bonding orbitals.
The claimed resolution of a structure determination
is sometimes only nominal. If the average ratio of
reflection intensity to its estimated error, <I ⁄ r(I)>, in
the highest resolution shell is < 2.0, it can be assumed
that the true resolution is not as good. However, if this
number is much higher than 2.0, it indicates that the
crystal is able to diffract better but the resolution of
data was limited by the experimenter or the set-up of
the synchrotron experimental station. The use of maxi-
mum achievable resolution for refinement not only
permits finer structure details to be observed, but also
removes possible bias from the model, as higher reso-
lution improves the data-to-parameter ratio.
It has to be noted that the parameters in the PDB
deposit header are usually provided for the set of data
used for structure refinement, rather than for the data
originally used to solve the structure. The set of data
used in refinement can be collected with a different
experimental protocol than the set of data collected for
phasing. For refinement, it is most important to collect
a complete data set to the resolution limit of
diffraction, whereas for phasing it is most important
to collect accurate data at lower resolution, because
high-resolution intensities are generally too weak to
provide useful phasing signal. For that reason, it is
difficult to assess the quality of phasing from the
published or deposited information, if a separate
experimental data set was used for refinement.
Quality of the experimental diffraction data
The raw result of a modern diffraction experiment is a
set of many diffraction images, stored in computer
memory as 2D grids of pixels containing intensities of
the individual reflections. The intensities have to be
integrated over those pixels that represent individual
reflections. Most reflections (together with their sym-
metry equivalents) are measured many times, and their
intensities have to be averaged after the application of
all necessary corrections and appropriate scaling. This
process is known as ‘scaling and merging’, and its
result is a set of unique reflection intensities, each
accompanied by a standard uncertainty, or estimate of
error. Multiple observations of the same reflection pro-
vide a means to identify and reject potential outliers,
which may have resulted, for example, from instru-
mental glitches. However, the number of such rejec-
tions should be minimal, a fraction of a percent at
most.
As mentioned previously, the accuracy of the aver-
aged intensities can be judged from the spread of the
individual measurements of equivalent reflections
by the R
merge
residual. The simple form of
R
merge
= S
h
S
i
(|<I
h
> ) I
h,i
| ⁄S
h
S
i
I
h,i
(where h enu-
merates the unique reflections and i their symmetry-
equivalent contributors) is not the most useful
indicator, because it does not take into account the
multiplicity of measurements. More elaborate versions
of R
merge
have been proposed [32,33], but they are
seldom quoted in practice.
A good set of diffraction data should be character-
ized by an R
merge
value < 4–5%, although with well-
optimized experimental systems it can be even lower.
In our opinion, a value higher than 10% suggests
sub-optimal data quality. At the highest resolution
shell, the R
merge
can be allowed to reach 30–40% for
low-symmetry crystals and up to 60% for high-symme-
try crystals, since in the latter case the redundancy is
usually higher.
In principle, high multiplicity (or redundancy) of
measurements is desirable, as it improves the quality
of the resulting merged data set, with respect to both
the intensities and their estimated uncertainties. How-
ever, in practice this effect may be spoiled by radiation
A. Wlodawer et al. Protein crystallography for non-crystallographers
FEBS Journal 275 (2008) 1–21 Journal compilation ª 2007 FEBS. No claim to original US government works 9
damage, initiated in protein crystals by ionizing
radiation, especially at the very intense synchrotron
beamlines [34,35]. It is not easy in practice to strike an
optimal balance between the positive effect of increa-
sed multiplicity and the negative influence of radiation
damage.
The meaningfulness of measured intensities can be
gauged by the average signal-to-noise ratio,
<I ⁄ r(I)>. This measure is not always absolutely valid
because it is not trivial to accurately estimate the
uncertainties of the measurements [r(I)]. Usually the
diffraction limit is defined at a resolution where
the <I ⁄ r(I)> value decreases to 2.0.
If the data collection experiment was not conducted
properly or if there was rapid decay of diffraction
power, some reflections may not be measured at all,
and the data may not be 100% complete. Because of
the properties of Fourier transforms, each value of the
electron-density map is correctly calculated only with
the contribution of all reflections, thus lack of com-
pleteness will negatively influence the quality and inter-
pretability of the maps computed from such data.
Data completeness, that is the coverage of all theoreti-
cally possible unique reflections within the measured
data set, is therefore another important parameter of
data quality.
The above numerical criteria are usually quoted for
all data and for the highest resolution shell. Unfortu-
nately, it is not customary to quote these values for
the lowest resolution shell, containing the strongest
reflections, which are most important for all phasing
procedures and for the proper appearance of the elec-
tron-density maps. Overall data completeness may
reach, for example, 97%, but if the remaining 3% of
reflections are all missing from the lowest resolution
interval, all crystallographic procedures, from phasing
to final model building, will suffer.
As usual, there are exceptions to these rules. This is,
for example, the case with viruses, which possess very
high internal, non-crystallographic symmetry, in effect
increasing the ‘redundancy’ of the structural motif,
even if the data may not be complete. For example,
for bluetongue virus, 980 individual crystals were used
to collect over 21.5 million reflections, and, still the
data set was only 53% complete (7.8% in the highest
resolution shell). Nevertheless, these data were suffi-
cient for solving the structure [36].
Structure quality – R, Ramachandran
plot, rmsd, and other important Rs
The quality of a crystal structure (and, indirectly, the
expected validity of its interpretation) can be assessed
based on a number of indicators. The most important
ones will be discussed here in a simplified manner,
without any attempt to provide mathematical justifica-
tion for their use, but only to provide some guidance
as to their meaning.
R-factor and R
free
As mentioned earlier, residuals, or R-factors, usually
expressed as percent, but often as decimal fractions,
measure the global relative discrepancy between the
experimentally obtained structure factor amplitudes,
F
obs
, and the calculated structure factor amplitudes,
F
calc
, obtained from the model. The R-factor, defined
as S|F
obs
– F
calc
| ⁄SF
obs
, combines the error inherent in
the experimental data and the deviation of the model
from reality. With increasingly better diffraction data,
frequently characterized by R
merge
of 4% or less, the
crystallographic R-factor is effectively a measure of
model errors. Well-refined macromolecular structures
are expected to have R < 20%. When R approaches
30% (Fig. 5), the structure should be regarded with a
high degree of reservation because at least some parts
of the model may be incorrect. The best refined macro-
molecular structures are characterized by R-factors
below 10%. Examples of such structures include xylan-
ase 10A at 1.2 A
˚
resolution [37], rubredoxin at 0.92 A
˚
[38], and antifungal protein EAFP2 at 0.84 A
˚
[39],
among others. The atomic resolution structure of
l-asparaginase (PDB code 1o7j) describes the posi-
tions of over 20 000 independent atoms in the
asymmetric unit (including hydrogen atoms), yet it was
refined to R = 11% at 1 A
˚
resolution [40]. In small-
molecule crystallography, where the models contain
fewer atoms and the data can be corrected for various
systematic errors, it is not unusual to see R-factors
of 1–2%.
An important parameter that was introduced into
crystallographic practice in 1992 is free R [41]. R
free
is
calculated analogously to normal R-factor, but for
only 1000 randomly selected reflections (very often
inflated to unnecessarily large sets due to blind use of
defaults in data reduction software) which have never
entered into model refinement, although they might
have influenced model definition [42]. In this way, if
the mathematical model of the structure becomes
unreasonably complex, i.e. includes parameters for
which there is no justification in the experimental data,
R
free
will not improve (even though the R -factor may
decrease), indicating over-interpretation of the data.
This is because the superfluous parameters tend to
model the random errors of the working data set,
which are not correlated with the errors in the R
free
Protein crystallography for non-crystallographers A. Wlodawer et al.
10 FEBS Journal 275 (2008) 1–21 Journal compilation ª 2007 FEBS. No claim to original US government works
set. R
free
is an important validation parameter and
should set a warning if it exceeds R by more than
7% (Fig. 5). Its high value may indicate over-fitting
of the experimental data, or may result from a serious
model defect. For example, addition of an unreason-
able number of water molecules into the noisy features
of the solvent region will always lower the ordinary
R-factor, but will not improve R
free
.
Modified forms of the R-factor
In addition to the conventional and most popular crys-
tallographic R-factor discussed above, other residuals
are also in use to gauge the agreement between the real
and model worlds. R
free
has already been mentioned as
a cross-validation parameter based on reflections
excluded from refinement. However, its independence
from the model is not complete as it may be used to
decide on the course of refinement (and model con-
struction). Therefore, an even ‘more independent’
residual, called R
sleep
, has recently been proposed [42].
That residual should be based on another subset of
reflections that are kept in a vault and never used in
any calculations, except for the final R
sleep
value.
Although this concept is methodologically correct, it is
not quite certain where to put a limit for sacrifice of
the scarce experimental observations on the altar of
cross-validation, as removal of consecutive subsets
of reflections introduces mathematical errors in the
Fourier transformation process (map calculation) and
effectively worsens the final map interpretability. A
combined application of R
free
and R
sleep
testing would
require 2000–4000 reflections, which might amount to
20% of all observations for a typical data set for a
medium-size protein.
Another residual, more common in small-molecule
than in protein work, is the weighted R-factor or wR2,
based on reflection intensities and including the statis-
tical weights with which the observations enter the
refinement [43]. The problem of data weighting does
not have a good solution in protein crystallography
because the uncertainties (errors) estimated for the
reflection intensities are not always very reliable. They
can be more meaningful if derived from data of high
redundancy, i.e. when many observations contribute to
the same averaged reflection intensity.
A completely different philosophy is behind the defi-
nition of the so-called real-space R-factor. Here, the
residual is calculated to reflect the correlation between
the experimental electron-density map and the one
generated purely from the model. Real-space R-factors
are used less frequently; the disadvantage is that even
the experimental map is, in most cases, based on
model-derived phases. An important advantage is that
map R-factors can be calculated selectively for differ-
ent regions of the model, thus easily revealing the
troubling parts, something that is not obvious from
the diffraction-space residuals.
Root-mean-square deviations from
stereochemical standards
Rmsd from standard stereochemistry indicate how
much the model departs from geometrical parameters
that are considered typical, or represent chemical com-
mon sense based on previous experience. Usually the
same standards are used as restraints (with adjustable
weights) during structure refinement [9,10]. Different
parameters can be evaluated by the rmsd criterion, but
it is most common to use the value for bond lengths
when comparing different models. Good-quality, med-
ium-to-high-resolution structures are expected to have
a rmsd(bond) of 0.02 A
˚
(Fig. 5), although numbers
half that size are also acceptable. When this number
becomes too high (> 0.03 A
˚
), it signifies that some-
thing might be wrong with the model. It is not desir-
able to lower this value at all costs, because the
standards represent some averages and are themselves
not error-free [12]. At very high resolution, the
restraint control of model geometry (at least in well-
defined areas) becomes less important because the
experimental information strongly determines the
course of the refinement.
Ramachandran plots and peptide planarity
The global deviations of stereochemical parameters
from their expected values, discussed above, might
raise questions about the quality of the structure but
would not pinpoint the source of possible errors. To
trace them, one normally runs a geometry validation
program, such as procheck [44] or molprobity [45],
to look for indications of curious features. A particu-
larly useful tool is the Ramachandran plot [46], show-
ing the mapping of pairs of u ⁄ w torsion angles of the
polypeptide backbone (defined in Fig. 6) against the
expected contours. The u ⁄ w angles have a strong vali-
dation power because their values are usually not
restrained in the refinement (unless a special torsion-
angle-refinement method is used) [47]. Two examples
of Ramachandran plot are shown in Fig. 7. For the
Erwinia chrysanthemi l-asparaginase structure (PDB
code 1o7j; Fig. 7A), > 90% of the angles are found in
the most favored region of the diagram. One residue,
Thr204, is found in the disallowed region, but its
strained conformation was well documented in that
A. Wlodawer et al. Protein crystallography for non-crystallographers
FEBS Journal 275 (2008) 1–21 Journal compilation ª 2007 FEBS. No claim to original US government works 11
and other asparaginase structures [40], thus this depar-
ture from ideality can be accepted with confidence.
That is not the case with the Ramachandran plot
(Fig. 7B) for the structure of the C3b complement
pathway protein (PDB code 2hr0), which appears to
suffer from a multitude of problems (vide infra).
The third main-chain conformational parameter, the
peptide torsion angle x, is expected to be close to 180°
or exceptionally to 0° for cis-peptides (the latter situa-
tion may be more frequent than originally thought).
The peptide planes are usually under very tight stereo-
chemical restraints, although there is growing evidence
that deviations of ± 20° from strict planarity should
be treated as not abnormal [12,38,48]). Unreasonably
tight peptide planarity restraints may lead to artificial
distortions of the neighboring u ⁄ w angles in the Ra-
machandran plot. However, sometimes one encounters
in the PDB protein structures with totally impossible
peptide-bond torsion angles. Models containing such
violations should be regarded as highly suspicious.
Can we trust the published
macromolecular structures?
In our opinion, the general answer to this question is a
definite ‘yes’, although, as shown below, some prob-
lems may be encountered in individual cases. We
Fig. 6. Schematic representation of a fragment of the protein back-
bone chain with definition of torsion angles u, w and x for the ith
residue. These angles have a reference value of 0° in the eclipsed
conformation, but as presented in the figure they are all equal to
180°.
A
B
Fig. 7. Two examples of a Ramachandran diagram. (A) Plot for Erwinia chrysanthemi L-asparaginase, one of the largest structures solved to
date at atomic resolution (PDB code 1o7j). (B) Plot for the 2.26 A
˚
structure of the C3b complement protein (PDB code 2hr0) characterized
by a very large number of main-chain dihedral angles outside of the allowed region, a vast majority of them originating from a single polypep-
tide chain.
Protein crystallography for non-crystallographers A. Wlodawer et al.
12 FEBS Journal 275 (2008) 1–21 Journal compilation ª 2007 FEBS. No claim to original US government works
discuss here a few problems that we found in the scien-
tific literature and in the deposited coordinates. We
would like to stress that such problems are quite rare,
although the readers of crystallographic papers should
be aware of their existence.
Misrepresentation of crystallographic
experiments
Fortunately for the field, known cases of outright fab-
rication of crystallographic data are extremely rare,
maybe because the technique is so heavily based on
calculations that data are not easy to fake. Perhaps the
best known case of that sort was a discovery that the
published diffraction patterns attributed to valyl tRNA
were actually those of human carbonic anhydrase B
[49]. That substitution was detected by analyzing the
unit cell parameters of the published diffraction photo-
graphs – their values are quite characteristic for a
given crystal, although they might bear chance similar-
ity to crystals of other macromolecules. In that case,
the latter possibility was ruled out through careful
analysis of other aspects of the presented data.
A case of possible manipulation of diffraction data
has recently been described (but it must be stressed
that, as of the time of writing of this review, it is not
yet officially proven). It was pointed out that the data
deposited in the PDB for the structure of protein C3b
in the complement pathway, refined at 2.26 A
˚
resolu-
tion (PDB code 2hr0), are inconsistent with the known
physical properties of macromolecular structures and
their diffraction data [50]. For example, the deposited
structure factors did not show any indication of the
presence of bulk solvent, the electron density of the
presumably largely unfolded domain was excellent,
and there was no correlation between surface accessi-
bility and the atomic B-factors. In addition, some
other features (18 distances between non-bonded
atoms of < 2 A
˚
, several peptide torsion angles deviat-
ing from planarity by as much as 57°, and 4.2% of
outliers in the Ramachandran plot, almost all in one
subunit; Fig. 7B) are clear indications of serious prob-
lems with this structure.
Honest errors in structure determination
In our experience, serious errors in describing a whole
macromolecule are rare, especially nowadays, although
errors in some local areas might be more common. A
structure of ribulose-1,5-biphosphate carboxylase-oxy-
genase with the chain of one of the subunits traced
completely backwards was published [51], but, in a
way that should reassure non-crystallographers, the
error was noted almost immediately [52]. The state-
ment found in the abstract of the latter publication
‘one of these models is clearly wrong’, paraphrasing
the way Winnie-the-Pooh was addressed by Rabbit
(‘one of us was eating too much, and I knew it wasn’t
me’) [53], is an excellent indication of the self-correct-
ing potential of the collective experience of the crystal-
lographic community. A later re-enactment of this case
[8] showed that, although it is possible to refine a
backwards-traced structure at medium resolution to
acceptable values of R and rmsd(bond), the value of
R
free
would remain completely unacceptable (in that
case, 61.7%), clearly indicating that the model was in
error. With the mandatory use of R
free
, similar errors
are unlikely to happen again.
A very recent case of an important series of struc-
tures that were seriously misinterpreted points out the
danger introduced by deviation from standard crystal-
lographic procedures and by over-interpretation of
low-resolution data. The structure of the MsbA ABC
transporter protein [54], as well as several related
structures published by the same group, had to be
retracted after the structure of Sav1866, another mem-
ber of the family, was published [23]. All structures of
these very important integral membrane proteins were
solved at low resolution. The structure of MsbA was
refined using non-standard protocols that utilized mul-
tiple molecular models, and this approach may have
masked problems that would have been obvious had
the authors stayed with more traditional refinement
techniques. It must be stressed that all these structures
were very difficult to solve and even the apparently
correct structure of Sav1866 is characterized by rather
high values of R and R
free
(25.5% and 27.2%, respec-
tively), although such values are not unusual at 3 A
˚
resolution.
Unlike the very rare cases mentioned above in which
the whole structures were questionable, local mis-trac-
ing of elements of the protein chain has been more
common. A number of such cases have been reviewed
previously [8]. Although this type of error may matter
very little if it happens to be limited to an area of the
protein that is remote from the active site or from
site(s) of interaction with other proteins, in other cases
it may lead to misinterpretation of biological pro-
cesses. One well-known case, in which modeling a
b strand instead of a helix led to postulating a doubt-
ful model of autolysis, was provided by HIV-1 pro-
tease [55]. However, similar to the cases mentioned
above, the implausibility of the original interpretation
became clear almost immediately, when, first, the
structure of a related Rous sarcoma virus protease
became available [56], and, soon thereafter, when the
A. Wlodawer et al. Protein crystallography for non-crystallographers
FEBS Journal 275 (2008) 1–21 Journal compilation ª 2007 FEBS. No claim to original US government works 13
structure of HIV-1 protease itself was independently
determined [57].
One important practical aspect of crystallographic
structures is to provide details of the interactions
between macromolecules (usually enzymes) and small-
or large-molecule inhibitors. Interpretation of such
structures depends very much on the quality of the elec-
tron density for the inhibitor. In some cases, such as
the complex of botulinum neurotoxin type B protease
with a small inhibitor BABIM [58], the structural
conclusions had to be later retracted, although the
crystallographic quality indicators appeared to be
more than acceptable (resolution 2.8 A
˚
, R = 16.2%,
R
free
= 23.8%). Similarly, the validity of the structure
of a complex of the same enzyme with a target peptide
was questioned [59], because the 38-residue peptide was
apparently fitted to a very noisy map that could not
support the interpretation of its structure.
Interpretation (and over-interpretation)
of structural models
Assuming that the reader has looked at the header of
the PDB file and become convinced that there are no
indications of any problems with the diffraction data
or with the results of the refinement, what other prop-
erties of the structure should be considered? An impor-
tant aspect of macromolecular crystal structures is the
description of solvent areas, as water plays a vital role
in the structure of biomolecules and often influences
protein function. Another important aspect of the
structure is the description of other ligands, especially
bound metals. Subsequent interpretation of the struc-
tures in terms of known biological and biochemical
properties is a crucial step in structural biology. It is
also necessary to consider whether the features
described in the PDB deposit, such as, for example,
placement of hydrogen atoms, could be justified by the
resolution and quality of the experimental data.
Solvent structure
The solvent content of protein crystals was first ana-
lyzed by Matthews [19] on the basis of the few protein
crystal structures known at that time, and was found
to range from 27 to 65%. Examination of the current
contents of the PDB indicates that this estimate is still
valid, with an average of 51%, although some excep-
tions are present. However, the apparent solvent con-
tent of entries such as 2avy (92%) or 1q9i (2.0%)
certainly indicates errors in the PDB. The presence of
such errors (10 cases with solvent content below 2.5%)
must be recognized by the users of this database.
Because X-ray crystallography can observe only
objects that are repeated throughout the entire volume
of the crystal in a periodic fashion, only well-ordered
solvent molecules can be identified in the electron-den-
sity map. Moreover, the number of observed water
molecules also depends on the resolution of the experi-
mental data. To get a rough estimate of the expected
ratio of the number of water molecules to protein resi-
dues one should subtract the resolution (in A
˚
) from 3.
This indicator could be higher (by up to 100%) for
crystal structures with a high solvent content (Mat-
thews coefficient > 3.0 A
˚
3
ÆDa
)1
). Thus at low resolu-
tion ( 2.5 A
˚
) it should be possible to identify in the
electron-density maps at most 0.3–0.5 ordered water
molecules per protein residue and at very high resolu-
tion (1.0 A
˚
) this may increase to 2 water molecules per
residue. Structures exceeding these limits may contain
errors.
It should be noted that the inclusion of a water mol-
ecule in the model usually increases the number of
refinement parameters by four (three coordinates plus
the isotropic B-factor) and subsequently decreases the
R-factor, so assigning water to each unidentified sec-
tion of density is very tempting, but may not be justi-
fied. The presence of water molecules with high
B-factors (> 100 A
˚
2
) indicates that the solvent struc-
ture was not refined very carefully. A large difference
in the values of the B-factors for a solvent molecule
and its environment is also very suspicious.
Metal cations
Around 30% of all PDB deposits report the presence
of ordered metal ions, with 20% containing a metal
located in a site important for the biological activity of
the macromolecule. Functional analysis of a number
of proteins crucially depends on the ability to identify
possible metal ions in an unambiguous way. Unfortu-
nately, PDB files do not contain any information
about the procedures that were used for metal assign-
ment and refinement, and even the relevant papers
often relegate this information to supplements. Some-
times metal positions are determined directly, utilizing
their anomalous scattering of X-rays. Application of
this procedure provides the highest credibility, but
most often the metals are assigned simply to the high
peaks of electron-density maps. When assigning metal
ions in the latter way, the experimenter should have
examined the number of ligands, the geometry of the
coordination sphere, and the B-factor of the ion and
its environment. For example, the distance between
calcium and oxygen atoms should be 2.40 A
˚
and
between magnesium and oxygen 2.07 A
˚
[60]. If the
Protein crystallography for non-crystallographers A. Wlodawer et al.
14 FEBS Journal 275 (2008) 1–21 Journal compilation ª 2007 FEBS. No claim to original US government works
distances between a putative calcium and the neighbor-
ing oxygen atoms are around 2.1 A
˚
, two possibilities
should be considered: (a) a magnesium ion is present,
but the experimenter has wrongly assigned the density
to calcium; or (b) the refinement was performed with
inappropriate restraints. Metal ion distance restraints
are necessary especially for lower resolution data,
where the observation-to-parameter ratios are usually
insufficient for unrestrained refinement [12]. Certain
metals have preferences for a particular type of coordi-
nation, for example Mg
2+
tends to show octahedral
coordination, whereas Zn
2+
is most often tetrahedral
[60–62]. A useful tool for differentiating between vari-
ous metal ions is the bond valence concept, which
takes into account the valence of the metal and the
chemical nature of the ligands [63–65]. An example of
an ion assigned as Mg
2+
that violates most of the
rules given above is shown in Fig. 1B. Unfortunately,
this part of the structure of frankensteinase was copied
directly from the file 1q9q deposited in the PDB.
Whereas the presence in a structure of a few metal
ions with acceptable distances to the protein and good
geometry should be considered normal, the presence of
too many such ions that do not make reasonable con-
tacts with the protein should be a matter of concern.
For example, the 2.6 A
˚
structure of Thermus thermo-
philus RNA polymerase (PDB code 1iw7) contains 485
Mg
2+
ions, the vast majority far beyond 2.07 A
˚
from
the nearest oxygen atom. We may safely assume that
the identity of most of these ions is very dubious, to
say the least.
Placement of hydrogen atoms
Hydrogen atoms lack the electronic core and, in mole-
cules of chemical compounds, their single electron is
always involved in the formation of bonds. Hydrogen
atoms are therefore the weakest scatterers of X-rays,
and even in small-molecule crystallography their direct
localization is difficult. The only chance to directly
localize them in macromolecular structures is in the
difference map after the rest of the structural model
has been carefully refined at very high resolution.
However, even for those proteins that diffract X-rays
to ultra-high resolution, only a fraction of all hydrogen
atoms can be identified in such maps.
Although hydrogen atoms are not easy to localize
directly, they are obviously present in all proteins, sug-
ars, and nucleic acids, and are involved in many bio-
logical processes. The location of most of them can be
calculated with good accuracy from the positions of
the heavier atoms. As a consequence, it is advisable to
include the majority of hydrogen atoms in a structural
model at calculated positions, and refine them as ‘rid-
ing’ on their parent atoms. In this way, their parame-
ters are not refined independently, but their
coordinates are recalculated after each refinement cycle
and their contribution to X-ray scattering is correctly
taken into account. Some refinement programs have
options for such a treatment of hydrogen atoms in an
automatic way. At high resolution their contribution
may result in a drop of the overall R-factor by a few
percent. Moreover, if H atoms are not included, their
contribution is represented completely by the parent
atom and its position tends to refine to the ‘center of
gravity’ of both atoms. As a result the geometry of the
refined model may be slightly distorted.
Unfortunately, whereas this method is applicable to
most hydrogen atoms, which are rigidly connected
within such groups as methylene, amide, phenyl, etc.,
some other hydrogen atoms, often the most interesting
from the chemical and biological point of view, e.g.
those within hydroxyl groups or within functions that
can be easily (de)protonated, such as carboxyl or
amino groups, cannot be treated in this way. In some
cases, when the model is accurate enough and refined
at high resolution, their presence can be inferred indi-
rectly by analyzing the geometry of the chemical envi-
ronment (Fig. 8A). For example, if the two C–O bond
lengths within a carboxyl group differ significantly,
then most probably this acidic group is not ionized.
The internal C–N–C bond angles in heterocyclic rings,
such as in the imidazole ring of histidine, tend to be
by up to 5° wider if the nitrogen atom is protonated
[66]. In structures refined at ultra-high resolution, as
well as in structures obtained by neutron diffraction (a
technique not discussed here, but whose utility is well
documented) [67,68], positions of some hydrogen
atoms can be visualized directly (Fig. 8B).
Some low-resolution coordinate sets were deposited
in the PDB with hydrogen atoms that were utilized
during the refinement, but which clearly cannot have
any experimental basis in structures solved at low reso-
lution. Some examples are provided by 1pma (3.4 A
˚
),
1gtp (3.0 A
˚
), 1pfx (3.0 A
˚
), or 1ned (3.8 A
˚
), among oth-
ers. The reader might safely assume that these hydro-
gen atoms were only modeled and not determined
experimentally.
Catalytic mechanism
The crystal structure of a nucleic acid complex of the
enzyme onconase [69] may represent a case in which
the interpretation of the structural results contradicts
the established picture by going beyond what can be
justified by the extent and quality of the diffraction
A. Wlodawer et al. Protein crystallography for non-crystallographers
FEBS Journal 275 (2008) 1–21 Journal compilation ª 2007 FEBS. No claim to original US government works 15
data. The authors postulated a novel catalytic mecha-
nism involving the attack on the phosphodiester bond
by the Ne2 imidazole atom of the crucial catalytic
His97 residue rather than by Nd1, as is the case with
other RNase A-like enzymes. The orientation of the
His97 ring in the deposited structure (PDB code 2i5s)
was determined, on the basis of the B-factors of the
imidazole atoms, to be opposite to that found in all
other related structures. However, the interpretation
may be an example of trusting crystallographic data
beyond the level of credibility. First, the 1.9 A
˚
diffrac-
tion data were not of the highest quality
(R
merge
= 12.5%). Second, the final refined model
places the ‘catalytic’ nitrogen 4.15 A
˚
from the atom
being attacked, at an angle that prevents the creation
of any hydrogen bonds. It seems to us more likely that
either the side chain of His97 might have been trapped
in a non-productive orientation, or the refined values
of the B-factors, and in consequence the deduced ori-
entation of the histidine ring, were influenced by data
errors.
Is the structure relevant to explanation of the
biological properties?
Infrequently, a macromolecular structure may be com-
pletely correct in crystallographic terms, yet the coor-
dinates may not correspond to the biologically relevant
state of the molecule. A few examples illustrate this sit-
uation. The first structure of the core domain of
HIV-1 integrase (PDB code 1itg) contained a cacody-
late molecule derived from the crystallization buffer
attached to a cysteine side chain located in the active-
site area [70]. This led the constellation of the catalytic
residues Asp64, Asp116, and Glu152 to assume a non-
native configuration, although the distortion of the
catalytic apparatus became apparent only later, by
comparison with other, unperturbed structures, nota-
bly the catalytic domain of integrase from avian sar-
coma virus [71,72]. The most significant consequence
of the inactive conformation of the catalytic residues
was the inability of the two aspartate side chains to
bind a catalytic divalent metal cation in a coordinated
fashion. Subsequent studies of Mg
2+
complexes of
HIV-1 integrase crystallized in the absence of cacody-
late were in full agreement with the structures of other
related enzymes [73,74].
A different example of the difficulties in gaining
mechanistic insights from high-resolution structures of
enzymes is provided by a comparison of crystal struc-
tures of the proteolytic domain of Lon proteases
belonging to two closely related families, A and B.
Structural and biochemical investigation of such a
domain of Escherichia coli Lon A (EcLonA; PDB code
1rre) [75] established the presence of a catalytic dyad
consisting of Ser679 and Lys722. However, the subse-
quently determined structure of a corresponding
domain of Methanococcus jannaschii Lon B (MjLonB;
PDB code 1xhk) indicated the presence of a catalytic
triad, which, in addition to the two residues equivalent
to the ones mentioned above, also included Asp675
(E. coli numbering) [76]. Such an important structural
difference was interpreted in terms of a different cata-
lytic mechanism for these closely related enzyme fami-
lies. However, atomic-resolution crystal structure of
the catalytic domain of Archaeoglobus fulgidus Lon B
(AfLonB; PDB code 1z0w) [77], as well as high-resolu-
tion structures of a series of mutants, established a
A
B
Fig. 8. Interpretation of the location of hydrogen atoms. (A) Assign-
ment of hydrogen atoms based on the pattern of carboxylate C–O
bond lengths of the residues in the active site of sedolisin refined
at 1.0 A
˚
resolution (PDB code 1ga6) [81]. The bond-length errors
are 0.02 A
˚
, therefore the differences between the C–O bonds
within the carboxylic groups are not decisive, but strongly sugges-
tive about the protonation state of the Glu and Asp residues, espe-
cially that they form an internally consistent pattern. (B) Hydrogen-
omit map for the Thr51 residue in the model of triclinic lysozyme
refined at 0.65 A
˚
resolution (PDB code 2vb1) [80], contoured at the
3r level. Hydrogen atoms are colored gray. Evidently, at this threo-
nine the methyl and hydroxyl groups do not rotate freely, but adopt
stable conformations, due to their interactions with neighboring res-
idues in the crystal.
Protein crystallography for non-crystallographers A. Wlodawer et al.
16 FEBS Journal 275 (2008) 1–21 Journal compilation ª 2007 FEBS. No claim to original US government works
different picture, in which the strand including Ser679
was turned towards solvent, disrupting the catalytic
dyad. Mutation of Asp675 to Ala did not affect the
activity of the enzyme. The final conclusion, possible
only because of the availability of a whole series of
structures, was that in the absence of a substrate,
product, or inhibitor, the catalytic domain of Lon may
adopt an inactive conformation. This is a lesson worth
remembering.
A practical approach to evaluating
protein structures
Having presented a brief outline of the process leading
to the solution of crystal structures and after discus-
sion of the appearance of the electron-density maps
and the indicators of quality of both the experimental
data and the resulting structures, it is time to summa-
rize some practical approaches to the evaluation of
macromolecular structures presented in the scientific
literature. A nice picture showing a rendered tracing of
the main chain and a few side chains may convey an
impression that the structure should be interpreted as
is, and even frankensteinase (Fig. 1) may appear to
represent at this level a properly solved protein struc-
ture. What are the most important indicators that one
should pay attention to?
The first thing to check is whether the level of detail
of a published structure and the biological inferences
drawn from it are justified by the data resolution. One
simple indicator to check is the number of modeled
water molecules per residue. For example, one of the
1.9 A
˚
structures of a small peptide refined by elves
rather than crystallographers (PDB code 1rb1) [78] con-
tains close to 7 water molecules per residue. With many
of them situated < 1 A
˚
from the protein, it may be
safely assumed that this structure should not be inter-
preted as biologically relevant. If there are more than a
few water molecules included at resolution lower than
3A
˚
, the results are unquestionably over-interpreted.
Examples of such structures with too generous solvent
models are 1zqr with 146 water molecules per 335 resi-
dues at 3.7 A
˚
resolution, 1q1p with 237 water mole-
cules per 213 residues at 3.2 A
˚
, or 1hv5 with 2136
water molecules per 972 residues at 2.6 A
˚
. However,
structures such as 1ys1 with 147 water molecules per
320 residues refined at 1.1 A
˚
or 2ifq with 102 water
molecules and 315 residues at 1.2 A
˚
may underestimate
the solvent content. It is obvious to us that the struc-
ture 1ixh that contains no solvent at all, despite resolu-
tion of 0.98 A
˚
and R-factor of 11.4%, must be an
example of a deposition or processing error in the
PDB.
Another resolution-related problem is whether indi-
vidual B-factors were refined, or whether only an
overall B (for the whole structure) or group B-factors
(for each residue) were refined. Any structure at res-
olution lower than 3A
˚
in which B-factors were
refined individually for each atom should be taken
with a grain of salt, because the procedure intro-
duced too many parameters. The structure 1q1p
mentioned above is an example of such an approach
(refinement of too many parameters and addition of
too many solvent molecules often go together).
Another example of refinement that is subject to
both reservations is provided by a structure also dis-
cussed previously, namely DNA polymerase b (PDB
code 1zqr) refined at 3.7 A
˚
, in which the final model
contains 326 protein residues, 146 water molecules, 3
metal ions, and 15 nucleotides, all refined with indi-
vidual B-factors that range from 1.0 to 100.0 A
˚
2
.
For high-resolution structures, anisotropic representa-
tion of atomic displacement parameters is substanti-
ated only if the resolution is better than 1.4 A
˚
.At
lower resolutions the use of six refined anisotropic
parameters instead of one isotropic B-factor is not
warranted by the number of reflections available for
refinement. Thus a structure of mistletoe lectin I
(PDB code 1onk), refined anisotropically at 2.1 A
˚
resolution, is a good example of a procedure that
should better be avoided.
The next parameters to consult would be the other
two ‘Rs’ presented in Fig. 3. In typical situations, the
three criteria should be congruous, i.e. high-resolution
structures are expected to be characterized by lower R-
factors and better geometrical quality. However, these
parameters should not be in the alarming red regions.
As an example, the structure of eye-lens aquaporin
(PDB code 2c32), refined with individual atomic B-fac-
tors using data extending only to 7.01 A
˚
resolution,
with R = 39.0% and R
free
= 38.7%, seems to be
unacceptable for several of the reasons given above.
The 2.2 A
˚
structure of ferric binding protein (PDB
code 1d9y) is characterized by R = 18.5% and
R
free
= 37.7%, with very large differences between the
B-factors of neighboring atoms and groups, with
anisotropically refined Fe and S atoms, and with no
record of geometry indicators such as rmsd(bond)
given in the PDB file. This structure and ones like it
should also raise significant concerns.
To further evaluate a structural model, the reader
may use validation programs such as procheck [44] or
molprobity [45]. Presumably they have already been
used by the authors, but the results are not always
summarized in the articles. We especially recommend
checking the Ramachandran plot to make sure that no
A. Wlodawer et al. Protein crystallography for non-crystallographers
FEBS Journal 275 (2008) 1–21 Journal compilation ª 2007 FEBS. No claim to original US government works 17
unexplained torsion angles are found in disallowed
regions. Although no longer commonly found in publi-
cations, such a plot is available on the PDB website
for each deposited structure. It may be a good habit to
have a look at the atomic coordinate section of the
PDB file to see the level of the B-factors of the atoms
that are in the most important fragments of the struc-
ture. If one sees values systematically > 40 A
˚
2
, the
fragment may not be well defined at all. An even more
important parameter to check is the occupancy factor.
Well-ordered atoms should have 1.00 in this column of
the PDB file. Values equal to 0.00 mean that such
atoms are completely fictitious, without any support
from the experiment, added only to mark the chemical
composition of the protein sequence. Regions with
zero occupancy should never be considered part of the
experimental model, and consequently must be
excluded from any interpretations. Occupancies higher
than 1.0 result from obvious errors. When scrolling
through a source PDB file, it may be useful to see if
there were any alert flags set by the annotator, and,
for the more inquisitive reader, to see what data qual-
ity is reported in the experimental section.
In addition to providing the above criteria, a
respectable crystallographic publication should show
the electron-density map on which the key conclusions
hinge. The reader should be able to assess its quality,
especially with reference to the contour level at which
it is presented.
As discussed throughout this review, if both the
coordinates and structure factors are available in the
PDB, it is possible to independently assess the quality
of published crystal structures and thus adjust expecta-
tions about the level of detail that may be safely
accepted by the readers. Although some large-scale
independent refinement efforts are under way, in which
many deposited structures are re-refined using consis-
tent protocols, in a vast majority of cases the readers
will not be expected to repeat structure refinement and
map analysis themselves.
It is very important to apply some common-sense
tests before taking structural results as an absolute
proof of the biological properties of macromolecules.
Does the proposed active site and the mechanism of
action make sense? Clearly, the ‘active site’ of franken-
steinase, with only hydrophobic residues present
(Fig. 1A), is unlikely to be able to catalyze any known
chemistry. If metal ions are important for structure
interpretation, have they been correctly assigned?
Again, the example of frankensteinase, in which a
putative Mg
2+
ion does not have the expected coordi-
nation (Fig. 1B), shows that strong proofs of the metal
identity should be present.
Although we have provided a number of examples
showing that not all published structures yield the
same level of information, we should stress again that,
by and large, an overwhelming majority of crystal
structures can be safely assumed to be unquestionably
correct. It is important to keep in mind that crystallog-
raphy is the only method that has extensive built-in
quality control criteria of the structural ‘product’. In
electron microscopy, the model does have a definitive
resolution, but typically it is at least an order of mag-
nitude worse than in X-ray crystallography. NMR-
derived models do not possess any resolution and their
quality cannot be assessed by reference to experiment
using a criterion such as the R-factor. They can be
evaluated, however, by similar rmsd(bond) and Rama-
chandran plot criteria. Finally, although we gave some
general guidelines for the interpretation of the indica-
tors of structure quality, we must stress that there is
some level of subjectivity in their interpretation, and
that other crystallographers may not exactly agree with
all of our recommendations. That, however, is the
beauty of the crystallographic method it is always open
to further ‘refinement’.
Acknowledgements
We would like to thank Heping Zheng for helping
with identification of the PDB files mentioned in this
review. Original work in the laboratories of AW and
ZD was supported by the Intramural Research Pro-
gram of the NIH, National Cancer Institute, Center
for Cancer Research, and WM was supported by grant
GM74942 and GM53163. The research of MJ was
supported by a Faculty Scholar fellowship from the
Center for Cancer Research of the National Cancer
Institute.
References
1 Kendrew JC, Bodo G, Dintzis HM, Parrish RG, Wyck-
off H & Phillips DC (1958) A three-dimensional model
of the myoglobin molecule obtained by X-ray analysis.
Nature 181, 662–666.
2 Bernstein FC, Koetzle TF, Williams GJB, Meyer EF Jr,
Brice MD, Rogers JR, Kennard O, Shimanouchi T &
Tasumi M (1977) The Protein Data Bank: a computer-
based archival file for macromolecular structures. J Mol
Biol 112, 535–547.
3 Berman HM, Westbrook J, Feng Z, Gilliland G, Bhat
TN, Weissig H, Shindyalov IN & Bourne PE (2000)
The Protein Data Bank. Nucleic Acids Res 28, 235–242.
4 Levitt M (2007) Growth of novel protein structural
data. Proc Natl Acad Sci USA 104, 3183–3188.
Protein crystallography for non-crystallographers A. Wlodawer et al.
18 FEBS Journal 275 (2008) 1–21 Journal compilation ª 2007 FEBS. No claim to original US government works
5 Brown EN & Ramaswamy S (2007) Quality of protein
crystal structures. Acta Crystallogr D Biol Crystallogr
63, 941–950.
6 Borman S (2007) Structure quality: crystal structures in
‘hotter’ journals tend to have more errors. Chem Eng
News 85, 11.
7 Hendrickson WA (1985) Stereochemically restrained
refinement of macromolecular structures. Methods Enz-
ymol 115, 252–270.
8 Kleywegt GJ & Jones TA (1995) Where freedom is
given, liberties are taken. Structure 3, 535–540.
9 Engh R & Huber R (1991) Accurate bond and angle
parameters for X-ray protein-structure refinement. Acta
Crystallogr D Biol Crystallogr 47, 392–400.
10 Engh RA & Huber R (2001) Structure quality and
target parameters. In International Tables for
Crystallography vol. F (Rossman MG & Arnold E,
eds), pp. 382–392. Kluwer, Dordrecht.
11 Allen FH (2002) The Cambridge Structural Database: a
quarter of a million crystal structures and rising. Acta
Crystallogr D Biol Crystallogr 58, 380–388.
12 Jaskolski M, Gilski M, Dauter Z & Wlodawer A (2007)
Stereochemical restraints revisited: how accurate are
refinement targets and how much should protein struc-
tures be allowed to deviate from them? Acta Crystallogr
D Biol Crystallogr 63, 611–620.
13 Painter J & Merritt EA (2006) Optimal description of a
protein structure in terms of multiple groups undergo-
ing TLS motion. Acta Crystallogr D Biol Crystallogr
62, 439–450.
14 Bra
¨
nde
´
n C-I & Jones TA (1990) Between objectivity
and subjectivity. Nature 343, 687–689.
15 Blundell TL & Johnson LN (1976) Protein Crystallogra-
phy. Academic Press, New York, NY.
16 Drenth J (1999) Principles of Protein X-ray Crystallog-
raphy. Springer, New York, NY.
17 Blow D (2002) Outline of Crystallography for Biologists.
Oxford University Press, New York, NY.
18 Rhodes G (2006) Crystallography Made Crystal Clear.
Academic Press, Burlington, VT.
19 Matthews BW (1968) Solvent content of protein crys-
tals. J Mol Biol 33, 491–497.
20 Sayle RA & Milner-White EJ (1995) RasMol: biomolec-
ular graphics for all. Trends Biochem Sci 20, 374–376.
21 DeLano WL (2002) The pymol molecular graphics sys-
tem. DeLano Scientific, San Carlos, CA.
22 Emsley P & Cowtan K (2004) Coot: model-building
tools for molecular graphics. Acta Crystallogr D Biol
Crystallogr 60, 2126–2132.
23 Dawson RJ & Locher KP (2006) Structure of a bacte-
rial multidrug ABC transporter. Nature 443
, 180–185.
24 Ban N, Nissen P, Hansen J, Capel M, Moore PB &
Steitz TA (1999) Placement of protein and RNA struc-
tures into a 5 A
˚
resolution map of the 50S ribosomal
subunit. Nature 400, 841–847.
25 Ban N, Nissen P, Hansen J, Moore PB & Steitz TA
(2000) The complete atomic structure of the large ribo-
somal subunit at 2.4 A
˚
resolution. Science 289, 905–920.
26 Wimberly BT, Brodersen DE, Clemons WM Jr, Mor-
gan-Warren RJ, Carter AP, Vonrhein C, Hartsch T &
Ramakrishnan V (2000) Structure of the 30S ribosomal
subunit. Nature 407, 327–339.
27 Schluenzen F, Tocilj A, Zarivach R, Harms J, Glueh-
mann M, Janell D, Bashan A, Bartels H, Agmon I,
Franceschi F et al. (2000) Structure of functionally acti-
vated small ribosomal subunit at 3.3 A
˚
resolution. Cell
102, 615–623.
28 Sheldrick GM (1990) Phase annealing in SHELX-90:
direct methods for larger structures. Acta Crystallogr D
Biol Crystallogr 46, 467–473.
29 Morris RJ & Bricogne G (2003) Sheldrick’s 1.2 A
˚
rule
and beyond. Acta Crystallogr D Biol Crystallogr 59,
615–617.
30 Jelsch C, Teeter MM, Lamzin V, Pichon-Pesme V,
Blessing RH & Lecomte C (2000) Accurate protein
crystallography at ultra-high resolution: valence electron
distribution in crambin. Proc Natl Acad Sci USA 97,
3171–3176.
31 Howard EI, Sanishvili R, Cachau RE, Mitschler A,
Chevrier B, Barth P, Lamour V, Van Zandt M, Sibley
E, Bon C et al. (2004) Ultrahigh resolution drug
design I: details of interactions in human aldose reduc-
tase-inhibitor complex at 0.66 A
˚
. Proteins 55, 792–804.
32 Diederichs K & Karplus PA (1997) Improved R-factors
for diffraction data analysis in macromolecular crystal-
lography. Nat Struct Biol 4, 269–275.
33 Weiss MS & Hilgenfeld R (1997) On the use of the
merging R factor as a quality indicator for X-ray data.
J Appl Crystallogr 30 , 203–205.
34 Garman E (2003) ‘Cool’ crystals: macromolecular cryo-
crystallography and radiation damage. Curr Opin Struct
Biol 13, 545–551.
35 Ravelli RB & Garman EF (2006) Radiation damage in
macromolecular cryocrystallography. Curr Opin Struct
Biol 16, 624–629.
36 Grimes JM, Burroughs JN, Gouet P, Diprose JM, Mal-
by R, Zientara S, Mertens PP & Stuart DI (1998) The
atomic structure of the bluetongue virus core. Nature
395, 470–478.
37 Ducros V, Charnock SJ, Derewenda U, Derewenda ZS,
Dauter Z, Dupont C, Shareck F, Morosoli R, Kluepfel
D & Davies GJ (2000) Substrate specificity in glycoside
hydrolase family 10. Structural and kinetic analysis of
the Streptomyces lividans xylanase 10A. J Biol Chem
275, 23020–23026.
38 EU 3-D Validation Network (1998) Who checks the
checkers? Four validation tools applied to eight atomic
resolution structures. J Mol Biol 276, 417–436.
39 Xiang Y, Huang RH, Liu XZ, Zhang Y & Wang DC
(2004) Crystal structure of a novel antifungal protein
A. Wlodawer et al. Protein crystallography for non-crystallographers
FEBS Journal 275 (2008) 1–21 Journal compilation ª 2007 FEBS. No claim to original US government works 19
distinct with five disulfide bridges from Eucommia ulmo-
ides Oliver at an atomic resolution. J Struct Biol 148,
86–97.
40 Lubkowski J, Dauter M, Aghaiypour K, Wlodawer A
& Dauter Z (2003) Atomic resolution structure of Erwi-
nia chrysanthemi l-asparaginase. Acta Crystallogr D
Biol Crystallogr 59, 84–92.
41 Bru
¨
nger AT (1992) The free R value: a novel statistical
quantity for assessing the accuracy of crystal structures.
Nature 355, 472–474.
42 Kleywegt GJ (2007) Separating model optimization and
model validation in statistical cross-validation as
applied to crystallography. Acta Crystallogr D Biol
Crystallogr 63, 939–940.
43 Hamilton W (1974) Tests for statistical significance. In:
International Tables for X-ray Crystallography, vol. IV.
(Ibers JA & Hamilton WC, eds), pp. 285–292. The
Kynoch Press, Birmingham.
44 Laskowski RA, MacArthur MW, Moss DS & Thornton
JM (1993) procheck: program to check the
stereochemical quality of protein structures. J Appl
Crystallogr 26, 283–291.
45 Davis IW, Murray LW, Richardson JS & Richardson
DC (2004) molprobity: structure validation and all-
atom contact analysis for nucleic acids and their
complexes. Nucleic Acids Res 32, W615–W619.
46 Ramakrishnan C & Ramachandran GN (1965) Stereo-
chemical criteria for polypeptide and protein chain
conformations. II Allowed conformation for a pair of
peptide units. Biophys J 5, 909–933.
47 Bru
¨
nger AT, Adams PD, Clore GM, DeLano WL,
Gros P, Grosse-Kunstleve RW, Jiang JS, Kuszewski J,
Nilges M, Pannu NS et al. (1998) Crystallography and
NMR system: a new software suite for macromolecular
structure determination. Acta Crystallogr D Biol Crys-
tallogr 54, 905–921.
48 Addlagatta A, Krzywda S, Czapinska H, Otlewski J &
Jaskolski M (2001) Ultrahigh-resolution structure of a
BPTI mutant. Acta Crystallogr D Biol Crystallogr 57,
649–663.
49 Hendrickson WA, Strandberg BE, Liljas A, Amzel
LM & Lattman EE (1983) True identity of a diffrac-
tion pattern attributed to valyl tRNA. Nature 303,
195–196.
50 Janssen BJ, Read RJ, Bru
¨
nger AT & Gros P (2007)
Crystallography: crystallographic evidence for deviating
C3b structure. Nature 448, E1–E2.
51 Chapman MS, Suh SW, Curmi PM, Cascio D, Smith
WW & Eisenberg DS (1988) Tertiary structure of plant
RuBisCO: domains and their contacts. Science 241, 71–
74.
52 Knight S, Andersson I & Bra
¨
nde
´
n CI (1989) Reexami-
nation of the three-dimensional structure of the small
subunit of RuBisCo from higher plants. Science 244,
702–705.
53 Milne AA (1926) Winnie the Pooh, p. 25. Methuen,
London.
54 Chang G & Roth CB (2001) Structure of MsbA from
E. coli: a homolog of the multidrug resistance ATP
binding cassette (ABC) transporters. Science 293, 1793–
1800.
55 Navia MA, Fitzgerald PM, McKeever BM, Leu CT,
Heimbach JC, Herber WK, Sigal IS, Darke PL &
Springer JP (1989) Three-dimensional structure of
aspartyl protease from human immunodeficiency virus
HIV-1. Nature 337, 615–620.
56 Miller M, Jasko
´
lski M, Rao JKM, Leis J & Wlodawer
A (1989) Crystal structure of a retroviral protease
proves relationship to aspartic protease family. Nature
337, 576–579.
57 Wlodawer A, Miller M, Jasko
´
lski M, Sathyanarayana
BK, Baldwin E, Weber IT, Selk LM, Clawson L,
Schneider J & Kent SBH (1989) Conserved folding in
retroviral proteases: crystal structure of a synthetic
HIV-1 protease. Science 245, 616–621.
58 Hanson MA, Oost TK, Sukonpan C, Rich DH & Ste-
vens RC (2000) Structural basis for BABIM inhibition
of botulinum neurotoxin type B protease. J Am Chem
Soc 122, 11268–11269.
59 Rupp B & Segelke B (2001) Questions about the struc-
ture of the botulinum neurotoxin B light chain in com-
plex with a target peptide. Nat Struct Biol 8, 663–664.
60 Harding MM (1999) The geometry of metal–ligand
interactions relevant to proteins. Acta Crystallogr D
Biol Crystallogr 55, 1432–1443.
61 Harding MM (2002) Metal–ligand geometry relevant to
proteins and in proteins: sodium and potassium. Acta
Crystallogr D Biol Crystallogr 58, 872–874.
62 Harding MM (2006) Small revisions to predicted dis-
tances around metal sites in proteins. Acta Crystallogr
D Biol Crystallogr 62, 678–682.
63 Brese NE & O’Keeffe M (1991) Bond-valence parame-
ters for solids. Acta Crystallogr D Biol Crystallogr 47,
192–197.
64 Brown ID (1992) Chemical and steric constraints in
inorganic solids. Acta Crystallogr D Biol Crystallogr 48,
553–572.
65 Mu
¨
ller S, Ko
¨
pke S & Sheldrick GM (2003) Is the bond-
valence method able to identify metal atoms in protein
structures? Acta Crystallogr D Biol Crystallogr 59, 32–
37.
66 Singh C (1965) Location of hydrogen atoms in certain
heterocyclic compounds. Acta Crystallogr D Biol Crys-
tallogr 19, 861–864.
67 Wlodawer A (1982) Neutron diffraction of crystalline
proteins. Prog Biophys Mol Biol 40, 115–159.
68 Niimura N, Arai S, Kurihara K, Chatake T, Tanaka I
& Bau R (2006) Recent results on hydrogen and hydra-
tion in biology studied by neutron macromolecular crys-
tallography. Cell Mol Life Sci 63, 285–300.
Protein crystallography for non-crystallographers A. Wlodawer et al.
20 FEBS Journal 275 (2008) 1–21 Journal compilation ª 2007 FEBS. No claim to original US government works
69 Lee JE, Bae E, Bingman CA, Phillips GN Jr & Raines
RT (2007) Structural basis for catalysis by onconase.
J Mol Biol, doi: 10.1016/j.jmb.2007.09.089.
70 Dyda F, Hickman AB, Jenkins TM, Engelman A, Crai-
gie R & Davies DR (1994) Crystal structure of the cata-
lytic domain of HIV-1 integrase: similarity to other
polynucleotidyl transferases. Science 266, 1981–1986.
71 Bujacz G, Jasko
´
lski M, Alexandratos J, Wlodawer A,
Merkel G, Katz RA & Skalka AM (1995) High resolu-
tion structure of the catalytic domain of the avian sar-
coma virus integrase. J Mol Biol 253, 333–346.
72 Bujacz G, Jasko
´
lski M, Alexandratos J, Wlodawer A,
Merkel G, Katz RA & Skalka AM (1996) The catalytic
domain of avian sarcoma virus integrase: conformation
of the active-site residues in the presence of divalent
cations. Structure 4, 89–96.
73 Maignan S, Guilloteau JP, Zhou-Liu Q, Clement-Mella
C & Mikol V (1998) Crystal structures of the catalytic
domain of HIV-1 integrase free and complexed with its
metal cofactor: high level of similarity of the active site
with other viral integrases. J Mol Biol 282, 359–368.
74 Goldgur Y, Dyda F, Hickman AB, Jenkins TM, Craigie
R & Davies DR (1998) Three new structures of the core
domain of HIV-1 integrase: an active site that binds
magnesium. Proc Natl Acad Sci USA 95, 9150–9154.
75 Botos I, Melnikov EE, Cherry S, Tropea JE, Khalatova
AG, Rasulova F, Dauter Z, Maurizi MR, Rotanova
TV, Wlodawer A et al. (2004) The catalytic domain of
Escherichia coli Lon protease has a unique fold and a
Ser-Lys dyad in the active site. J Biol Chem 279, 8140–
8148.
76 Im YJ, Na Y, Kang GB, Rho SH, Kim MK, Lee JH,
Chung CH & Eom SH (2004) The active site of a Lon
protease from Methanococcus jannaschii distinctly dif-
fers from the canonical catalytic dyad of Lon proteases.
J Biol Chem 279, 53451–53457.
77 Botos I, Melnikov EE, Cherry S, Kozlov S,
Makhovskaya OV, Tropea JE, Gustchina A, Rotanova
TV & Wlodawer A (2005) Atomic-resolution crystal
structure of the proteolytic domain of Archaeoglobus
fulgidus Lon reveals the conformational variability in
the active sites of Lon proteases. J Mol Biol 351, 144–
157.
78 Holton J & Alber T (2004) Automated protein crystal
structure determination using elves . Proc Natl Acad Sci
USA 101, 1537–1542.
79 Jedrzejczak R, Dauter Z, Dauter M, Piatek R,
Zalewska B, Mroz M, Bury K, Nowicki B & Kur J
(2006) Structure of DraD invasin from uropathogenic
Escherichia coli: a dimer with swapped beta-tails. Acta
Crystallogr D Biol Crystallogr 62, 157–164.
80 Wang J, Dauter M, Alkire R, Joachimiak A & Dauter
Z (2007) Triclinic lysozyme at 0.65 A
˚
resolution. Acta
Crystallogr D Biol Crystallogr D63, 1254–1268.
81 Wlodawer A, Li M, Gustchina A, Dauter Z, Uchida K,
Oyama H, Goldfarb NE, Dunn BM & Oda K (2001)
Inhibitor complexes of the Pseudomonas serine-carboxyl
proteinase. Biochemistry 40, 15602–15611.
A. Wlodawer et al. Protein crystallography for non-crystallographers
FEBS Journal 275 (2008) 1–21 Journal compilation ª 2007 FEBS. No claim to original US government works 21