Báo cáo khoa học: Monomeric solution structure of the helicase-binding domain of Escherichia coli DnaG primase pdf
Bạn đang xem bản rút gọn của tài liệu. Xem và tải ngay bản đầy đủ của tài liệu tại đây (721.42 KB, 13 trang )
Monomeric solution structure of the helicase-binding
domain of Escherichia coli DnaG primase
Xun-Cheng Su, Patrick M. Schaeffer, Karin V. Loscha, Pamela H. P. Gan, Nicholas E. Dixon
and Gottfried Otting
Research School of Chemistry, Australian National University, Canberra, Australia
All organisms replicate DNA by copying one strand
(the leading strand) in a continuous manner, whereas
the other DNA strand (the lagging strand) is replicated
in a discontinuous manner by the synthesis of short
Okazaki fragments that are later joined into a continu-
ous strand [1]. During DNA replication, a helicase sep-
arates the double-stranded DNA into single strands,
and replication of the leading strand and synthesis of
the Okazaki fragments is initiated by RNA primers
made by the specialized RNA polymerase, primase.
The first primase to be identified and characterized
was that from Escherichia coli.
In E. coli, the replicative helicase and primase are
encoded by the dnaB and dnaG genes, respectively.
The DnaB helicase forms a hexameric ring structure
with up to three molecules of the DnaG primase
attached [2–4]. DnaG is composed of three main
domains comprising an N-terminal zinc-binding
domain for interaction with single-stranded DNA, a
central domain responsible for primer synthesis, and a
C-terminal domain (residues 434–581; DnaG-C) that
binds to the DnaB helicase. The binding interaction
with DnaB locates DnaG in the correct position to lay
down primers on newly formed single-stranded DNA
as the DnaB helicase progresses along the DNA. Pri-
mases are essential for DNA synthesis and are there-
fore targets for the development of new antibiotics [5].
No 3D structure has been determined for full-length
DnaG, but crystal structures have been obtained for the
N-terminal domain from Bacillus stearothermophilus
Keywords
DnaB; DnaG; domain swap; NMR structure;
primase
Correspondence
G. Otting, Research School of Chemistry,
Australian National University, Canberra,
ACT 0200, Australia
Fax: +61 2 61250750
Tel: +61 2 61256507
E-mail:
Database
The NMR chemical shifts and coordinates of
the structure have been submiited to the
BioMagResBank (accession code 6284) and
Protein Data Bank (accession code 2HAJ)
(Received 28 July 2006, revised 7 September
2006, accepted 11 September 2006)
doi:10.1111/j.1742-4658.2006.05495.x
DnaG is the primase that lays down RNA primers on single-stranded
DNA during bacterial DNA replication. The solution structure of the
DnaB-helicase-binding C-terminal domain of Escherichia coli DnaG was
determined by NMR spectroscopy at near-neutral pH. The structure is a
rare fold that, besides occurring in DnaG C-terminal domains, has been
described only for the N-terminal domain of DnaB. The C-terminal helix
hairpin present in the DnaG C-terminal domain, however, is either less sta-
ble or absent in DnaB, as evidenced by high mobility of the C-terminal 35
residues in a construct comprising residues 1–171. The present structure
identifies the previous crystal structure of the E. coli DnaG C-terminal
domain as a domain-swapped dimer. It is also significantly different
from the NMR structure reported for the corresponding domain of DnaG
from the thermophile Bacillus stearothermophilus. NMR experiments
showed that the DnaG C-terminal domain does not bind to residues 1–171
of the E. coli DnaB helicase with significant affinity.
Abbreviations
DnaB(1–171), residues 1–171 of E. coli DnaB helicase; DnaB-N, the N-terminal domain (residues 24–136) of E. coli DnaB helicase; DnaG-C,
the C-terminal domain of DnaG primase (residues 434–581 of the E. coli protein); DTPA-BMA, diethylenetriamine pentaacetic acid-
bismethylamide; P16, the C-terminal domain of Bacillus stearothermophilus DnaG (residues 452–597).
FEBS Journal 273 (2006) 4997–5009 ª 2006 The Authors Journal compilation ª 2006 FEBS 4997
[6], the central RNA polymerase domain from E. coli
[7,8], the two-domain fragment comprising both the
N-terminal and RNA polymerase domains from
Aquifex aeolicus [9], and the C-terminal helicase-binding
domain from E. coli [4]. In addition, the structure of
the C-terminal domain from B. stearothermophilus
(P16) has been determined by NMR spectroscopy [10].
Despite their conserved function, the crystal struc-
ture of E. coli DnaG-C [4] and the subsequent solution
structure of B. stearothermophilus P16 [10] show sub-
stantial differences, including a different number of
helices with different helix boundaries and a different
spatial arrangement of the C-terminal helices. These
differences are important, because the C-terminal helix
hairpin is critical for the binding of DnaG to DnaB
[10,11]. In P16, the C-terminal helices are only loosely
held in place by the rest of the structure [10]. In both
structures, the N-terminal helices are packed in a fold
similar to that of the N-terminal domain of DnaB
(residues 24–136; DnaB-N) [12,13], and the DnaG-C
crystal structure shows the C-terminal helices from
different monomers entwined via intermolecular con-
tacts in a way reminiscent of the fold of DnaB-N. The
dimer structure was distorted by crystal contacts,
resulting in noticeably different backbone conforma-
tions and different orientations of the C-terminal heli-
ces in each of the two monomers [4].
However, both gel filtration and analytic ultracen-
trifugation experiments at neutral pH showed that
DnaG-C was monomeric [4], and it was difficult to
ascribe any functional significance to the dimer. In
addition, NMR spectroscopic analysis showed little
evidence for dimer formation in solution. Some NOEs
were observed that were consistent with the dimer
interface observed in the crystal structure, and these
were interpreted as evidence for a monomer–dimer
equilibrium [4], but they could also arise from intramo-
lecular contacts in solution that are not present in the
monomers in the crystal structure. In order to resolve
these difficulties and the discrepancies between the
structure of P16 (which is monomeric in solution) and
the different conformers in the crystal structure of
DnaG-C, we here report the solution structure of
E. coli DnaG-C determined under conditions where
the protein is strictly monomeric.
This new structure differs from the conformers
observed in the single crystal, reveals a fold even
closer to that of DnaB-N than the crystal conform-
ers, and shows no evidence for the presence of two
independent subdomains as in P16. The conforma-
tional rigidity of the monomeric DnaG-C structure
was confirmed by
15
N-relaxation, coupling constant
and solvent accessibility measurements. The structure
identifies the crystal structure of DnaG-C as a
domain-swapped dimer that probably has no func-
tional significance.
The close fold conservation between DnaG-C and
DnaB-N prompted us also to investigate a longer
N-terminal construct of DnaB, DnaB(1–171), for the
presence of a C-terminal helix hairpin as present in
DnaG-C. DnaB(1–171) comprises the complete N-ter-
minal domain and hinge regions of DnaB identified by
proteolysis [14], and includes peptide segments that
have previously been shown by mutation analyses to
modulate the interaction between DnaG and DnaB
[3,11,15,16]. Consequently, we also probed the interac-
tion between DnaG-C and DnaB(1–171).
Results
Aggregation state of DnaG-C
DnaG-C is prone to self-aggregation at high protein
concentration and in the absence of salt [17]. Ultra-
centrifugation experiments at 0.06 and 0.29 mm pro-
tein concentration in the presence of 100 mm NaCl
yielded M
r
values of 16 500 and 14 100, respectively,
indicating that the single species present was the
monomer (calculated M
r
¼ 16 701; supplementary
Fig. S1). To verify the monomeric state of the protein
under the conditions used for NMR structure deter-
mination (0.4 mm DnaG-C, pH 6.1, 100 mm NaCl,
25 °C), the rotational correlation time of DnaG-C
was determined from the ratio of transverse and lon-
gitudinal
15
N relaxation rates. The rotational correla-
tion time s
m
was found to be 11 ± 1 ns, based on
average values of R
1
¼ 0.99 ± 0.13 s
)1
and R
2
¼
20.41 ± 1.68 s
)1
for the structurally well-defined part
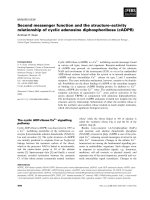
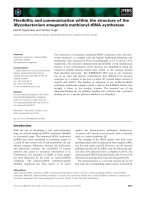
of the protein (Fig. 1). Increased R
1
and decreased R
2
relaxation rates indicated increased mobility and
structural disorder for about 12 and three residues at
the N-terminus and C-terminus of the construct,
respectively, in agreement with the narrow
1
H-NMR
line widths reported earlier for these residues [17].
Negative [
1
H]
15
N NOEs were observed for residues
437–441 at the N-terminus, demonstrating mobility
on the subnanosecond timescale, whereas the NOE
was greater than 0.7 for residues 453–578, indicating
structural rigidity for this part of the protein (data
not shown).
The rotational correlation time of rigid protein
structures can be predicted from the atomic coordi-
nates using hydronmr [18]. The rotational correlation
times predicted for the individual monomers and the
dimer in the crystal structure of DnaG-C [4] were
about 17 and 36 ns, respectively, and thus much longer
Solution structure of E. coli DnaG-C X C. Su et al.
4998 FEBS Journal 273 (2006) 4997–5009 ª 2006 The Authors Journal compilation ª 2006 FEBS
than the value of 11 ns derived from the
15
N-relaxa-
tion times in solution. However, rotational correlation
times of, respectively, 11 and 12 ns were predicted for
the corresponding domain from B. stearothermophilus
[10] and for the monomeric DnaG-C structure repor-
ted here. These data and the uniformity of the relaxa-
tion rates along the amino acid sequence (Fig. 1)
supported the notion of DnaG-C being a monomeric,
structurally compact domain with no evidence for seg-
mentation into subdomains as observed in the crystal
structure [4] and reported for P16 [10].
Structure determination
The solution structure of E. coli DnaG-C was deter-
mined using NOEs and backbone dihedral angle
restraints derived from chemical shifts. All NOEs were
interpreted as intramolecular NOEs. The resulting
monomeric structure fulfilled all assigned NOEs with-
out significant residual violations (Table 1). The fold
exposes all charged amino acid side chains to the sol-
vent and buries all hydrophobic side chains that are
highly conserved among different bacterial species
(Fig. 2). The side chain solvent accessibility averaged
over the different NMR conformers is 16% or less for
any of the conserved hydrophobic side chains, except
for the side chain of Leu484, which is almost 30% sol-
vent exposed. The conservation of Leu484 may be
explained by its contacts with Leu519, which is a
strictly conserved residue (Fig. 2). Insertions and dele-
tions in the sequence alignment of Fig. 2 are all con-
fined to loop regions, indicating that the secondary
structure of DnaG-C is conserved among DnaG mole-
cules from many different bacterial species.
h1 h2
h3
h4
h5
h6
h7
1.5
1.0
0.5
0.0
R
1
s
-1
440 460 480 500 520 540 560 580
Residue number
0
30
20
10
R
2
s
-1
Fig. 1.
15
N-relaxation rates measured for
15
N ⁄
13
C-labeled DnaG-C. The data were
measured at a
1
H-NMR frequency of
800 MHz, using a 0.4 m
M solution of DnaG-C
in NMR buffer at 25 °C. Upper panel,
R
1
relaxation rates. Lower panel, R
2
relaxation rates. Error bars indicate the error
reported by the fitting routine in
SPARKY [40].
Table 1. Structural statistics for the NMR conformers of E. coli
DnaG primase C-terminal domain (DnaG-C).
Parameter Value
Number of assigned NOE cross-peaks
a
2400
Number of nonredundant NOE upper-distance
limits
2151
Number of dihedral-angle restraints 154
Intraprotein AMBER energy (kcalÆmol
)1
) ) 4575 ± 1176
Maximum NOE-restraint violations (A
˚
) 0.17 ± 0.06
Maximum dihedral-angle restraint violations (°) 3.1 ± 3.1
rmsd for N, C
a
and C¢ (A
˚
)
b,c
0.8 ± 0.2
rmsd for all heavy atoms (A
˚
)
b,d
1.2 ± 0.2
Ramachandran plot appearance
e
Most favored regions (%) 85.7
Additionally allowed regions (%) 11.8
Generously allowed regions (%) 1.4
Disallowed regions (%)
f
1.1
a
Stereospecific resonance assignments were obtained for 26 pairs
of C
b
H
2
groups, two pairs of C
c
H
2
and C
d
H
2
groups, and six pairs
of C
c
H
3
and C
d
H
3
groups.
b
For residues 449–576.
c
0.5 ± 0.1 A
˚
for
residues 449–525.
d
0.9 ± 0.1 A
˚
for residues 449–525.
e
From PRO-
CHECK NMR
[37].
f
All residues in disallowed regions were located in
loop regions or at the C-terminus of the structure. No residue was
consistently found in disallowed regions.
X C. Su et al. Solution structure of E. coli DnaG-C
FEBS Journal 273 (2006) 4997–5009 ª 2006 The Authors Journal compilation ª 2006 FEBS 4999
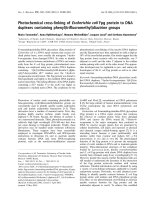
The fold of DnaG-C comprises six helices arranged
as in the N-terminal domain of DnaB (Fig. 3A,B).
Pairwise comparison using the CE server [19] gave an
rmsd between the two proteins of 3.3 A
˚
for 101
aligned residues. No other protein in the Protein Data
Bank has a similar fold (other than P16 from
B. stearothermophilus; see below).
Comparison with the crystal structure of DnaG-C
The crystal structure of dimeric DnaG-C [4] contains
two DnaG-C molecules with different orientations and
boundaries of helix 6 (Fig. 3D,E), showing that this
helix can be separated from the core of the structure.
The solution structure of DnaG-C identifies the crystal
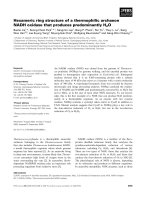
Fig. 2. Sequence alignment of DnaG-C with homologs from different bacterial species. The sequence numbering of E. coli DnaG-C is shown
at the top, together with the helix boundaries of DnaG-C determined in this work. Conserved hydrophobic residues are shaded dark gray.
The amino acid sequence of DnaG-C from B stearothermophilus is shown at the bottom together with the helix boundaries reported by
Syson et al. [10] The following sequences from DnaG-C proteins are shown (abbreviation, species, GenBank number): E. coli, Escherichia
coli, 130908; S. enterica, Salmonella enterica subsp. enterica serovar Paratyphi A, str. ATCC 9150, 56129407; Y. pestis, Yersinia pestis
CO92, 15978733; P. luminescens, Photorhabdus luminescens subsp. laumondii TTO1, 36787269; E. carotovora, Erwinia carotovora subsp.
atroseptica SCRI1043, 49610155; B. aphidicola, Buchnera aphidicola str. Sg (Schizaphis graminum), 21622949; C. blochmannia, Candidatus
blochmannia pennsylvanicus str. BPEN, 71795953; V. parahe, Vibrio parahaemolyticus RIMD 2210633, 28805388; H. somnus, Haemophilus
somnus 2336, 46156266; P. multocida, Pasteurella multocida subsp. multocida str. Pm70, 12721596; I. loihiensis, Idiomarina loihiensis
L2TR, 56180311; P. profundum, Photobacterium profundum SS9, 46912067; X. fastidiosa, Xylella fastidiosa Dixon, 71164362; L. pneumophila,
Legionella pneumophila, 1575484; P. syringae, Pseudomonas syringae pv. tomato str. DC3000, 28851001; B. stearo, Bacillus stearothermo-
philus, 78101045. The sequences were identified and aligned in a
BLAST search [41], except for the sequence of B. stearothermophilus,
which was aligned on the basis of its secondary structure elements.
Solution structure of E. coli DnaG-C X C. Su et al.
5000 FEBS Journal 273 (2006) 4997–5009 ª 2006 The Authors Journal compilation ª 2006 FEBS
structure of DnaG-C as a domain-swapped dimer,
where helix 6 from one protein molecule binds to the
core of the other in a manner similar to that in which
helix 6 binds to the core of the structure in the mono-
meric solution structure (Figs 3A and 4).
The two conformers in the crystal structure vary not
only with regard to helix 6 (Fig. 3D,E) but also in the
part comprising helices 1–5, with a backbone rmsd of
2.0 A
˚
for residues 449–525. The differences are mostly
due to a displacement of helix 5 and variability in the
loop region between helices 2 and 3. The backbone
rmsd for the same residues with respect to the solution
structure is 1.8 ± 0.1 and 2.4 ± 0.1 A
˚
for crystal con-
formers I and II, respectively. The largest differences
are in the loop region between helices 2 and 3, suggest-
ing that this region is flexible.
Whereas
15
N-HSQC spectra of DnaG-C at pH 4.6,
6.1 and 8.1 displayed virtually the same chemical
shifts, some of the cross-peaks in the spectrum recor-
ded at pH 4.6 (the pH used for crystallization) were
exceedingly weak, especially in the loop regions
between helices 2 and 7 (supplementary Figs S2 and
S3). This indicates the presence of chemical exchange
phenomena at low pH in the millisecond time regime.
Increased mobility of the loop regions at pH 4.6 and
8.1 was also suggested by the observation of enhanced
15
N-relaxation rates (supplementary Fig. S4). There-
fore, the domain swap observed in the crystal structure
may have been due to the use of a pH value below the
isoelectric point of the protein (5.0). As comparable
NMR line widths and
15
N-relaxation rates were
observed for the regular secondary structure elements
at all three pH values, the domain-swapped dimer is
not the major conformational species even at low pH.
Comparison with P16 from B. stearothermophilus
Except for the C-terminal helices, the solution struc-
ture of P16, the DnaG-C domain from B. stearo-
thermophilus [10], shows the same overall fold as the
present solution structure of E. coli DnaG-C
(Fig. 3A,C). However, the similarity is less striking
h1
h2
h3
h4
h5
h6
h7
h1
h2
h3
h4
h5
h6
h6
h7
DE
crystal conformer I crystal conformer II
DnaG-C
DnaG-C
h1
h2
h3
h4
h5
h6
h7
h1
h2
h3
h4
h5
h6
h1
h2
h3
h4
h5
h6
h7
h8
A
B
C
DnaG-C
DnaB-N P16
solution structure
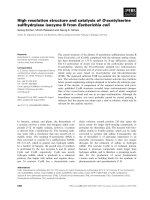
Fig. 3. Ribbon representations of DnaG-C and related proteins. (A) E. coli DnaG-C. The short 3
10
helix between helices 2 and 3 was found in
fewer than half of the NMR conformers and was therefore not labeled. It was also found in conformer II but not conformer I of the crystal
structure [4]. (B) N-terminal domain of E. coli DnaB (residues 24–136) [12]. (C) B. stearothermophilus DnaG-C (fragment P16) [10]. (D) Con-
former I of the crystal structure dimer of E. coli DnaG-C [4]. (E) Conformer II of the crystal structure dimer of E. coli DnaG-C [4].
X C. Su et al. Solution structure of E. coli DnaG-C
FEBS Journal 273 (2006) 4997–5009 ª 2006 The Authors Journal compilation ª 2006 FEBS 5001
than anticipated based on the functional similarity of
DnaG-C domains, with a backbone rmsd of 3.2 A
˚
for
88 aligned residues from the globular part of P16 (cor-
responding to residues 449–543 of E. coli DnaG-C),
which excludes helices 7 and 8 of P16 (Fig. 1). Helices
6 and 7 of P16 do not form a single continuous helix
as in E. coli DnaG-C, but are connected by a flexible
linker, entailing a very different orientation of the
C-terminal helix hairpin with respect to the core of the
structure [10].
A
H541 H541
R448 R448
K447 K447
NN
I530 I530
C C
B
C
F535
L464
L454
E532 E532
L454
L464
F535
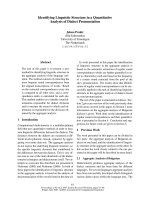
Fig. 4. Stereo views of the solution and
crystal structures of DnaG-C. (A) Superposi-
tion of the backbone atoms of residues
447–581 of the 20 NMR conformers of
DnaG-C representing the NMR structure
(Table 1). Numbers identify sequence posi-
tions as in Fig. 2. The 15 flexible N-terminal
residues were not plotted. (B) Stereo view
of the DnaG-C conformer closest to the
mean structure of the 20 conformers shown
in (A), using a heavy atom representation.
The polypeptide backbone is drawn as a rib-
bon and the flexible N-terminal 15 residues
are omitted for clarity. The following colors
were used for the side chains: blue, Arg,
Lys, His; red, Glu, Asp; yellow, Ala, Cys, Ile,
Leu, Met, Phe, Pro, Trp, Val; gray, Asn, Gln,
Ser, Thr, Tyr. Darker-shaded bold lines indi-
cate the side chains of Lys447, Lys448,
Ile530 and His541. (C) Domain-swapped
dimer in the crystal structure of DnaG-C [4].
Only residues 447–528 of conformer I and
residues 527–580 of conformer II of the
crystal structure are shown, with white and
magenta ribbons tracing the backbones of
the respective conformers. Darker-shaded
bold lines indicate the side chains of
Lys447, Lys448, Ile530 and His541. The
side chain of Ile530 is buried in the dimer
interface by packing against Ile530 from the
other monomer (not shown). The side
chains of Glu532, Phe535, Leu454 and
Leu464 are labeled. NOEs between these
residues are explained by the monomeric
solution structure, but are also predicted by
intermolecular interactions in the dimer of
the crystal structure [4].
Solution structure of E. coli DnaG-C X C. Su et al.
5002 FEBS Journal 273 (2006) 4997–5009 ª 2006 The Authors Journal compilation ª 2006 FEBS
The structural differences between P16 and E. coli
DnaG-C may be explained by the low sequence
homology between the two proteins. Although P16 fea-
tures 14 of the 16 hydrophobic side chains found with
high conservation among DnaG-Cs from different bac-
terial species, the structure-based sequence alignment
of Fig. 2 resulted in only 13% sequence identity
between P16 and E. coli DnaG-C. The low sequence
homology also explains why our structure-based
sequence alignment is very different from the sequence
alignment reported earlier [10].
The flexibility of the linker peptide connecting heli-
ces 6 and 7 in P16 (Fig. 3C) and the different breaking
points in helix 6 of E. coli DnaG-C observed in the
crystal structure (Fig. 3D,E) raise questions about the
flexibility of helix 6 of E. coli DnaG-C in solution.
Structure verification of helix 6 of DnaG-C
An extensive set of H
a
(i)-H
N
(i+3) NOEs,
3
J
HNHa
coupling constants smaller than 6 Hz, and chemical
shifts (
15
N,
13
C
a
,
13
C
b
,
1
H
a
and
13
C¢) indicative of heli-
cal secondary structure along the length of helix 6, all
suggest that a straight helix as depicted in Fig. 3A is a
faithful representation of this helix in DnaG-C under
the conditions of the NMR experiments. Measure-
ments of the
3
J
HNHa
coupling constants at 20 lm
rather than 0.4 mm protein concentration (data not
shown) did not yield significantly increased coupling
constants, showing that the structure of helix 6 is not
stabilized by concentration-dependent self-association.
Although the NMR structure of DnaG-C should be
a reliable representation of the average structure in
solution, this does not exclude the possibility of small
populations of conformers with spontaneously formed
transient breaks in helix 6 as a possible prelude to the
formation of a domain-swapped dimer. We carefully
analyzed the NOESY spectra of DnaG-C with regard
to this question. As NOEs strongly emphasize the
presence of short internuclear distances, NOE spectra
can convey the signature of minor conformational spe-
cies if short internuclear distances occur in a minor,
but not in the major, conformation. However, the 3D
15
N-NOESY-HSQC spectrum of DnaG-C recorded at
0.4 mm protein concentration on a 800 MHz NMR
spectrometer showed no significantly different NOE
patterns compared to the corresponding spectrum
recorded previously on a 600 MHz NMR spectrometer
with a 0.6 mm sample in the same NMR buffer [4]. In
particular, strong sequential H
N
–H
N
NOEs and weak
sequential H
a
–H
N
NOEs characteristic of helical sec-
ondary structure were found all along helix 6. Further-
more, no evidence for a minor population of the
domain-swapped dimer could be found, as all NOEs
previously thought to be indicative of the domain-
swapped dimer [4] were in agreement with the present
monomeric structure and independent of protein con-
centration between 0.2 and 0.4 mm.
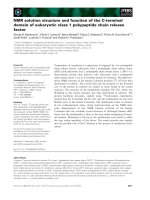
The flexibility of helix 6 was further investigated by
measurements of the solvent accessibility of amide pro-
tons as evidenced by enhanced
1
H-NMR line widths
observed in the presence of a soluble paramagnetic
relaxation agent. Breaks in this helix would be expec-
ted to interrupt the hydrogen bonding pattern and
expose some of the amide protons to the solvent. We
used Gd[diethylenetriamine pentaacetic acid-bismethyl-
amide (DTPA-BMA)] as an uncharged relaxation
enhancement agent that does not change the chemical
shifts of the protein signals [20]. In addition, we used a
low protein concentration (40 lm) to minimize the
chance of any self-association. Comparison of the peak
heights measured in
15
N-HSQC spectra recorded with
and without Gd(DTPA-BMA) revealed pronounced
solvent exposure only for loop regions between helices
and for the flexible N-terminal residues (Fig. 5). In
contrast, the amide protons of helix 6 were among the
protected protons. In view of the uncertainty ranges
associated with the data points, the slightly enhanced
relaxation rates observed for the amide protons of resi-
dues 541, 543, and 548 barely indicates significant
temporary solvent exposure in a conformational
equilibrium.
Structure investigation of DnaB(1–171)
The striking structural homology between DnaG-C
and DnaB-N (Fig. 3A,B) invites the question of whe-
ther a longer construct of DnaB-N could display a
C-terminal helix hairpin like DnaG-C, considering that
it is a feature of all DnaG-C conformers reported to
date. Secondary structure prediction of DnaB suggests
a helix for residues 153–169 and an extension of helix
6 by 11 amino acids to residue 145. As our original
DnaB-N construct was truncated at Glu161, this could
have caused the random coil behavior reported from
residue 137 onwards [21].
A TOCSY spectrum recorded of DnaB(1–171), how-
ever, displayed the same cross-peaks as the TOCSY
spectrum reported previously of DnaB(1–161) [21] with
additional cross-peaks for the 10 additional C-terminal
residues (data not shown). Owing to the increased M
r
effected by dimerization of the DnaB-N domain [12],
the TOCSY spectrum recorded with a long mixing
time (80 ms) strongly emphasizes the signals from the
mobile residues with narrow line widths. In the TOC-
SY spectrum of DnaB(1–171), narrow line widths and
X C. Su et al. Solution structure of E. coli DnaG-C
FEBS Journal 273 (2006) 4997–5009 ª 2006 The Authors Journal compilation ª 2006 FEBS 5003
random coil chemical shifts were observed for the
entire polypeptide segment from residues 137 to 171.
Therefore, the C-terminal helix hairpin observed in
DnaG-C is not a structural feature of DnaB(1–171).
Interaction of DnaG-C with DnaB(1–171)
Binding of DnaG-C to DnaB(1–171) was probed
by comparing the
15
N-HSQC spectra of 0.13 mm
15
N ⁄
13
C-labeled DnaG-C in the absence and presence of an
equal amount of unlabeled DnaB(1–171). No chemical
shift changes or changes in peak intensities were detec-
ted. This indicates that any binding between these two
domains would be characterized by a dissociation
constant of at least 0.5 mm. A dissociation constant of
4.9 lm has been reported for the complex between
DnaG-C and full-length DnaB from BIAcore studies
[4].
In agreement with the NMR results, no inhibitory
interaction between DnaB(1–171) and full-length
DnaG could be observed in a BIAcore assay, where a
5 lm solution of DnaB(1–171) was mixed with 285 nm
DnaG prior to its injection over a surface displaying
single-stranded DNA-bound DnaB hexamer, under
conditions used in our earlier studies [4] (data not
shown). Furthermore, there was no sign of toxicity of
DnaB(1–171) when overexpressed in E. coli, as might
have been expected if tight binding of DnaB(1–171) to
DnaG were to compete with its interaction with the
DnaB hexamer.
Discussion
The present structure determination of DnaG-C
revealed a fold very similar to that of the N-terminal
domain of the E. coli DnaB helicase (DnaB-N) [12,13].
The similarity includes helix 6, which is differently ori-
ented in the conformers of the domain-swapped dimer
(Fig. 3). The structural similarity between DnaG-C
and DnaB-N is intriguing, as no other protein is
known with this particular fold, and DnaG binds to
DnaB. In view of the critical importance of the C-ter-
minal helix hairpin of DnaG-C for the interaction with
DnaB [4,10], it is tempting to speculate that the
domain-swapped dimer observed in the crystal struc-
ture of E. coli DnaG-C might serve as a model for the
interaction with DnaB-N.
Many attempts have been made to pinpoint the
interaction between DnaG and DnaB to protein sub-
domains. Whereas the interaction seems to be entirely
confined to the C-terminal domain of DnaG [4,10], the
situation is much less clear for DnaB. For example,
mutations in the N-terminal domain of E. coli DnaB
have been shown to interfere with the DnaB–DnaG
interaction [22], but corresponding mutations in B. ste-
arothermophilus had much smaller if any effects [3,16].
440 460 480 500 520 540 560 580
0.0
0.5
1.0
h1 h2
h3 h4 h5 h6 h7
Residue number
Relative
intensity
Fig. 5. Intensity ratio of backbone amide cross-peaks in
15
N-HSQC spectra of 0.04 mM
15
N ⁄
13
C-labeled E. coli DnaG primase (DnaG-C) in the
presence and absence of 6.0 m
M Gd(DTPA-BMA).
Solution structure of E. coli DnaG-C X C. Su et al.
5004 FEBS Journal 273 (2006) 4997–5009 ª 2006 The Authors Journal compilation ª 2006 FEBS
Apparently inconsistent results could arise from the
fact that E. coli DnaB-N is only marginally stable
against unfolding [23,24] and easily destabilized by
mutations. In B. stearothermophilus, DnaG was found
to protect the linker residues between the N-terminal
and C-terminal domains of DnaB from digestion with
trypsin and pepsin [25]. Mutations of linker residues
(I135N, I141T, L156P) also affected the interaction of
Salmonella typhimurium DnaB and DnaG [15]. In
E. coli, the interaction depends in addition on residues
of the C-terminal domain between Tyr210 and Val255 of
DnaB [26]. Mutation analysis of linker residues and of
residues in the C-terminal domain of B. stearothermo-
philus DnaB confirmed the importance of residues in
these parts of the protein [3,16]. Unlike in the wild-
type protein, the individual N-terminal and C-terminal
domains of B. stearothermophilus DnaB do not form a
complex with DnaG that is sufficiently stable for isola-
tion by gel filtration [25]. The emerging picture is one
of an extensive interaction interface between DnaB
and DnaG-C involving the N-terminal and C-terminal
domains of DnaB as well as the connecting linker
[3,16].
Interactions characterized by exceedingly weak bind-
ing affinities can be probed sensitively by NMR spectro-
scopy. However, attempts to observe an interaction
between E. coli DnaG-C and a shorter DnaB-N frag-
ment containing the N-terminal 161 residues by NMR
spectroscopy were unsuccessful [4]. Our new fragment
DnaB(1–171), which includes many of the linker resi-
dues, equally showed no binding with DnaG-C or
DnaG, illustrating the critical importance of the C-ter-
minal domain of DnaB for this interaction. Possibly,
the linker between the N-terminal and C-terminal
domains of DnaB also assumes a different secondary
structure in the full-length protein, considering that we
found the C-terminal 35 residues of DnaB(1–171) to be
disordered, although secondary structure predictions
show high helix propensity for more than half of them.
The present structure of monomeric E. coli DnaG-C
identifies the earlier crystal structure of the same pro-
tein as a domain-swapped dimer, in which helix 5 of
one monomer binds to the core of helices formed by
helices 1–4 of the other, in a very similar manner as in
the monomeric solution structure. The present data
suggest that the domain-swapped dimer occurs only at
a pH value below the isoelectric point of the protein
and plays no role under physiologic conditions. As the
present solution structure of DnaG-C accommodates
all the NOEs discussed previously [4] in a monomeric
structure, there remains no evidence for intermolecular
interactions across a dimer interface, and no conform-
ational exchange phenomena need to be invoked to
explain differences between the NMR data and the
crystal structure [4].
The sensitivity of the DnaG-C structure with respect
to pH is reflected in much decreased peak intensities
for loop residues observed in
15
N-HSQC spectra at
pH 4.6 versus those recorded at pH 6.1 or 8.1, and in
increased
15
N-relaxation rates for amides in loop
regions. These exchange phenomena indicate the pres-
ence of alternative conformations, especially at low
pH. Considering that carboxylate side chains remain
mostly deprotonated at pH 4.6, the low-pH form of
the DnaG-C structure may be triggered by protonation
of histidine side chains. Of the two histidine residues
in DnaG-C, His541 is located in helix 6. In the solu-
tion structure, His541 is close to Lys447 and Lys448,
which are located near the N-terminus of the domain,
whereas these residues are much farther from His541
in the domain-swapped dimer (Fig. 4A,B). Electro-
static repulsion could thus drive the separation of helix
6 from the core of the structure. Weak and missing
15
N-HSQC cross-peaks observed for His541 and
nearby residues, including residues 445–450, suggest
that histidine protonation contributes to the exchange
phenomena at pH 4.6 (supplementary Fig. S3).
Comparison of the solvent-accessible surface of
hydrophobic amino acid side chains in the monomer
and the dimer shows only few significant differences,
with the most notable difference involving the side
chain of Ile530, which is highly solvent exposed in the
monomer (Fig. 4B) but buried in the dimer interface.
Neither His541 nor Ile530 are conserved in the amino
acid sequence (Fig. 2), suggesting that the phenomenon
of domain-swapping at low pH may be limited to
DnaG-C from E. coli. Considering, in addition, the
apparent absence of any interaction between DnaG-C
and DnaB(1–171), the domain-swapped dimer of
DnaG-C is unlikely to be a model of the DnaG–DnaB
interaction.
The equivalent DnaG-C domain from B. stearother-
mophilus (P16) [10] is a monomer in solution, but helix
6 in this structure is broken into two (Fig. 3C). A flex-
ible helix linkage is supported by the presence of
Pro556 in P16, which may act as a helix breaker. The
corresponding residue in E. coli DnaG-C is Met542,
i.e. a residue with high helix propensity. None of the
other DnaG-C domains shown in the sequence align-
ment of Fig. 2 features a proline residue at this posi-
tion, suggesting that a break in helix 6 is not a general
feature of DnaGs from different organisms. Therefore,
although the present solution structure of E. coli
DnaG-C is representative of DnaG-C domains from a
large number of bacteria, significant structural variabil-
ity seems to have evolved in less closely related species,
X C. Su et al. Solution structure of E. coli DnaG-C
FEBS Journal 273 (2006) 4997–5009 ª 2006 The Authors Journal compilation ª 2006 FEBS 5005
where the sequence divergence is sufficiently large to
render amino acid sequence alignments unreliable [10].
This observation highlights the fact that structures
determined for thermophilic or Gram-positive bacteria
are not necessarily faithful representations of their
homologs in E. coli, the bacterium for which most bio-
chemical knowledge has been accumulated.
Experimental procedures
Sample preparation
Unlabeled and uniformly
13
C ⁄
15
N-labeled DnaG-C contain-
ing residues 434–581 was overproduced and purified as pre-
viously described [17]. All samples for NMR measurements
were prepared in a buffer containing 90% H
2
O ⁄ 10% D
2
O,
10 mm phosphate (pH 6.1), 100 mm NaCl and 1.0 mm
dithiothreitol. The protein concentration was 0.4 mm except
where indicated otherwise.
The DnaB(1–171) deletion mutant was amplified by PCR
from plasmid pPS562 containing the dnaB gene [27]. An
NdeI site was present at the ATG start codon, and a TAA
stop codon followed by an EcoRI site was inserted immedi-
ately after codon 171. The amplified fragment was digested
and inserted between corresponding restriction sites in the
phage T7 promoter-based vector pETMCSI [28] and trans-
formed into E. coli strain BL21(DE3)recA [23] for protein
expression. Nucleotide sequences were confirmed using an
ABI 3730 sequencer (Biomolecular Resource Facility, Aus-
tralian National University, Canberra, Australia), following
the recommendations of the manufacturer (Applied Biosys-
tems, Foster City, CA, USA). DnaB(1–171) was produced
and the cells were lysed using a procedure established for
other DnaB-N domains [21]. After cell lysis, the protein
was purified as described [12], except that the Sephadex
G50 column (Amersham Biosciences, Uppsala, Sweden)
was equilibrated with 50 mm Tris ⁄ HCl (pH 7.6), 5 mm
MgCl
2
and 100 mm NaCl. Peak fractions containing
DnaB(1–171) were pooled (20 mL), diluted with an equal
volume of MonoQ buffer (50 mm Tris ⁄ HCl at pH 7.6 and
5mm MgCl
2
), and loaded directly onto a MonoQ (HR 5 ⁄ 5)
column (Amersham Biosciences) equilibrated in MonoQ
buffer. A linear gradient of NaCl in MonoQ buffer was
applied (3.75 mmÆmin
)1
, at a flow rate of 0.5 mLÆmin
)1
).
DnaB(1–171) eluted as a sharp peak between 52 and
58 min. The protein fractions were pooled and dialyzed in
NMR buffer. ESI MS confirmed the identity of the protein
and the absence of an N-terminal methionine (observed
molecular mass, 18 919; calculated molecular mass 18 920).
Analytic ultracentrifugation
The molecular weights of DnaG-C samples were deter-
mined by equilibrium sedimentation using a Beckman
analytical ultracentrifuge XLI with An-60 rotor (Beckman
Coulter, Fullerton, CA, USA). The samples were prepared
by dialysis against a buffer similar to that used for NMR
studies, containing 10 mm sodium phosphate (pH 6.1),
100 mm NaCl, 1 mm dithiothreitol, and 0.1% (w ⁄ v) sodium
azide at two different concentrations (1.02 and
4.86 mgÆmL
)1
). The sedimentation equilibrium profile was
recorded in triplicate at two different wavelengths (280 and
300 nm) after 18 h at 20 000 r.p.m. and 25 °C. Plots of
ln A versus r
2
were linear (supplementary Fig. S1), indica-
ting the absence of an equilibrium mixture of species at
both concentrations. The average M
r
was calculated by
linear regression using ultrascan data analysis software
Version 5 (Beckman Coulter), and an (assumed) partial
specific volume of 0.72 mLÆg
)1
.
NMR measurements
NMR measurements of unlabeled DnaB(1–171) were car-
ried out in a buffer containing 10 mm Tris ⁄ HCl (pH 6.5),
50 mm NaCl, 5 mm MgCl
2
and 1 mm dithiothreitol. Free
DnaB(1–171) was measured at a concentration of 0.22 mm.
The interaction with DnaG-C was probed using the same
buffer with each protein at 0.13 mm.
All NMR spectra were recorded at 25 °C using a Bruker
(Karlsruhe, Germany) AV 800 NMR spectrometer
equipped with a TCI cryoprobe. The previously reported
backbone resonance assignments of DnaG-C [4] were veri-
fied and supplemented with side chain resonance assign-
ments using 3D CC(CO)NH, HNHA (H)CCH-TOCSY,
NOESY-
15
N-HSQC (60 ms mixing time),
13
C-HSQC-
NOESY (40 ms mixing time), and 2D NOESY (40 ms
mixing time), DQF-COSY, and TOCSY spectra.
3
J
HNHa
coupling constants were measured at protein con-
centrations of 20 and 400 lm, in a CT-HMQC-HN experi-
ment [29]. The solvent exposure of protein backbone
amides was probed by the decrease in peak intensities
observed in
15
N-HSQC spectra caused by 6 mm Gd(DTPA-
BMA) [20]. The experiment was carried out at protein con-
centrations of 20 and 40 lm.
15
N-relaxation parameters (R
2
, R
1
, and [
1
H]
15
N-NOE)
were measured [30], using relaxation delays of 3, 30, 80,
150, 250, 400, 600, 850 and 1200 ms in the R
1
experiment,
and relaxation delays of 8.8, 17.6, 26.4, 35.2, 44.0, 52.8,
61.6, 70.4, 79.2 and 88.0 ms in the R
2
experiment. The rota-
tional correlation time s
m
was estimated from the R
2
⁄ R
1
ratio [31].
A TOCSY spectrum of DnaB(1–171) was recorded under
the same conditions, using a mixing time of 80 ms.
Restraints used for the structure calculation
In total, 2400 NOE cross-peaks were assigned and integra-
ted, resulting in 2151 meaningful distance restraints. Most
Solution structure of E. coli DnaG-C X C. Su et al.
5006 FEBS Journal 273 (2006) 4997–5009 ª 2006 The Authors Journal compilation ª 2006 FEBS
of these restraints were collected from the 2D NOESY
spectrum (40 ms mixing time) of unlabeled DnaG-C in
22 h, using t
1max
¼ 78 ms and t
2max
¼ 213 ms. Dihedral
angle restraints were generated using the program talos
[32] and checked by comparison with the measured
3
J
HNHa
coupling constants and intensities of intraresidual and
sequential NOEs between backbone protons. Stereospecific
resonance assignments and v
1
angle restraints were
obtained by repeated structure calculations and evaluations
using the programs cyana and glomsa, respectively [33].
Structure calculations
The NOESY cross-peaks were assigned and integrated
using the program xeasy ⁄ cara [34,35]. The NMR struc-
ture was calculated using the program cyana [33], starting
from 200 random conformers that were annealed in 40 000
steps using torsion-angle dynamics. The 20 conformers with
the lowest residual restraint violations were energy minim-
ized in a shell of water using the program opal with stand-
ard parameters [36]. The Ramachandran plot was analyzed
using procheck-nmr [37].
Secondary structure elements and rmsd values were cal-
culated using the program molmol [38]. Side chain solvent
accessibilities were measured with a spherical probe of
1.4 A
˚
radius and calculated as percentage of the accessibili-
ties measured for a fully extended side chain of residue X
in a helical Gly-X-Gly peptide [39]. The values obtained
were averaged over the 20 NMR conformers.
The rotational correlation time was predicted from
atomic coordinates using the program hydronmr with the
atomic element radius set to 3.3 A
˚
[18]. The program mol-
mol [38] was used to prepare Figs 3 and 4.
Acknowledgements
This work was supported by the Australian Research
Council by means of project grants to GO and NED,
a Federation Fellowship to GO, and a grant for pur-
chase of the 800 MHz NMR spectrometer.
References
1 Kornberg A & Baker TA (1991) DNA Replication , 2nd
edn. Freeman, New York, NY.
2 Mitkova AV, Khopde SM & Biswas SB (2003) Mechan-
ism and stoichiometry of interaction of DnaG primase
with DnaB helicase of Escherichia coli in RNA primer
synthesis. J Biol Chem 278, 52253–52261.
3 Thirlway J, Turner IJ, Gibson CT, Gardiner L, Brady
K, Allen S, Roberts CJ & Soultanas P (2004) DnaG
interacts with a linker region that joins the N- and C-
domains of DnaB and induces the formation of 3-fold
symmetric rings. Nucleic Acids Res 32, 2977–2986.
4 Oakley AJ, Loscha KV, Schaeffer PM, Liepinsh E,
Pintacuda G, Wilce MCJ, Otting G & Dixon NE (2005)
Crystal and solution structures of the helicase-binding
domain of Escherichia coli primase. J Biol Chem 280,
11495–11504.
5 Frick DN & Richardson CC (2001) DNA primases.
Annu Rev Biochem 70, 39–80.
6 Pan H & Wigley DB (2000) Structure of the zinc-bind-
ing domain of Bacillus stearothermophilus DNA pri-
mase. Structure 8, 231–239.
7 Keck JL, Roche DD, Lynch AS & Berger JM (2000)
Structure of the RNA polymerase domain of E. coli pri-
mase. Science 287, 2482–2486.
8 Podobnik M, McInerney P, O’Donnell M & Kuriyan J
(2000) A TOPRIM domain in the crystal structure of
the catalytic core of Escherichia coli primase confirms a
structural link to DNA topoisomerases. J Mol Biol 300,
353–362.
9 Corn JE, Pease PJ, Hura GL & Berger JM (2005)
Crosstalk between primase subunits can act to regulate
primer synthesis in trans. Mol Cell 20, 391–401.
10 Syson K, Thirlway J, Hounslow A, Soultanas P &
Waltho JP (2005) Solution structure of the helicase
interaction domain of the primase DnaG: a model for
helicase activation. Structure 13, 609–616.
11 Tougu K & Marians KJ (1996) The interaction between
helicase and primase sets the replication fork clock.
J Biol Chem 271, 21398–21405.
12 Weigelt J, Brown SE, Miles CS, Dixon NE & Otting G
(1999) NMR structure of the N-terminal domain of
E. coli DnaB helicase: implications for structure rearran-
gements in the helicase hexamer and its biological func-
tion. Structure 7, 681–690.
13 Fass D, Bogden CE & Berger JM (1999) Crystal struc-
ture of the N-terminal domain of the DnaB hexameric
helicase. Structure 7, 691–698.
14 Nakayama N, Arai N, Kaziro Y & Arai K (1984)
Structural and functional studies of the dnaB protein
using limited proteolysis. Characterization of domains
for DNA-dependent ATP hydrolysis and for protein
association in the primosome. J Biol Chem 259, 88–96.
15 Stordal L & Maurer R (1996) Defect in general priming
conferred by linker region mutants of Escherichia coli
DnaB. J Bacteriol 178, 4620–4627.
16 Thirlway J & Soultanas P (2006) In the Bacillus stear-
othermophilus
DnaB–DnaG complex, the activities of
the two proteins are modulated by distinct but overlap-
ping networks of residues. J Bacteriol 188, 1534–1539.
17 Loscha K, Oakley AJ, Bancia B, Schaeffer PM,
Prosselkov P, Otting G, Wilce MCJ & Dixon NE
(2004) Expression, purification, crystallization, and
NMR studies of the helicase interaction domain of
Escherichia coli DnaG primase. Protein Expr Purif 33,
304–310.
X C. Su et al. Solution structure of E. coli DnaG-C
FEBS Journal 273 (2006) 4997–5009 ª 2006 The Authors Journal compilation ª 2006 FEBS 5007
18 Garcia de la Torre J, Huertas ML & Carrasco B
(2000) HYDRONMR: prediction of NMR relaxation
of globular proteins from atomic-level structures and
hydrodynamic calculations. J Magn Reson 147, 138–
146.
19 Shindyalov IN & Bourne PE (1998) Protein structure
alignment by incremental combinatorial extension (CE)
of the optimal path. Protein Eng 11, 739–747.
20 Pintacuda G & Otting G (2002) Identification of protein
surfaces by NMR measurements with a paramagnetic
Gd(III) chelate. J Am Chem Soc 124, 372–373.
21 Miles CS, Weigelt J, Stamford NPJ, Dammerova N,
Otting G & Dixon NE (1997) Precise limits of the
N-terminal domain of DnaB helicase determined by
NMR spectroscopy. Biochem Biophys Res Commun 231,
126–130.
22 Chang P & Marians KJ (2000) Identification of a region
of Escherichia coli DnaB required for functional interac-
tion with DnaG at the replication fork. J Biol Chem
275, 26187–26195.
23 Williams NK, Prosselkov P, Liepinsh E, Line I, Sharipo
A, Littler DR, Curmi PMG, Otting G & Dixon NE
(2002) In vivo protein cyclization promoted by a circu-
larly permuted Synechocystis sp. PCC6803 DnaB mini-
intein. J Biol Chem 277, 7790–7798.
24 Williams NK, Liepinsh E, Watt SJ, Prosselkov P,
Matthews JM, Attard P, Beck JL, Dixon NE &
Otting G (2005) Stabilization of native protein fold by
intein-mediated covalent cyclization. J Mol Biol 346,
1095–1108.
25 Bird LE, Pan H, Soultanas P & Wigley DB (2000) Map-
ping protein–protein interactions within a stable com-
plex of DNA primase and DnaB helicase from Bacillus
stearothermophilus. Biochemistry 39, 171–182.
26 Lu YB, Ratnakar PVAL, Mohanty BK & Bastia D
(1996) Direct physical interaction between DnaG pri-
mase and DnaB helicase of Escherichia coli is necessary
for optimal synthesis of primer RNA. Proc Natl Acad
Sci USA 93, 12902–12907.
27 San Martin MC, Stamford NPJ, Dammerova N, Dixon
NE & Carazo JM (1995) A structural model for the
Escherichia coli DnaB helicase based on electron micro-
scopy data. J Struct Biol 114, 167–176.
28 Neylon C, Brown SE, Kralicek AV, Miles CS, Love CA
& Dixon NE (2000) Interaction of the Escherichia coli
replication terminator protein (Tus) with DNA: a model
derived from DNA-binding studies of mutant proteins by
surface plasmon resonance. Biochemistry 39, 11989–
11999.
29 Ponstingl H & Otting G (1998) Rapid measurement
of scalar three-bond
1
H
N
–
1
H
a
spin coupling con-
stants in
15
N-labelled proteins. J Biomol NMR 12,
319–324.
30 Farrow NA, Muhandiram R, Singer AU, Pascal SM,
Kay CM, Gish G, Shoelson SE, Pawson T,
Forman-Kay JD & Kay LE (1994) Backbone dynamics
of a free and phosphopeptide-complexed Src homology
2 domain studied by
15
N NMR relaxation. Biochemistry
33, 5984–6003.
31 Palmer AG, Rance M & Wright PE (1991) Intramolecu-
lar motions of a zinc finger DNA-binding domain from
Xfin characterized by proton-detected natural abun-
dance carbon-13 heteronuclear NMR spectroscopy.
J Am Chem Soc 113, 4371–4380.
32 Cornilescu G, Delaglio F & Bax A (1999) Protein back-
bone angle restraints from searching a database for che-
mical shift and sequence homology. J Biomol NMR 13,
289–302.
33 Gu
¨
ntert P, Mumenthaler C & Wu
¨
thrich K (1997)
Torsion angle dynamics for NMR structure calcula-
tion with the new program DYANA. J Mol Biol 273,
283–298.
34 Bartels C, Xia TH, Billeter M, Gu
¨
ntert P & Wu
¨
thrich
K (1995) The program XEASY for computer-supported
NMR spectral analysis of biological macromolecules.
J Biomol NMR 6 , 1–10.
35 Keller R (2004) Computer aided resonance assignment
tutorial. Dissertation no. 15947 ETH-Zurich, Switzerland.
36 Luginbu
¨
hl P, Gu
¨
ntert P, Billeter M & Wu
¨
thrich K
(1996) The new program OPAL for molecular dynamics
simulations and energy refinements of biological macro-
molecules. J Biomol NMR 8, 136–146.
37 Laskowski RA, Rullmann JAC, MacArthur MW,
Kaptein R & Thornton JM (1996) AQUA and PRO-
CHECK-NMR: programs for checking the quality of
protein structures solved by NMR. J Biomol NMR 8,
477–486.
38 Koradi R, Billeter M & Wu
¨
thrich K (1996) MOLMOL:
a program for display and analysis of macromolecular
structures. J Mol Graph 14, 51–55.
39 Sevilla-Sierra P, Otting G & Wu
¨
thrich K (1994) Deter-
mination of the nuclear magnetic resonance structure
of the DNA-binding domain of the P22 c2 repressor
(1–76) in solution and comparison with the DNA-bind-
ing domain of the 434 repressor. J Mol Biol 235,
1003–1020.
40 Goddard TD & Kneller DG (2004) SPARKY 3. Univer-
sity of California, San Francisco, CA.
41 Altschul SF, Gish W, Miller W, Meyers EW & Lipman
DJ (1990) Basic local alignment search tool. J Mol Biol
215, 403–410.
Supplementary material
The following supplementary material is available
online:
Fig. S1. Ultracentrifugation data for DnaG-C.
Fig. S2.
15
N-HSQC spectra DnaG-C recorded at pH
8.0, 6.1 and 4.6.
Solution structure of E. coli DnaG-C X C. Su et al.
5008 FEBS Journal 273 (2006) 4997–5009 ª 2006 The Authors Journal compilation ª 2006 FEBS
Fig. S3. Comparison of
15
N-relaxation data for
DnaG-C at pH 6.1 and ratios of
15
N-HSQC cross-
peak heights at pH 4.6 and 6.1.
Fig. S4. Comparison of
15
N-relaxation data for
DnaG-C at pH 8.1, 6.1 and 4.6.
Fig. S5.
15
N-HSQC spectra of DnaG-C recorded with
and without residues 1–171 of E. coli DnaB helicase
[DnaB(1–171)].
This material is available as part of the online article
from
X C. Su et al. Solution structure of E. coli DnaG-C
FEBS Journal 273 (2006) 4997–5009 ª 2006 The Authors Journal compilation ª 2006 FEBS 5009