Báo cáo khoa học: Biochemical characterization of the major sorghum grain peroxidase pptx
Bạn đang xem bản rút gọn của tài liệu. Xem và tải ngay bản đầy đủ của tài liệu tại đây (806.9 KB, 15 trang )
Biochemical characterization of the major sorghum grain
peroxidase
Mamoudou H. Dicko
1,2,3
, Harry Gruppen
2
, Riet Hilhorst
1,
*, Alphons G. J. Voragen
2
and Willem J. H. van Berkel
1
1 Laboratory of Biochemistry, Department of Agrotechnology and Food Sciences, Wageningen University, The Netherlands
2 Laboratory of Food Chemistry, Department of Agrotechnology and Food Sciences, Wageningen University, The Netherlands
3 Laboratoire de Biochimie, CRSBAN, UFR-SVT, Universite
´
de Ouagadougou, Burkina Faso
Keywords
glycoform; hemeprotein; isoenzyme;
peroxidase; sorghum
Correspondence
M. H. Dicko, Laboratoire de Biochimie,
CRSBAN, UFR-SVT, Universite de
Ouagadougou, 03 BP. 7021,
Ouagadougou 03, Burkina Faso
Fax: +226 50337373
Tel: +226 70272643
E-mail:
W. J. H. van Berkel, Laboratory of
Biochemistry, Department of
Agrotechnology and Food Sciences,
Wageningen University, PO Box 8128,
6700 ET Wageningen, The Netherlands
Fax: +31 317484801
Tel: +31 317482861
E-mail:
*Present address
PamGene, PO Box 1345, 5200
BJ’s-Hertogenbosch, The Netherlands
Database
Sequence data for sorghum peroxidase
described here has been submitted to the
UnitProt knowledgebase under the
accession number P84516
(Received 2 February 2006, revised 18
March 2006, accepted 22 March 2006)
doi:10.1111/j.1742-4658.2006.05243.x
The major cationic peroxidase in sorghum grain (SPC4) , which is ubiqui-
tously present in all sorghum varieties was purified to apparent homogen-
eity, and found to be a highly basic protein (pI $ 11). MS analysis showed
that SPC4 consists of two glycoforms with molecular masses of 34227 and
35629 Da and it contains a type-b heme. Chemical deglycosylation allowed
to estimate sugar contents of 3.0% and 6.7% (w ⁄ w) in glycoform I and II,
respectively, and a mass of the apoprotein of 33 246 Da. High performance
anion exchange chromatography allowed to determine the carbohydrate
constituents of the polysaccharide chains. The N-terminal sequence of
SPC4 is not blocked by pyroglutamate. MS analysis showed that six pep-
tides, including the N-terminal sequence of SPC4 matched with the predic-
ted tryptic peptides of gene indice TC102191 of sorghum chromosome 1,
indicating that TC102191 codes for the N-terminal part of the sequence of
SPC4, including a signal peptide of 31 amino acids. The N-terminal frag-
ment of SPC4 (213 amino acids) has a high sequence identity with barley
BP1 (85%), rice Prx23 (90%), wheat WSP1 (82%) and maize peroxidase
(58%), indicative for a common ancestor. SPC4 is activated by calcium
ions. Ca
2+
binding increased the protein conformational stability by rais-
ing the melting temperature (T
m
) from 67 to 82 °C. SPC4 catalyzed the
oxidation of a wide range of aromatic substrates, being catalytically more
efficient with hydroxycinnamates than with tyrosine derivatives. In spite of
the conserved active sites, SPC4 differs from BP1 in being active with aro-
matic compounds above pH 5.
Abbreviations
ABTS, 2,2¢-azinobis(3-ethylbenzo-6-thiazolinesulfonic acid); BP1, barley peroxidase isoenzyme-1; HPAEC, high performance anion exchange
chromatography; HRP C, horseradish peroxidase isoenzyme C; GlcNAc, N-acetyl-glucosamine; SPC4, major sorghum cationic peroxidase;
TFMS, trifluoromethanesulfonic acid.
FEBS Journal 273 (2006) 2293–2307 ª 2006 The Authors Journal compilation ª 2006 FEBS 2293
Plant secretory peroxidases (donor: hydrogen peroxide
oxidoreductase, EC 1.11.1.7) are class III peroxidases
that contain a Fe
III
–protoporphyrin-IX as the pros-
thetic group linked to a proximal His residue. They
catalyze the conversion of a large number of sub-
strates, notably phenolic compounds for biosynthetic
and catabolic functions. In general, they use hydrogen
peroxide as electron acceptor [1]. Multigene families of
peroxidases exist, and in the genomes of rice (Oryza
sativa) and thale cress (Arabidopsis thaliania) up to 138
and 73 of peroxidase genes, respectively, were discov-
ered [2,3]. Moreover, the ongoing project of sorghum
genome sequencing has allowed us to currently iden-
tify 160 stretches of sorghum peroxidase genes (http://
peroxidase.isb-sib.ch/index.php). The physiological
functions of peroxidases are associated with defense
mechanisms, auxin metabolism and the biosynthesis of
cell-wall polymers such as lignin and suberin [1,4,5].
Most peroxidases are glycoproteins occurring in dif-
ferent glycoforms, which may contain different glycan
chains [4]. For instance, barley peroxidase (BP1) con-
sists of two forms; one glycosylated at Asn300 (BP1a)
and the other (BP1b) nonglycosylated [6,7]. The major
glycan chain in BP1a represents 70% of the total carbo-
hydrate content and has as structure Mana1–6(Xylb1–
2)Manb1–4GlcNAcb1–4(Fuca1–3)GlcNAc [6]. Next to
iron, Ca
2+
is an important metal cofactor of heme per-
oxidases. Class III peroxidases are known to contain
two distinct Ca
2+
-binding sites, one localized on the
proximal side and the other on the distal side of the
heme. Ca
2+
both modulates the enzyme activity and
stability [8].
Cereal peroxidases hitherto characterized are from
barley [6], wheat [9], rice [10], and maize [11]. All these
enzymes are monomers with molecular masses ranging
from 35 to 40 kDa. The crystal structure of BP1, with
two helical domains and four disulfide bridges (C18-
C99, C51-C56, C106-C301 and C186-C213) is highly
similar to the structure of the archetypical horseradish
peroxidase (HRP C). Although BP1 shares structural
similarities and catalytic properties with HRP C, its
behavior is atypical, as it is unable to form compound
I at pH values greater than 5 [7].
Relatively little is known about the structure and
properties of sorghum peroxidase [Sorghum bicolor (L)
Moench]. Sorghum is the fifth most important cereal
crop in the world after wheat, rice, maize, and barley.
Properties of a crude sorghum peroxidase preparation
such as pI (9–10) and molecular mass (43 kDa) have
been reported [12]. However, until now no sorghum
grain peroxidase has been purified to homogeneity and
characterized. When screening for peroxidase activity
in the seeds of 50 sorghum varieties originating from
different parts of the world, the cationic peroxidase was
ubiquitously present in all varieties [13,14]. It was also
the most abundant isoenzyme in both ungerminated and
germinated sorghum grains [14]. In other cereals, the
cationic isoenzymes are also the most abundant enzymes
and account for more than 80% of total activity [6,15].
In recent years, it has been shown that cationic per-
oxidases are more active with phenolic compounds than
anionic peroxidases and laccases [16]. Thus, cationic
peroxidases may be of interest for biocatalytic applica-
tions such as the production of useful polymers, the
treatment of waste water streams polluted with toxic
aromatic compounds, and various other clinical and
biotechnological applications [17]. Cationic peroxidases
may also find interest in food biotechnology by modifi-
cation of functional properties of food proteins and
carbohydrates [18,19]. The other reason to characterize
the peroxidase from sorghum is the fact that during
food preparation, the peroxidase present could have a
large effect on the properties of the prepared foods
(beer, porridge, couscous, etc.) [14,18,19]. The resulting
oxidation products have effects on human health.
Therefore, knowledge of biochemical properties of the
major peroxidase can help on sorghum processing.
In this study, we have purified and characterized the
cationic peroxidase isoenzyme from sorghum grain.
Results and discussion
Purification of major peroxidase from sorghum
seed
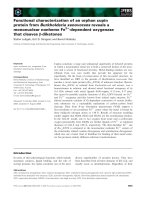
At least four sorghum peroxidase cationic isoenzymes,
denoted SPC1, SPC2, SPC3 and SPC4, according to
their order of elution, could be distinguished and separ-
ated by the Mono-S cation exchange chromatographic
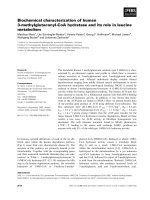
step (Fig. 1A). SPC4 was by far the most abundant iso-
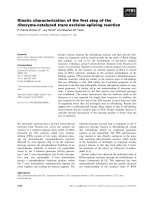
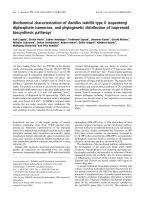
enzyme. Zymography (Fig. 2A) showed that this
enzyme has an experimental pI value > 9. Three inde-
pendent repetitions of all purification steps were per-
formed to confirm the profile and abundance of
isoenzymes within sorghum grain. The purification by
three chromatographic steps resulted in a final enrich-
ment of SPC4 by 105-fold, with an activity yield of 28%
(Table 1). The purity of SPC4 was assessed by the single
protein band obtained by SDS ⁄ PAGE (Fig. 2B) and the
high RZ value (4.0). The purification of SPC4 is sum-
marized in Table 1. The final specific activity of SPC4
for the H
2
O
2
-dependent oxidation of ABTS was
1071 UÆmg
)1
. The purified enzyme was soluble in aque-
ous acetone, methanol and ethanol up to proportions of
40% (v ⁄ v) of organic solvent. The enzyme eluted from a
Superdex G 75 column in one symmetrical peak with an
Characterization of sorghum peroxidase M. H. Dicko et al.
2294 FEBS Journal 273 (2006) 2293–2307 ª 2006 The Authors Journal compilation ª 2006 FEBS
apparent mass of 32 kDa (Fig. 1B). Together with the
molecular masses obtained by SDS ⁄ PAGE (38 kDa,
Fig. 2B) and MALDI-TOF-MS (34283–35631 Da,
Fig. 3A), this shows that SPC4 is a monomer.
Carbohydrate composition
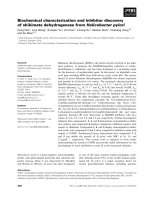
MALDI-TOF-MS analysis revealed that SPC4 consists
of two species with masses of 34 283 and 35 631 Da,
respectively (Fig. 3A). Chemical deglycosylation of the
enzyme yielded a single protein peak with a mass of
33 449 Da (Fig. 3B). This indicates that the hetero-
geneity of the enzyme is exclusively related to its glycan
composition and that SPC4 has two glycoforms. For
convenience, the species with a mass of 34 283 Da is
further referred to as glycoform I and the species with a
mass of 35 631 Da as glycoform II. The chemical
deglycosylation was not complete because it leaves one
unit of GlcNAc (203 Da) remaining on the polypeptide
chain at each attachment site [20]. Thus, the molecular
mass of fully deglycosylated SPC4 is at most 33 246 Da.
The sugar contents estimated by MALDI-TOF-MS are
3.0% and 6.7% in glycoform I and II, respectively.
Carbohydrate analysis of SPC4 by HPAEC showed
an average carbohydrate content of approximately
5.4% (Table 2). From the overall sugar content
(HPAEC) and the estimated sugar contents of the indi-
vidual glycoforms (MALDI-TOF-MS), the proportions
of glycoforms I and II can be calculated to be 35 and
65%, respectively. HPAEC analysis showed that the
main sugar constituents of the glycan chains are fucose,
mannose, xylose, and N-acetylglucosamine (Table 2).
MALDI-TOF-MS analysis of HRP C as positive
control showed masses of the native and deglycosylat-
ed form of 43 663 Da and 35 505 Da, respectively
(Fig. 3C,D). Since HRP C has eight glycan chains [21],
at least 8 GlcNAc residues will remain after chemical
deglycosylation. Thus, the fully deglycosylated HRP C
Fig. 1. Purification of cationic isoforms of sorghum peroxidase. (A)
Mono-S cation exchange chromatography: peroxidase activity (o),
absorbance at 280 nm (—), absorbance at 403 nm (- - -), and 0–1
M
NaCl gradient (—). (B) Elution profile of Mono S purified SPC4 on
Superdex 75 PG.
Fig. 2. Zymogram and SDS ⁄ PAGE of major
cationic sorghum peroxidase. (A) Zymogra-
phy: lane 1, crude extract and lane 2, purif-
ied SPC4. (B) SDS ⁄ PAGE of purification
steps of SPC4: lane M, marker proteins;
lane 1, crude extract; lane 2, acetone precip-
itate; lane 3, preparative Superdex 75 frac-
tion; lane 4, unbound Resource-Q fraction;
lane 5, Mono-S fraction; lane 6, analytical
Superdex 75 fraction.
Table 1. Purification of the major sorghum peroxidase.
Step
Total
activity
(U)
Total
protein
(mg)
Specific
activity
(UÆmg
)1
)
Yield
(%)
Crude extract 10 710 1050 10 100
Acetone fraction 7497 407 18 70
Superdex 75 5890 200 29 55
Resource-Q 4820 12.7 379 45
Mono-S 2998 2.8 1071 28
M. H. Dicko et al. Characterization of sorghum peroxidase
FEBS Journal 273 (2006) 2293–2307 ª 2006 The Authors Journal compilation ª 2006 FEBS 2295
would have a mass of 33 881 Da (35 505–203 · 8 Da),
which is in good agreement with data obtained by
electrospray ionization mass spectrometry [22], and
also with the calculated mass based on the primary
structure (Table 2). The mass of the sugar moiety in
HRP C is therefore 9782 Da, corresponding to 22.4%
(w ⁄ w). HPAEC analysis of the HRP C sugar composi-
tion revealed a carbohydrate content of 22.1% (w ⁄ w).
The comparison of sugar composition between SPC4
and HRP C is illustrated in Table 2. The sugar content
of SPC4 is much lower than that observed with HRP
C as well as from other cationic peroxidases except for
BP1, which also has a low sugar content (Table 3).
Spectral properties
The UV-visible spectrum of native SPC4 (Fig. 4A) is
interpreted in terms of the spin and coordination state
Fig. 3. MALDI-TOF-MS analysis of native and deglycosylated forms of SPC4 and HRP C. (A) Native SPC4, (B) deglycosylated SPC4,
(C) native HRP C, and (D) deglycosylated HRP C.
Table 2. Molecular mass and sugar composition of SPC4 and HRP.
Mass of intact
protein (Da)
Mass of carbohydrate
moiety (Da)
Proportion of
carbohydrate (%, w ⁄ w)
Number of residues (mol ⁄ mol)
determined by HPAEC
MS
a
MS HPAEC
b
MS HPAEC Fucose Mannose Xylose NGlc
SPC4
c
I: 35631 I:1037 1903 I: 3.0 5.4 1.4 5.6 1.7 2.7
II: 34283 II: 2385 II: 6.7
HRP
d
(present study)
43663 9782 9689 22.4 22.1 9.5 26.8 8.0 14.2
HRP
e
42200–44000 ⁄⁄22–27 ⁄ 824 816
a
MS, mass spectrometry analysis of the two glycoforms I and II;
b
HPAEC, high performance anion exchange chromatography analysis of
both glycoforms;
c
SPC4, sorghum cationic peroxidase (the average molecular mass and sugar composition of the two glycoforms was con-
sidered).
d
Horseradish peroxidase according to the present study.
e
Horseradish peroxidase according to theoretical prediction [21].
Characterization of sorghum peroxidase M. H. Dicko et al.
2296 FEBS Journal 273 (2006) 2293–2307 ª 2006 The Authors Journal compilation ª 2006 FEBS
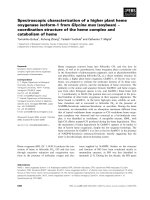
of the resting enzyme. The absorption spectrum of
native SPC4 showed characteristics typical of high-spin
iron(III) heme proteins, with a maximum in the Soret
region at 403 nm and a b-band at 497 nm [23]
(Fig. 4A). There is also a charge-transfer band (por-
phyrin to iron) [1] in the spectrum between 630 and
640 nm. Moreover, with the spectrum of the extracted
heme, a Q
0v
band (vibrational transition of the iron p
electrons) [1] at 532 nm and a porphyrin to iron charge
transfer band at 637 nm were clearly observed. The
Q
0v
band at 532 nm was not visible in the native per-
oxidase because it is obscured by b-band and charge
transfer bands [1]. These spectral properties are charac-
teristic for an iron(III)-containing protoporphyrin-IX.
The molar absorption coefficient of SPC4 at 403 nm
was determined to be approximately 104 mm
)1
Æcm
)1
.
Figure 4(B) shows the mass spectral analysis of the
extracted heme cofactor of SPC4. The mass of 616 Da
corresponds to the mass of iron(III)–protoporphyrin-
IX, confirming that SPC4 contains a type-b heme. The
peak with a mass of 563 Da is ascribed to the partial
loss of iron by the protoporphyrin-IX. The MALDI-
TOF-MS spectrum (Fig. 4B) also shows an intense
peak with a mass of 650, which is assigned to a
heme-H
2
O
2
adduct. Thus, SPC4 is a type-b heme-con-
taining peroxidase, which shares similar molecular
properties with cereal peroxidases [1,6,15].
Far UV-circular dichroism spectroscopy indicated
that SPC4 contains 42 ± 6% a-helix, 35 ± 7%
b-sheet and 24 ± 7% b-turns (not shown). These val-
ues should be taken with caution as in peroxidase
structures predicted from CD spectra the a-helix con-
tent can be underestimated. Nevertheless, this secon-
dary structure content is similar to that of other plant
peroxidases [24].
Amino acid composition and N-terminal
sequence analysis
The amino acid composition of SPC4 together with
those of other cationic peroxidases is given in Table 3.
The average amino acid calculated mass of cationic
peroxidases is 106.7 Da (Table 3), allowing estimation
of 311 amino acid residues in SPC4. From this amino
acid composition, a theoretical pI value of 11 was cal-
culated, assuming that all eight cysteines are involved
in disulfide bridges [1,7,25,26]. The low ratio
(Asx + Glx) ⁄ (Arg + Lys) of SPC4 and its pI value
Table 3. Amino acid composition of SPC4 and other cationic plant peroxidases.
Amino acid SPC4
a
RP
b
WP
c
BP1
d
CC
e
HRPC
f
PNC21
g
SB1
h
TP7
i
Ala 31(10.0)5039223723 27 29 32
Arg 23 (7.4) 15 12 30 21 21 19 22 17
Asp+Asn 35(11.1)3238343148 35 35 39
Cys 8(2.5)89898 8 9 8
Glu + Gln 12 (3.9) 13 15 26 21 20 22 27 14
Gly 29 (9.3) 22 24 25 26 17 28 26 24
His 5(1.6)54453 5 4 3
Ile 8 (2.6) 14 11 11 13 13 13 12 15
Leu 29 (9.4) 32 31 30 28 35 25 30 21
Lys 14 (4.5) 7 10 6 4 6 12 8 10
Met 3(1.0)78284 3 6 6
Phe 16 (5.2) 11 12 17 13 20 18 17 14
Pro 15 (4.8) 12 10 21 17 17 11 15 11
Ser 27 (8.7) 36 37 26 31 25 29 30 42
Thr 25 (8.1) 26 27 16 19 25 22 16 16
Trp 2(0.6)11111 2 2 1
Tyr 6(1.9)64465 4 9 4
Val 23 (7.4) 17 20 26 17 17 24 25 19
(Asx + Glx) ⁄ (Arg + Lys) 1.27 2.05 2.41 1.67 2.08 2.52 1.84 2.07 1.96
Sum 311 (100) 314 312 309 307 308 307 322 296
Apoprotein MW
j
33 226 32 437 32 382 33 825 32 508 33 918 32 954 35 029 31 086
Carbohydrate proportion 3–6% ⁄
k
⁄ 0–3% ⁄ 22–27% 12–19% ⁄ 7%
Accession code
l
P84516 O22440 Q05855 Q40069 Q43416 P00433 P22196 Q9SSZ9 POO434
a
Results of SPC4 are presented in number of amino acid ⁄ protein and in mole percentage (mol ⁄ mol) in brackets.
b
Rice [10],
c
wheat [9],
d
bar-
ley [6],
e
Cenchrus ciliaris [53],
f
horseradish [25],
g
peanut [54],
h
Scutellaria baicalensis [55],
i
turnip [56].
j
Calculated molecular weights using
software to compute pI ⁄ MW ⁄ titration curve, available at ⁄
k
, sugar composition not given.
l
UniProtKB ⁄
TrEMBL accession number.
M. H. Dicko et al. Characterization of sorghum peroxidase
FEBS Journal 273 (2006) 2293–2307 ª 2006 The Authors Journal compilation ª 2006 FEBS 2297
indicate that in comparison to other cationic peroxid-
ases, SCP4 is highly basic (Table 3).
Like BP1 [6], the N-terminal sequence of SPC4 is
not blocked by pyroglutamate, in contrast to most
other peroxidases [25]. The first 20 amino acid residues
are shown in Fig. 5. A TBLASTN search at the Gram-
ene website () indicated that
the SPC4 gene is localized in the sorghum chromosome
1. At the Institute for Genomic Research (http://
www.tigr.org), the best match with 100% identity was
found with gene indice TC102191 (213 amino acids).
MALDI-TOF-MS analysis (Fig. 6) showed that six
peptides, including the N-terminal sequence of SPC4
matched with the predicted tryptic peptides of
TC102191, indicating that TC102191 codes for the
N-terminal part of the sequence of SPC4. SPC4 has a
signal peptide of 31 amino acids (Fig. 5). Since the
expected full length of SPC4 is about 311 amino acid
residues, the C-terminal sequence of about 129 amino
acids is unknown. Among the currently 160 stretches
of sorghum peroxidase genes that are identified (http://
peroxidase.isb-sib.ch/index.php), SPC4 corresponds to
SbPrx50. With the currently ongoing sorghum genome
project (), the full seq-
uence of this gene will be available soon.
The sequence of the N-terminal part of SPC4 was
analyzed by searching for domain database (RPS-
BLAST at NCBI: />protein families database (Pfam9Sanger Institute:
and for speci-
fic protein motifs, domains and families (InterProScan
at EBI: The RPS-
BLAST and Pfam searches indicated with expect val-
ues of 4e-59 and 1.1e-50, respectively, that SPC4
belongs to the Class III of plant secretory peroxidases
like HRP C. Furthermore, the InterProScan software,
which integrates several tools for the analysis of
domain and family of proteins, clearly showed that
SPC4 contains all the fundamental motifs characteris-
tic of Class III plant peroxidases. The TBLASTN
search against the nonredundant database at NCBI
( indicated that
SPC4 is most closely related to cereal peroxidases
(Fig. 5). Because the N-terminal sequences of the
mature peroxidases from rice, wheat and maize are as
yet unknown, the alignment of sequences in Fig. 5 is
made by including the signal peptides of peroxidases
(precursors). The N-terminal fragment of SPC4 has a
high sequence identity with barley BP1 (85%), rice
Prx23 (90%), wheat WSP1 (82%), and maize (58%),
indicative for a common ancestor [27].
SPC4 consists of two domains and has an N-ter-
minal extension of one and eight residues, compared
to BP1 [6] and HRP C [25], respectively. The key cata-
lytic residues (Arg46, Phe49, His50, Asn78, Pro150
and His180) and cysteines involved in intramolecular
disulfide bridges (Cys19-Cys100; Cys52-Cys57; Cys107)
are all conserved (Fig. 5). The structural motif -P-X-P-
is found at sequence positions 150–152. This region is
involved in the substrate binding of plant peroxidases
[26]. In particular, Pro150, which is completely con-
served in the plant peroxidase superfamily (class III),
is crucially involved in substrate binding and oxidation
[7,26]. Another important residue of SPC4 concerns
Thr68, which is equivalent to Thr67 of BP1. This resi-
due is conserved in most cereal peroxidases (Fig. 5),
but not in HRP C. Structural studies have shown that
the distal heme pocket of BP1 is significantly different
to that of other plant peroxidases. In BP1, at pH
above 5, the distal His makes a hydrogen bond with
Thr67 and not with the distal Asn70 as in HRP C. As
a result, the orientation of the distal His residue is
altered and located too far from the heme iron atom
to be able to catalyze the formation of compound I. In
Fig. 4. Heme analysis of SPC4. (A) Spectral properties of SPC4.
The absorption spectrum of purified SPC4 was recorded in 50 m
M
sodium acetate pH 5. The inset shows the spectrum of the extract-
ed heme. (B) MALDI-TOF-MS analysis of SPC4 heme.
Characterization of sorghum peroxidase M. H. Dicko et al.
2298 FEBS Journal 273 (2006) 2293–2307 ª 2006 The Authors Journal compilation ª 2006 FEBS
addition, Phe48 (equivalent to Ph49 in SPC4) moves
toward the heme iron, and in doing so, the accessibility
of the heme iron is diminished [7]. Given the high
sequence identity with BP1 it may be conceivable that
a similar situation applies in SPC4.
The only putative glycosylation site present in the
sequenced N-terminal fragment of SPC4 is Asn78.
However, Asn78 is an active site residue of class III
peroxidases that is not glycosylated [6]. Thus, as found
for most peroxidases, the glycosylation sites of SPC4
are localized in the C-terminus part of the enzyme.
Catalytic properties
SPC4 was stable between pH 3 and pH 7 for 2 h at
25 °C. The enzyme showed optimal activity with
Fig. 5. Multiple sequence alignment of
major cationic sorghum peroxidase (P84516)
with other cereal peroxidases. The N-term-
inal fragment of SPC4 is aligned with barley
BP1 (Q40069), rice Prx23 (Q94D
M0), wheat
WSP1 (Q8LK23), and maize peroxidase
(O04710). The codes under brackets are
UniProtKB ⁄ TrEMBL entries. The highly con-
served catalytic residues among all class III
peroxidases are marked with asterisks. The
N-terminal sequence of SPC4 obtained by
Edman sequencing is underlined. The signal
peptides of SPC4 and BP1 are shown in the
boxes.
Fig. 6. MALDI-TOF-MS peptide mass fingerprint of SPC4.
M. H. Dicko et al. Characterization of sorghum peroxidase
FEBS Journal 273 (2006) 2293–2307 ª 2006 The Authors Journal compilation ª 2006 FEBS 2299
ABTS, ferulic acid and N-acetyl-l-tyrosine at pH 3.8,
5.5 and 6.5, respectively (Fig. 7). These different pH
optima are in line with reported properties of other
peroxidases [28,29]. For instance the pH optima found
for the activity of lettuce (Lactuca sativa) peroxidase
were 4.5, 6.0, 5.5–6.0, and 6.0–6.5 for the substrates
tetramethylbenzidine, guaiacol, caffeic acid, and chlo-
rogenic acid, respectively [28]. It is known that there is
no correlation between the pH optima of peroxidase
activity and their pI values because both anionic
(pI 3.5) and cationic (pI 8.8) horseradish peroxidases
display for instance the same optimum pH for the oxi-
dation of p-coumaric acid [29]. The substrates oxidized
at low pH (ABTS and ferulic acid) have higher cata-
lytic efficiencies (Table 4) than those oxidized at higher
pH values (N-acetyl-l-tyrosine) maybe because of the
higher oxidation potential of the reaction intermediates
compound I and II at low pH [29]. The difference in
the optimum pH of peroxidase activity between sub-
strates may also reflect the pH-dependence of their
ionization potentials. A pH-dependence of peroxidase
activity as a function of substrate could be explained
by several reasons. A change in pH would affect the
extent to which each functional groups of the amino
acid involved in substrate binding, or catalytic residues
ionizes, and thus the conformation of the peroxidase
molecule. A change in the structural conformation will
obviously affect the shape of the active site, and thus
either increase or decrease the enzyme’s affinity for
substrate molecules [1]. This hypothesis is further sup-
ported by the fact that different amino acids can be
involved for plant peroxidases binding to physiologi-
cally relevant substrates [29]. The pH-dependence of
the contribution from electrostatic repulsion or attrac-
tion during substrate binding and release can also be
considered. The better and maybe faster binding of
electron donors have been suggested to justify the dif-
ference in the oxidation of phenolic substrates by plant
peroxidases [29]. Furthermore, some substrates are
oxidized in a single-electron reaction (ABTS) and oth-
ers in a two-electron reaction (phenolic compounds),
and some products undergo nonenzymatic polymeriza-
tion reactions after peroxidase oxidation of substrates
from which they derived [1]. Such kinetic differences
might alter the overall pH-activity profile.
Nevertheless, SPC4 remarkably differs from BP1
[23] in being active with aromatic compounds above
pH 5. This activity, which is also apparent from the
zymography analysis (Fig. 2A), is intriguing in view of
the structural relationship mentioned above.
Stafford and Brown [30] reported an oxidative
dimerization of ferulic acid by sorghum grain
extracts. Furthermore, using a crude extract from
sorghum variety NK300, a high peroxidase activity
on ferulic acid and no activities on tyrosine and
other phenolics were observed [31]. Here we found
that purified SPC4 has a high preference for
hydroxycinnamates, including ferulic acid and p-cou-
maric acid, which are among the most abundant
phenolic compounds in sorghum [32]. Kinetic studies
performed at pH 5.5 showed that the catalytic effi-
ciency of SPC4 with phenolic compounds decreased
in the following order: ferulic acid > p-coumaric
acid > N-acetyl tyrosine methyl ester > N-acetyl
tyrosine > tyrosine > catechol > G ly-Tyr-Gly (Table 4).
Fig. 7. Dependence of SPC4 activity on pH. The enzyme (10 nM)
was incubated with 10 m
M ABTS (d), 125 lM ferulic acid (s), or
250 l
M N-acetyl tyrosine (m) in the presence of 5 mM H
2
O
2
, in dif-
ferent 50 m
M McIlvaine buffers (pH 2.5–8), at 20 °C. Enzymes
activities were monitored as described in the Experimental proced-
ures. Vertical bars indicate the standard error of each experiment.
Table 4. Substrate specificity
a
of sorghum peroxidase.
Substrate
Substrate
k
max
(nm)
Substrate molar
absorption
coefficient
(mM
)1
Æcm
)1
)
Product
k
max
(nm)
Apparent
V
max
⁄ K
m
(M
)1
Æs
)1
)
ABTS 340 34 414
c
1.16
Ferulic acid 310
b
14.9 348
d
0.92
p-coumaric acid 287
b
19.7 290
e
0.23
Indole-3-acetic
acid
280
b
5.0 261
f
0.08
N-acetyl tyrosine
methyl ester
275 1.4 318
c,d
0.07
N-acetyl tyrosine 275 1.4 293
c,g
0.05
Tyrosine 276 2.8 318
c,d
0.03
catechol 276 2.3 398
c,h
0.01
Gly-Tyr-Gly 275 1.3 318
c,d
0.01
a
The substrates are ranked by order of preference. The reaction
was followed by
b
substrate disappearance or
c
product formation
according to
d
[18],
e
[29],
f
[34],
g
[51], and
h
[52].
Characterization of sorghum peroxidase M. H. Dicko et al.
2300 FEBS Journal 273 (2006) 2293–2307 ª 2006 The Authors Journal compilation ª 2006 FEBS
The relatively high reactivity with hydroxycinnamic
acid derivatives suggests that the enzyme may be
involved in the formation of diferulate linkages in
the plant cell wall. On the other hand, the rather
low catalytic efficiency of SPC4 with tyrosine and
tyrosine-containing peptides suggests that the enzyme
is less involved in protein cross-linking through di-
tyrosine formation.
SPC4 also displayed auxin (3-indole acetic acid)
activity. This activity, which takes place in the absence
of added hydrogen peroxide, is mechanistically differ-
ent for cationic and anionic peroxidases [33] and not a
property of all plant peroxidase isoforms [34]. The
physiological significance of auxin metabolism by plant
peroxidases is still an area of debate. Some peroxidases
regulate the level of auxin either by direct degradation
or by oxidizing endogenous flavonoids, which are
inhibitors of auxin transport [35]. The activity of SPC4
on auxin might be related to the presence of His48
(His40 in HRP C) in the distal domain near the heme,
which is believed to play a role in auxin recognition
based on sequence similarity with auxin binding pro-
teins [33].
The activity of SPC4 was stimulated in the presence
of CaCl
2
. The maximum increase of activity of the
purified enzyme was two-fold with an apparent semi-
maximal activation at 0.7 mm CaCl
2
. A similar, but
somewhat stronger activation, was observed for BP1
for which the calcium binding sites are not fully occu-
pied [23]. The Ca
2+
activation of SPC4 is of interest
because not all peroxidases are activated by Ca
2+
[15].
HRP C for instance contains two structural calcium
ions (proximal and distal) that are also of functional
significance [26]. Binding of Ca
2+
decreased the intrin-
sic tryptophan fluorescence intensity of SPC4. From
the binding curve, a dissociation constant for the
SPC4–Ca
2+
ion complex, K
d
¼ 2.4 ± 0.3 mm, was
determined. The affinity of SPC4 for Ca
2+
was some-
what higher than that of BP1 (K
d
¼ 4mm) [15]. The
calcium status of BP1 is anomalous, with the distal
calcium-binding site substituted by sodium [7]. Based
on the sequence alignments, the distal binding site in
SPC4 is formed by Asp51, Asp58, Ser60 (side chains)
and Asp51, Val54, Gly56 (main chain carbonyls). The
entire sequence of SPC4 is needed to establish the
proximal calcium binding site. The binding of Ca
2+
has been proposed to change the electronic properties
of the heme iron or the topology of the heme vicinity
and might improve substrate binding [7,8,15,23]. With
SPC4, such structural perturbations must be small
because circular dichroism analysis revealed that Ca
2+
binding does not change the secondary structure of the
enzyme (not shown).
Thermal stability
In the absence of added CaCl
2
, SPC4 readily lost
activity when incubated at temperatures above 55 °C
(Fig. 8A). However, in the presence of excess Ca
2+
ions, the enzyme kept its full activity at up to 65 °C
for 90-min incubation (Fig. 8B). Arrhenius plots
(Fig. 8C) of the thermoinactivation data revealed
straight lines and showed that Ca
2+
binding only
slightly increases the activation energy of heat inactiva-
tion of SPC4 from 157 ± 12–170 ± 14 kJÆmol
)1
. The
increased stability of SPC4 in the presence of Ca
2+
ions was confirmed by fluorescence experiments. Upon
Fig. 8. Thermoinactivation of SPC4. The enzyme (270 nM) was
incubated at different temperatures in 50 m
M sodium acetate pH 5,
either in the absence (A) or presence (B) of 5 m
M CaCl
2
:55°C(d),
60 °C(s), 65 °C(m), 70 °C(n), 75 °C(n), 80 °C(h), 85 °C(X);
90 °C(r), 95 °C(e). (C) Arrhenius plot for heat inactivation of
SPC4 in the absence (r) or presence (e) of calcium. Vertical bars
indicate the standard error of each experiment.
M. H. Dicko et al. Characterization of sorghum peroxidase
FEBS Journal 273 (2006) 2293–2307 ª 2006 The Authors Journal compilation ª 2006 FEBS 2301
heating, both in the absence and presence of Ca
2+
ions, a strong increase in protein tryptophan fluores-
cence was observed (Fig. 9A,B). Independent of the
presence of Ca
2+
ions, and treating the data according
to van Mierlo et al. [36], SPC4 followed a simple two-
state mechanism of heat-induced unfolding. This is in
agreement with other plant peroxidases [37].
Thermal unfolding of SPC4 induced not only an
increase of fluorescence intensity but also a bathochro-
mic shift of the fluorescence maximum from 338 to
348 nm (not shown). T
m
values of 67 °C and 82 °C for
the free and calcium-bound form, respectively, were
found. In the absence of Ca
2+
, the melting tempera-
ture of SPC4 was between that of HRP C (T
m
¼
60 °C) and the African palm tree peroxidase (T
m
¼
74 °C) [37]. In the presence of Ca
2+
, the T
m
of SPC4
is near that of soybean peroxidase, which is one of the
most stable plant peroxidases with a T
m
of 90 °Cin
the presence of calcium [38].
In conclusion, the major isoenzyme in sorghum
grain (SPC4) was shown to be a cationic peroxidase
having two glycoforms with unusual basic character
and a high heat stability in the presence of calcium.
The enzyme has relatively low carbohydrate content. It
shares similar molecular properties with other cereal
peroxidases such as barley peroxidase 1 but has dis-
tinct catalytic properties in being active on aromatic
compounds above pH 5. Therefore, the enzyme may
develop as an alternative peroxidase for biochemical
and clinical assays, and biocatalysis.
Experimental procedures
Chemicals
Horseradish peroxidase [HRP, EC 1.11.1.7] (grade II, lot
N°16H9522), p-coumaric acid, ferulic acid, l-tyrosine, tri-
fluoromethanesulfonic acid, and indole-3-acetic acid were
from Sigma-Aldrich (Zwijndrecht, the Netherlands). N-ace-
tyl tyrosine, N-acetyl tyrosine methyl ester and Gly-Tyr-Gly
were from Bachem, Bubendorf, Switzerland. Hydrogen per-
oxide was from Merck (Darmstadt, Germany). Modified
trypsin (EC 3.4.21.4) sequencing grade was from Roche
Diagnostics GmbH (Mannheim, Germany). Electrophoresis
gels (IEF, pH 3–9) were purchased from Amersham Bio-
sciences. SDS ⁄ PAGE gradient gels (10–18%) were from
Biorad (Richmond, CA, USA). Immobilon-P transfer mem-
brane was from Millipore Corporation (Bedford, MA,
USA). Maltodextrin MD05 standards were obtained from
Spreda (Burghof, Switzerland). Low molecular weight
standard proteins were from Amersham Pharmacia Biotech
(Uppsala, Sweden). All other chemicals were of analytical
grade.
Enzyme purification
The grains of sorghum variety [Sorghum bicolor (L)
Moench var. Cauga 108–15] grown in 1998 were used [13].
Peroxidase isoenzymes were extracted from flour as des-
cribed previously [13,14]. Protein precipitation was per-
formed with slow addition of acetone ()30 °C) to the crude
extract, followed by centrifugation (10 000 g, 30 min). The
precipitate obtained between 40 and 80% (v ⁄ v) acetone was
resuspended in the extraction buffer and dialyzed overnight
against 20 mm Bis-Tris-Cl, pH 7.0, containing 1 mm CaCl
2
(starting buffer), at 4 °C. Insoluble material was removed
by centrifugation (15 000 g, 45 min, 4 °C).
Subsequent chromatography steps were performed at
room temperature (20–22 °C). Protein eluates were monit-
ored at wavelengths of 280 and 403 nm. Reinheitszahl (RZ)
values (A
403
⁄ A
280
) were calculated directly from the chro-
matograms [4]. The supernatant (150 mL) obtained after
acetone precipitation and subsequent dialysis was loaded
onto a Superdex 75-PG gel filtration column (65 · 15 cm,
Amersham Pharmacia Biotech, Uppsala, Sweden) equili-
brated with starting buffer. Proteins were eluted at a flow
rate of 25 mLÆmin
)1
. Fractions containing peroxidase
A
B
Fluorescence intensity (AU)Fluorescence intensity (AU)
Fig. 9. Thermal unfolding of SPC4 as followed by intrinsic trypto-
phan fluorescence. The enzyme (2.22 l
M) was heated in 10 mM
sodium acetate pH 5, either in the absence (A) or presence (B) of
5m
M CaCl
2
at a rate of 0.5 °CÆmin
)1
. The excitation wavelength
was 295 nm. The emission at 342 nm was monitored at 0.5-min
intervals. Solid lines are the best fit of the two states unfolding
equation (Eqn 1) [36].
Characterization of sorghum peroxidase M. H. Dicko et al.
2302 FEBS Journal 273 (2006) 2293–2307 ª 2006 The Authors Journal compilation ª 2006 FEBS
activities were pooled and loaded onto a Resource-Q col-
umn (Source
TM
15Q, 1 mL; flow rate 2 mLÆ min
)1
; Amer-
sham Pharmacia Biotech, Uppsala, Sweden) equilibrated
with starting buffer. After washing with 10 mL of starting
buffer, elution was performed with a 10 mL linear gradient
of 0–0.5 m NaCl in starting buffer. Fractions containing
cationic peroxidase isoenzymes were concentrated by ultra-
filtration with a Y10 membrane (Amicon Corporation,
Danvers, MA, USA) and equilibrated in 50 mm sodium
acetate, pH 6.0. The protein sample was applied onto a
Mono-S cation-exchange column (HR 5 ⁄ 5, 5 · 50 mm, flow
rate 1 mLÆmin
)1
; Amersham Pharmacia Biotech, Uppsala,
Sweden), equilibrated in the same buffer. After washing
with 10 mL of equilibration buffer, the peroxidase isoen-
zymes were eluted with a gradient of 0–1 m NaCl in 50 mm
sodium acetate, pH 6.0. The enzyme fractions were pooled
and frozen in liquid nitrogen and stored at )80 °C. To esti-
mate the apparent molecular mass of the enzyme by
molecular sieving, an analytical Superdex 75 column (HR
60 · 16 mm, Amersham Pharmacia Biotech, Uppsala, Swe-
den) was calibrated using blue dextran (2000 kDa), bovine
serum albumin (67 kDa), ovalbumin (43 kDa), chymotryp-
sin A (25 kDa), and ribonuclease A (13.7 kDa). The
column was running in 50 mm sodium acetate pH 5.0, con-
taining 155 mm NaCl. Reference proteins and the purified
peroxidase were loaded (100 lL) and eluted with the same
buffer at 0.5 mLÆmin
)1
.
Primary structure analysis
Total protein was quantified by the linearized method of
Bradford adapted to a microtiter plate [13] using BSA as
standard. Protein concentration of pure enzyme was deter-
mined from the absorbance at the Soret region using a
value of e
403
¼ 104 mm
)1
Æcm
)1
. SDS ⁄ PAGE was performed
with 10–18% gradient gels. SDS ⁄ PAGE gels were calibra-
ted using a low-molecular weight marker kit (Amersham
Pharmacia Biotech, Uppsala, Sweden). Protein bands were
stained with Coomassie Brilliant Blue R250. Isoelectrofo-
cusing and zymography were performed as described previ-
ously [39].
Amino acid composition was performed on a Biochrom
amino acid analyzer (Amersham Pharmacia Biotech, Upp-
sala, Sweden). Proteins were hydrolyzed in conditions
allowing cysteine determination, essentially as described
previously [4]. Protein samples were hydrolyzed in 6 m
HCl, 0.05% (v ⁄ v) phenol, 0.1% 3,3¢-dithiodipropanoic acid
in nitrogen atmosphere, at 110 °C, for 22 h. Tryptophan
content was estimated by a fluorimetric method [40]. Theor-
etical isoelectric point values were estimated using the soft-
ware developed by Bjellqvist et al. [41] available at http://
expasy.ch/tools/#primary.
Prior to N-terminal microsequencing according to auto-
mated Edman degradation, the enzyme was separated by
SDS ⁄ PAGE, using a 10–20% gradient gel and blotted onto
poly(vinylidene difluoride) membrane according to Matsu-
daira [42]. The protein band was excised and N-terminal
amino-acid sequencing of the polypeptide was carried out
on an automated amino acid sequencer Perkin Elmer ⁄
Applied Biosystems model 476 A (Institute for Biomem-
branes Sequence Center, University of Utrecht, Utrecht, the
Netherlands). In order to obtain the full sequence of the
enzyme, the N-terminal sequence was used as input for
TBLASTN searches [43] within different databases.
Sequence alignments of cereal peroxidases were performed
using Clustal W [44] available at the European Bioinfor-
matic Institute ( />Determination of carbohydrate composition
The carbohydrate composition of SPC4 was determined by
hydrolysis in 2 m trifluoroacetic acid at 100 °C for 2 h.
After hydrolysis, the sample was dried, then dissolved in
water, centrifuged (10 000 g, 10 min), and analyzed by high
performance anion exchange chromatography (HPAEC)
[45], using a pulsed amperometric detection detector
(Electrochemical Detector ED40; Dionex, Sunnyvale, CA,
USA).
Chemical deglycosylation of the enzyme was performed
by incubating the enzyme with a mixture of trifluoro-
methane sulfonic acid and anisole [4] for 5 h at room
temperature. Horseradish peroxidase (HRP) was used as
positive control. After deglycosylation, chemicals were
removed by thoroughly washing the proteins with water
using a Centricon-3 device (3 kDa molecular sieve, Milli-
pore Corp, the Netherlands). The deglycosylated protein
samples were kept at )20 °C prior to mass spectrometry
analysis.
Mass spectrometry
MALDI-TOF-MS was performed with a Voyager-DE-RP
Biospectrometry Workstation elite reflectron time of flight
mass spectrometer (PerSeptive Biosystems, Inc., Framing-
ham, Manchester, England) with a delayed extraction
MALDI ion source. Between 100 and 256 scans were aver-
aged for each of the spectra shown. Samples were deposited
in nonwelled gold plates.
The mass of the heme cofactor of sorghum peroxidase
was analyzed by using 3,5-dihydroxybenzoic acid saturated
in methanol ⁄ water (60 ⁄ 40) as matrix. MALDI-TOF-MS
was performed using maltodextrins (MDO5) for calibration
as external standard as described previously [46].
Intact and deglycosylated protein samples (5 lL) were
cleaned up using a ZipTip
C4
reverse phase microcolumn
according to the manufacturer’s instructions (Millipore
Corp, the Netherlands) and mixed (1 : 1, v ⁄ v) with the
MALDI-TOF-MS matrix. The matrix used for intact pro-
tein analysis was a freshly prepared solution of 10 mgÆmL
)1
sinapinic acid (3,5-dimethoxy-4-hydroxycinnamic acid) in
M. H. Dicko et al. Characterization of sorghum peroxidase
FEBS Journal 273 (2006) 2293–2307 ª 2006 The Authors Journal compilation ª 2006 FEBS 2303
aqueous 30% (v ⁄ v) acetonitrile containing 0.1% (v ⁄ v)
trifluoroacetic acid. Intact protein detection was performed
in the linear mode. External calibrations under identical
conditions were performed according to the manufacturer’s
description using bradykinin (1060.56 Da), ACTH-1–17
(2093.08 Da), insulin (5734.59 Da), ribonuclease A
(13682.30 Da), apomyoglobin (16952.56 Da) and b-lacto-
globulin B (18278.20 Da) as standards for the MALDI-
TOF-MS analysis.
In-gel tryptic digestion was performed as described previ-
ously [47]. Prior to MALDI-TOF-MS analysis, the peptide
samples were cleaned using a ZipTipC
18
(Millipore Corp,
the Netherlands) reverse phase microcolumn. A freshly pre-
pared a-cyano-4-hydroxy-trans-cinnamic acid at 20 mgÆmL
)1
in 50% aqueous acetonitrile containing 0.1% (v ⁄ v) trifluoro-
acetic acid was used as a matrix for peptide analysis.
Peptide mass spectra were acquired in the reflector mode
with delayed extraction. The above mentioned external
calibrations for proteins were also used for peptides. MS
database searching and prediction of tryptic cleavage sites
were performed with the MS-fit and MS-digest programs
(version 4.05), respectively ().
Restrictions for database searches were made according to
Kristensen et al. [48].
Spectral properties
Absorption spectra were recorded on a Hewlett-Packard
8453 A diode array spectrophotometer at 25 °C. The heme
cofactor of the enzyme was extracted with butanone adjus-
ted to pH 2.0 with acetic acid. The UV-spectrum of the
heme was recorded in the extraction solution. Fluorescence
emission spectra were recorded on a Varian Cary Eclipse
Fluorescence Spectrophotometer (Bergen op Zoom, the
Netherlands). Ca
2+
binding of the enzyme was studied at
25 °C by monitoring the intrinsic tryptophan fluorescence
of the enzyme (2.2 lm)in10mm sodium acetate pH 5.0 as
a function of CaCl
2
concentration (0–10 mm). The excita-
tion wavelength was 295 nm. The fluorescence titration
data were analyzed [49], assuming a single nonstructural
Ca
2+
binding site.
Far-UV CD spectra of SPC4 (3.9 lm) were recorded in
10 mm sodium acetate pH 5.0, with a Jasco J-715 spectro-
polarimeter (Jasco Corp., Japan) at 20 ° C. A quartz cell
with an optical pathlength of 1 mm was used. The CD
intensity is expressed as molar ellipticity [h], in degÆcmÆ
dmol
)1
. The secondary structure of the enzyme was ana-
lyzed as described by Venyaminor et al. [50]. The effect of
Ca
2+
binding on the protein secondary structure was deter-
mined by recording CD spectra in the presence of increas-
ing concentrations of CaCl
2
(0–10 mm).
Thermal stability
Thermal stability was studied by incubating SPC4 in the
absence or presence of 5 mm CaCl
2
at temperatures ranging
from 40 to 95 °C. Enzyme aliquots (0.27 lm)in50mm
sodium acetate pH 5.0 were heated in a thermocycler PCR
System 9600 (Perkin-Elmer Thermolyne Amplitron II; tem-
perature accuracy ± 0.1 ° C) at indicated temperatures for
the times specified. The time needed for the temperature to
reach equilibrium was less than 15 s. Following heating,
samples were immediately cooled on ice and the residual
enzyme activity was determined under standard assay condi-
tions. For each incubation temperature, control samples
with or without Ca
2+
were analyzed in parallel. The appar-
ent first-order rate constants of enzyme inactivation (k
inact
)
were obtained from the slopes of log(A–A
¥⁄
A
o
–A
¥
) vs. time
plots where A
o
is the initial enzyme activity, A is the activity
after heating for time t, and A
¥
the background activity at
infinite time. Activation energies for heat inactivation were
calculated from the slopes of Arrhenius plots. Heat-induced
unfolding of SPC4 was studied by monitoring the intrinsic
tryptophan fluorescence of the enzyme (2.2 lm)in10mm
sodium acetate pH 5.0 in the absence or presence of 5 mm
CaCl
2
. The temperature of the continuously stirred protein
solution, as measured with a digital sonde with a reading
precision of ± 0.01 °C, was increased from 25 °Cto95°C
at a speed of 0.5 °C per min [37]. The fluorescence emission
at 342 nm was measured at 0.5 min interval with excitation
at 295 nm. To determine the temperature at midpoint trans-
ition (T
m
), also referred to as melting temperature, the chan-
ges in fluorescence emission were analyzed according to a
two-state mechanism of unfolding (Eqn 1) [36].
where Y
obs
is the measured fluorescence, R is the gas
constant, and a and b are the intercept and slope of the pre-
and postunfolding baselines, respectively. DH is the enthalpy
change for unfolding measured at T
m
, T
m
the melting tem-
perature and T the absolute temperature. The standard
errors in T
m
values were £ 0.2 K. Data were fitted by nonline-
ar, least-squares analysis using the general curve fit option of
the Profit program (Quantum Soft, Zurich, Switzerland).
Enzyme activity
Peroxidase activity was measured spectrophotometrically by
monitoring the H
2
O
2
-dependent oxidation of ABTS, at
25 °C [13]. The working solution of H
2
O
2
was daily prepared
Y
obs
¼ða
U
þ b
U
TÞþ
ðða
N
þ b
N
TÞÀða
U
þ b
U
TÞÞ
ð1 þ expðððÀDH
m
=RÞð1=T À 1=T
m
ÞÞ þ ððDC
p
=RÞðððT
m
=TÞÀ1ÞþlnðT=T
m
ÞÞÞÞÞ
ð1Þ
Characterization of sorghum peroxidase M. H. Dicko et al.
2304 FEBS Journal 273 (2006) 2293–2307 ª 2006 The Authors Journal compilation ª 2006 FEBS
at its concentration calculated from e
240
of 43.6 m
)1
Æcm
)1
[29]. Incubations were performed in 50 mm sodium acetate
pH 4.0. The pH optimum of peroxidase activity was deter-
mined with ABTS, ferulic acid and N-acetyl-l-tyrosine as
substrates. Activity measurements were performed in 50 mm
McIlvaine buffers at pH values between 2.5 and 8.0, using
the standard assay. The effect of pH on enzyme stability was
determined by preincubating the enzyme in various pH buff-
ers [46] and determining the residual activity with the stand-
ard assay. The effect of Ca
2+
ions on peroxidase activity was
analyzed by measuring peroxidase activity in the presence of
varying (0–10 mm) concentrations of CaCl
2
. Prior to the
assay, the enzyme was desalted using a Y10 centricon (Am-
icon, Corporation, Danvers, MA, USA) and preincubated
with known concentrations of CaCl
2
for 10 min, at 25 °C.
The reaction was then started by adding H
2
O
2
. The final con-
centration of the enzyme in the reaction medium was 10 nm.
Substrate specificity
Steady-state kinetics of SPC4 were performed by measuring
the initial rate of enzyme activity in 50 mm sodium acetate
pH 5.5, containing 1 mm CaCl
2,
in the presence of 2.5 mm
H
2
O
2
and varying concentrations of hydrogen donor, at
25 °C. The final enzyme concentration was 10 nm and the
reaction was started by the addition of H
2
O
2
. Spectral
changes were recorded using a Hewlett-Packard 8453 A
diode array spectrophotometer. Blanks where the enzyme
was replaced with buffer were prepared for each incubation
to correct for autooxidation, and all substrates were freshly
made. Initial rates were determined as the slope of initial
change in absorbance of substrate disappearance or product
formation. Unless otherwise indicated, stock solutions of
hydrogen donors were prepared in 10% ethanol at concen-
trations ranging from 1 to 25 mm. The concentration of
ethanol in the assay mixture never exceeded 0.25% (v ⁄ v).
Molar absorption coefficients of hydrogen donors at their
maximum wavelengths were determined in 50 mm sodium
acetate pH 5.5 (Table 4). The molar absorption coefficients
of oxidation products were retrieved from literature
[18,29,34,51,52]. The following substrates were used: ABTS,
ferulic acid, p-coumaric acid, N-acetyl tyrosine, N-acetyl
tyrosine methyl ester, tyrosine, catechol, and the tripeptide
Gly-Tyr-Gly. For each substrate concentration, the enzy-
matic reaction rate was determined in duplicate. For the
determination of indole-3-acetic acid (IAA) oxidase activity,
IAA was used as substrate without addition of H
2
O
2,
in
50 mm sodium acetate pH 5.5. Steady state kinetics were
performed as indicated above. Blank reactions without
enzyme served to correct for IAA autooxidation.
Acknowledgements
The organization for the prohibition of chemical weap-
ons (OPCW) via the International Foundation for
Science (Sweden), and the Stichting voor Sociale en
Culturele Solidariteit, Zeist, the Netherlands are
acknowledged for supporting the research carried out
by Dr M. H. Dicko. The authors wish to thank
Dr Henk Schols for useful advice with HPAEC analysis.
References
1 Dunford HB (1999) Heme Peroxidases. John Wiley and
Sons, Inc., Chichester.
2 Duroux L & Welinder KG (2003) The peroxidase gene
family in plants: a phylogenetic overview. J Mol Evol
57, 397–340.
3 Passardi F, Longet D, Penel C & Dunand C (2004) The
class III peroxidase multigenic family in rice and its evo-
lution in land plants. Phytochemistry 65, 1879–1893.
4 Christensen JH, Bauw G, Welinder KG, Montagu MV
& Boerjan W (1998) Purification and characterization of
peroxidases correlated with lignification in poplar
xylem. Plant Physiol 118, 125–135.
5 Boerjan W, Ralph J & Baucher M (2003) Lignin bio-
synthesis. Ann Rev Plant Biol 54, 519–546.
6 Johansson SK, Rasmussen JE, Harthill JE &
Welinder KG (1992) cDNA, amino acid and carbohy-
drate sequence of barley seed-specific peroxidase BP1.
Plant Mol Biol 18, 1151–1161.
7 Henriksen A, Welinder KG & Gajhede M (1998) Struc-
ture of barley grain peroxidase refined at 1.9-A
˚
resolu-
tion: a plant peroxidase reversibly inactivated at neutral
pH. J Biol Chem 273, 2241–2248.
8 van Huystee RB, Roi MG, Shnyrov VL & Sakharov IY
(2004) Peroxidase stability related to its calcium and
glycans. Phytochem Rev 3, 19–28.
9 Hertig C, Rebmann G, Bull J, Mauch F & Dudler R
(1991) Sequence and tissue-specific expression of a puta-
tive peroxidase gene from wheat (Triticum aestivum L.).
Plant Mol Biol 16, 171–174.
10 Chittoor JM, Leach JE & White FF (1997) Differential
induction of a peroxidase gene family during infection
of rice by during infection of rice by Xanthomonas
oryzae pv. oryzae. Mol Plant Microbe Interact 10,
861–871.
11 Teichmann T, Guan C, Kristoffersen P, Muster G,
Tietz O & Palme K (1997) Cloning and biochemical
characterization of an anionic peroxidase from Zea
mays. Eur J Biochem 247, 826–832.
12 Sae SW, Kadoum AM & Cunningham BA (1971) Puri-
fication and some properties of sorghum grain esterase
and peroxidase. Phytochemistry 10, 1–10.
13 Dicko MH, Hilhorst R, Gruppen H, Traore
´
AS, Laane C,
van Berkel WJH & Voragen AGJ (2002) Comparison of
content in phenolic compounds, polyphenol oxidases and
peroxidases in fifty sorghum varieties from Burkina Faso.
J Agric Food Chem 50, 3780–3788.
M. H. Dicko et al. Characterization of sorghum peroxidase
FEBS Journal 273 (2006) 2293–2307 ª 2006 The Authors Journal compilation ª 2006 FEBS 2305
14 Dicko MH, Gruppen H, Traore
´
AS, Zouzouho OC,
van Berkel WJH & Voragen AGJ (2006) Effects of ger-
mination on the activities of amylases and phenolic
enzymes in sorghum varieties. J Sci Food Agric 86,
953–963.
15 Converso DA & Ferna
´
ndez ME (1996) Ca
2+
activation
of wheat peroxidase: a possible physiological mechanism
of control. Arch Biochem Biophys 333, 59–65.
16 Wallace G & Fry SC (1999) Action of diverse peroxi-
dases and laccases on six cell wall-related phenolic com-
pounds. Phytochemistry 52, 769–773.
17 Regalado C, Garcia-Almenda
´
rez BE & Duarte-
Va
´
zquez MA (2004) Biotechnological applications of
peroxidases. Phytochem Rev 3, 243–256.
18 Oudgenoeg G, Hilhorst R, Piersma SR, Boeriu CG,
Gruppen H, Hessing M, Voragen AGJ & Laane C
(2001) Peroxidase-mediated cross-linking of a tyrosine-
containing peptide with ferulic acid. J Agric Food Chem
49, 2503–2510.
19 Boeriu CG, Oudgenoeg G, Spekking WTJ, Berendsen
LBJM, Vancon L, Boumans H, Gruppen H, van Berkel
WJH, Laane C & Voragen AGJ (2004) Horseradish per-
oxidase-catalyzed cross-inking of feruloylated arabinox-
ylans with b -casein. J Agric Food Chem 52 , 6633–6639.
20 Edge ASB, Faltynek CR, Hof L, Reichert LE &
Weber P (1981) Deglycosylation of glycoproteins by
trifluoromethanesulfonic acid. Anal Biochem 118, 131–
137.
21 Tams JW & Welinder KG (1995) Mild chemical degly-
cosylation of horseradish peroxidase yield a fully active,
homogeneous enzyme. Anal Biochem 228, 48–55.
22 Green BN & Olivier RWA (1991) The study of intact
proteins and glycoproteins by electrospray mass spectro-
metry. Biochem Soc Trans 19, 929–934.
23 Rasmussen CB, Hiner ANP, Smith AT & Welinder KG
(1998) Effect of calcium, other ions, and pH on reac-
tions of barley peroxidase with hydrogen peroxidase
and fluoride: control of activity through conformational
change. J Biol Chem 273, 2232–2240.
24 Melo NS, Larsen E, Welinder KG & Fevereiro PS
(1997) Characterization of two major cationic peroxi-
dases from cell suspension cultures of Vaccinium myrtil-
lus. Plant Sci 122, 1–10.
25 Welinder KG (1976) Covalent structure of the glycopro-
tein horseradish peroxidase [EC 1.11.1.7]. FEBS Lett 72,
19–23.
26 Veitch NC (2004) Structural determinants of plant per-
oxidase function. Phytochem Rev 3, 3–18.
27 Paterson AH, Bowers JE, Peterson DG, Estill JC &
Chapman B (2003) Structure evolution of cereal gen-
omes. Curr Opin General Dev 13, 644–650.
28 Bestwick CS, Brown IR & Mansfield JW (1998) Loca-
lized changes in peroxidase activity accompany hydro-
gen peroxide generation during the development of a
nonhost hypersensitive reaction in lettuce. Plant Physiol
118, 1067–1078.
29 Nielsen KL, Indiani C, Henriksen A, Feis A, Becucci
M, Gajhede M, Smulevich G & Welinder KG (2001)
Differential activity and structure of highly similar per-
oxidases. Spectroscopic, crystallographic, and enzymatic
analyses of lignifying Arabidopsis thaliana peroxidase
A2 and horseradish peroxidase A2. Biochemistry 40,
11013–11021.
30 Stafford HA & Brown MA (1976) Oxidative dimeriza-
tion of ferulic acid by extracts from Sorghum. Phyto-
chemistry 15, 465–469.
31 Glennie CW (1981) Preharvest changes in polyphenols,
peroxidase, and polyphenol oxidase in Sorghum grain.
J Agric Food Chem 29, 33–36.
32 Awika JM & Rooney LW (2004) Sorghum phytochem-
icals and their potential impact on human health. Phy-
tochemistry 65, 1199–1221.
33 Savitsky PA, Gazaryan IG, Tishkov VI, Lagrimini L,
Mark Ruzgas T & Gorton L (1999) Oxidation of
indole-3-acetic acid by dioxygen catalyzed by plant per-
oxidases: specificity for the enzyme structure. Biochem J
340, 579–583.
34 Marco A, Guzzardi P & Jamet E (1999) Isolation of
tobacco isoperoxidases accumulated in cell-suspension
medium and characterization of activities related to cell
wall metabolism. Plant Physiol 120, 371–381.
35 Mathesius U (2001) Flavonoids induced in cells under-
going nodule organogenesis in white clover are regula-
tors of auxin breakdown by peroxidase. J Exp Bot 52,
419–426.
36 van Mierlo CPM, van Dongen WMAM, Vergeldt F,
van Berkel WJH & Steensma E (1998) The equilibrium
unfolding of Azotobacter vinelandii apoflavodoxin II
occurs via a relatively stable folding intermediate. Prot
Sci 7, 2331–2344.
37 Rodrı
´
guez A, Pina DG, Ye
´
lamos B, Le
´
on JJC,
Zhadan GG, Villar E, Gavilanes F, Roij MG, Sakharov
IY & Shnyrov VL (2002) Thermal stability of peroxi-
dase from the African oil palm tree Elaeis guineensis.
Eur J Biochem 269, 2584–2590.
38 McEldoon JP & Dordick JS (1996) Unusual thermal
stability of soybean peroxidases. Biotechnol Prog 12,
555–558.
39 Dicko MH, Hilhorst R, Gruppen H, Laane C, van Ber-
kel WJH & Voragen AGJ (2002b) Zymography of the
monophenolase and o-diphenolase activities of polyphe-
nol oxidase. Anal Biochem 360, 336–339.
40 Pajot P (1976) Fluorescence of proteins in 6M guanidine
hydrochloride: a method for quantitative determination
of tryptophan. Eur J Biochem 63, 263–269.
41 Bjellqvist B, Hughes GJ, Pasquali C, Paquet N,
Ravier F, Sanchez JC, Frutiger S & Hochstrasser DF
(1993) The focusing positions of polypeptides in immo-
Characterization of sorghum peroxidase M. H. Dicko et al.
2306 FEBS Journal 273 (2006) 2293–2307 ª 2006 The Authors Journal compilation ª 2006 FEBS
bilized pH gradients can be predicted from their amino
acid sequences. Electrophoresis 14, 1023–1031.
42 Matsudaira P (1987) Sequence from picomole quantities
of proteins electroblotted onto polyvinylene difluoride
membranes. J Biol Chem 262, 10035–10038.
43 Altschul SF, Madden TL, Schaffer AA, Zhang J, Zhang
Z, Miller W & Lipman DJ (1997) Gapped BLAST and
PSI-BLAST: a new generation of protein database search
programs. Nucleic Acids Res 25, 3389–3402.
44 Thompson JD, Higgins DG & Gibson TJ (1994) CLUS-
TAL W. Improving the sensitivity of progressive multi-
ple sequence alignment through sequence weighting,
positions-specific gap penalties and weight matrix
choice. Nucleic Acids Res 22, 4673–4680.
45 van Hengel AJ, Tadesse Z, Immerzeel P, Schols H, van
Kammen A & de Vries SC (2001) N-acetylglucosamine
and glucosamine-containing arabinogalactan proteins
control somatic embryogenesis. Plant Physiol 125, 1880–
1890.
46 Dicko MH, Searle-van Leeuwen MJF, Hilhorst R,
Traore
´
AS & Beldman G (2001) Polysaccharide hydro-
lases from leaves of Boscia senegalensis: properties of
endo-(1?3)-b-d-glucanase. Appl Biochem Biotechnol 94,
225–241.
47 Schevchenko A, Wilm M, Vorm O & Mann M (1996)
Mass spectrometric sequencing of proteins from silver-
stained polyacrylamide gels. Anal Chem 68, 850–858.
48 Kristensen BK, Bloch H & Rasmussen SK (1999) Bar-
ley coleoptyl peroxidases: purification, molecular clon-
ing, and induction by pathogens. Plant Physiol 120,
501–512.
49 Leskovac V (2003) Comprehensive Enzyme Kinetics (Les-
kovac, V, eds). Kluwer Academic ⁄ Plenum Publishers,
New York.
50 Venyaminor SY, Baikalov IA, Wu CSC, Shen ZM &
Yang YT (1993) Circular dichroism analysis of dena-
tured proteins: inclusion of denatured proteins in the
reference set. Anal Biochem 214 , 17–24.
51 Michon T, Chenu M, Kellershon N, Desmadril M &
Gueguen J (1997) Horseradish peroxidase oxidation of
tyrosine-containing peptides and their subsequent poly-
merization: a kinetic study. Biochemistry 36, 8504–8513.
52 Liu W, Fang J, Zhu WM & Gao PJ (1999) Isolation, pur-
ification and properties of the peroxidase from the hull of
Glycine max var HH2. J Sci Food Agric 79, 779–785.
53 Ross AH (1994) Investigation of peroxidase genes and
genetic transformation in buffel grass. PhD Thesis, Uni-
versity of Queensland, Queensland, Australia.
54 Buffard D, Breda C, van Huystee RB, Asemota O,
Pierre M, Ha DB & Esnault R (1990) Molecular cloning
of complementary DNAs encoding two cationic peroxi-
dases from cultivated peanut cells. Proc Natl Acad Sci
USA 87, 8874–8878.
55 Morimoto S, Tateishi N, Inuyama M, Taura F,
Tanaka H & Shoyama Y (1999) Identification and
molecular characterization of novel peroxidase with
structural protein-like properties. J Biol Chem 274,
26192–26198.
56 Mazza G & Welinder KG (1980) Covalent structure of
turnip peroxidase 7. Cyanogen bromide fragments, com-
plete structure and comparison to horseradish peroxi-
dase C. Eur J Biochem 108, 481–489.
M. H. Dicko et al. Characterization of sorghum peroxidase
FEBS Journal 273 (2006) 2293–2307 ª 2006 The Authors Journal compilation ª 2006 FEBS 2307