- Trang chủ >>
- Khoa Học Tự Nhiên >>
- Vật lý
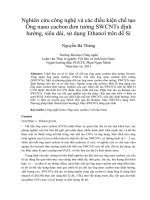
High frequency FTIR absorption of sio2 si nanowires
Bạn đang xem bản rút gọn của tài liệu. Xem và tải ngay bản đầy đủ của tài liệu tại đây (426.68 KB, 6 trang )
High-frequency FTIR absorption of SiO
2
/Si nanowires
Quanli Hu
*
, Hiroshi Suzuki, Hong Gao, Hiroshi Araki, Wen Yang, Tetsuji Noda
National Institute for Materials Science, 1-2-1 Sengen, Tsukuba, Ibaraki 305-0047, Japan
Received 3 June 2003; in final form 29 July 2003
Published online: 26 August 2003
Abstract
An IR absorption measurement of SiO
2
/Si nanowires made by thermal evaporation was conducted. In comparison
with SiO
2
nanoparticles, enhancement absorption of SiO
2
/Si nanowires around 1130 cm
À1
was observed. This en-
hancement was considered to result from: (1) the interface effect of the open structure of chainlike SiO
2
/Si nanowires;
(2) the vibration of an interstitial oxygen atom in a silicon single-crystalline core of nanowire; and. The longitudinal
optical (LO) modes of Si–O–Si stretching in an amorphous SiO
2
outer shell of SiO
2
/Si nanowires were also discussed.
Ó 2003 Elsevier B.V. All rights reserved.
1. Introduction
IR absorption spectroscopy is useful for un-
derstanding the structural and compositional
properties of many kinds of oxides. The IR ab-
sorption characteristic of amorphous SiO
2
has also
been studied for many years [1]. Three major ab-
sorption bands centered at 460, 810, and 1070
cm
À1
have been confirmed by many researchers [2].
These three absorption peaks reflect the rocking of
an oxygen atom about an axis through the two
silicon, the symmetrical stretching of an oxygen
atom along a line bisecting the axis through the
two silicon atoms and asymmetrical stretching of
an oxygen atom along a line parallel to the axis
through the two silicon atoms, respectivel y. In
addition, an increase in the structural disorder
could enhance the relative intensity of the ab-
sorption band at a higher-frequency side [3].
Among these absorption bands, the intensity of
1070 cm
À1
is much stronger than the features at its
high-frequency side even when the structural dis-
order of amorphous SiO
2
has been increased by
different ways [4].
On the other hand, silicon nanowires have been
grown using the VLS mechanism [5,6], STM [7],
and laser ablation or thermal evaporation [8–10].
Lee et al. reported that the thermal evaporation
method is useful for the large-scale synthesis of Si
nanowires, which can be explained by a new oxide-
assisted mechanism that involves the use of an
oxide to promote nanowire growth. Moreover, the
double-layer structure of silicon nanowires is ob-
served. The TEM images of these nanowires
indicate that each nanowire consists of an inner
single-crystalline core and an outer layer of SiO
2
Chemical Physics Letters 378 (2003) 299–304
www.elsevier.com/locate/cplett
*
Corresponding author. Fax: +81298592701.
E-mail address: (Q. Hu).
0009-2614/$ - see front matter Ó 2003 Elsevier B.V. All rights reserved.
doi:10.1016/j.cplett.2003.07.015
(or SiO) amorphous layer. The nanostructural
effect on the IR absorption properties may be
investigated by studying the vibration modes of
Si–O on the surface of the chain-like amorphous
SiO
2
of silicon nanowires and in the interface be-
tween silicon crystal and amorphous SiO
2
. How-
ever, the detailed structural features of the surface
of silicon nanowires with an amorphous SiO
2
outer layer have not been clearly investigated be-
cause the fabrication of silicon nanowires with
different nanostructures is very difficult.
The objectives of this work, after getting a
mount of nanowires by thermal physical evapo-
ration, are to study the IR absorption character-
istics of SiO
2
/Si nanowires and the nanostructural
effect on IR absorption characteristics at a higher
frequency.
2. Experimental
Si powder (99.99 wt% purity, 300 mesh) was
used as raw material for the growth of silicon
nanowires. After being ground in a mortar, the Si
powder was pre-sintered at 1150 °C for 2 h in a
vacuum of 10
À5
Pa. The growth of silicon nano-
wires was conducted by a modified thermal evap-
oration process in a three-st age horizontal furnace
with three independent heating controllers. Semi-
cut quartz tubes containing Si wafers were placed
along the downstream region in an alumina tube
to act as the substrate for the grown SiNWs
products. Pre-sintered silicon powder was placed
in a Al
2
O
3
crucible and evaporated under 1350 °C
for 2–3 h. The pressure in the alumina tube was
maintained at normal values by flowing Ar gas at a
rate of 20 sccm. The temperature distribution
along the alumina tube in the furnace was con-
trolled by temperature-setting values at three
points.
Silicon nanowire products on a silicon wafer
and a quartz tube were examined by field-emission
scanning electron microscopy (FE-SEM, JEOL-
6700F) and energy dispersion (EDS) attached to
FE-SEM. Transmission electron microscopy
(TEM, JEOL-2010) was utilized to characterize
the detailed microstruc ture features of silicon
nanowires. The IR transmission measurements
were conducted in a JEOL IR spectrometer model
JIR-7000 with a Fourier transform infrared spec-
trometer (FTIR). The sponge-like silicon nano-
wires were mixed with high-purity KBr to make
a measurement pellet. The spectral resolution in
the experiments was 0.5 cm
À1
in the range of
400–4000 cm
À1
.
3. Results and discussion
After the fabrication of silicon nanowires by the
thermal evaporation method, products with dif-
ferent sizes of nanowires and surface states could
be obtained in different temperature ranges because
the size of silicon nanowires can be controlled by
the variation of ambient temperature and pressure
[9]. Three products were selected from different
temperature ranges: (1) sample A: nanoparticles of
silicon oxides (SiO
2
) with 40–60 nm average parti-
cle size taken from the temperature region of
1000 K; (2) sample B: thick silicon nanowires (di-
ameter: 800–1000 nm; length: 100–400 lm) taken
from the temperature region of 1173 K; and (3)
sample C: thin silicon nanowires (diameter: 50–150
nm; length: 40–100 lm) taken from the tempera-
ture region of 1373 K. Fig. 1 shows FE-SEM im-
ages of the three samples described above with
different nanostructures. In addition, the SAED
(selected-area electron diffraction) analysis indi-
cated that sample A is almos t amorphous SiO
2
;on
the other hand, the single nanowire in samples B
and C has a double-layer structure, which has a
crystalline silicon core and an amorphous SiO
2
outer shell (20–100 nm thickness).
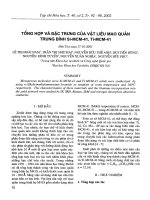
In Fig. 2, the absorption spectra of sample A
taken from the temperature region of 1000 K are
presented. Here, only the position of the absorp-
tion peak is investigated. It shows the well-known
transversal optica l (TO) resonances, the Si–O–Si
rocking vibrational mode (468 cm
À1
), the O–Si–O
bending mode (808 cm
À1
), and the Si–O asym-
metric stretchi ng mode (1082 cm
À1
). Furthermore,
the strongest absorption peak locates at the high-
er-frequency side around 1082 cm
À1
. The absorp-
tion spectra of samples B and C taken from the
temperature regions of 1173 and 1300 K are also
shown in Fig. 2. Compared with that of sample A,
300 Q. Hu et al. / Chemical Physics Letters 378 (2003) 299–304
the absorption bands of samples B and C centered
at 1000–1300 cm
À1
showed some interesting vari-
ations. Namely, the strongest absorption peak lo-
cates at 1130 cm
À1
, a phenomenon that has never
been observed before from either bulk or film
samples, and there is a shoulder of absorption
spectra at the higher-frequency side around 1170–
1200 cm
À1
. In order to understand clearly the in-
fluence of Si–O bond stretching on the shape and
intensity of the spectra of samples B and C at a
higher frequency, a detailed analysis of IR spectra
in the range of 1000–1300 cm
À1
is given in Fig. 3.
This analysis shows that IR absorption spectra in
the range of 1000–1300 cm
À1
can be deconvoluted
in four absorption bands with a symmetrical
Gaussian shape centered at about 1070, 1130,
1160, and 1200 cm
À1
. The relative ratio among the
areas of the four absorption bands above, which
reflect the relative distribution for each stretching
mode, is shown in Table 1. Table 1 indicates that
the TO asymmetric stretching modes of the Si–O
bond dominate in the range of 1000–1300 cm
À1
of
sample A. Two other weak modes, longitudinal
optical (LO) asymmetric stretching modes at 1160
cm
À1
and asymmetric stretching (TO) modes at
1200 cm
À1
, also contribute to the absorption
spectra around 1000–1300 cm
À1
.
If we only consider the effect of nanoscale size,
we should find similar enhancement on higher
frequency absorption of IR spectrum in nanopar-
ticle and nanowire. Because either nanoparticles or
nanowires have a strong surface tension to cause
the distortion and the shortening of Si–O bond
length. And this will produce more intensity at
higher frequency. However if we further consider
the structural characteristics of nanoparticles and
nanowires, the differences on IR spectrum are very
obvious. First of all, the difference comes from
effect of crystalline field of silicon single crystal
core. In SiO
2
/Si nanowires, the crystalline field of
silicon core could bring some influence on the Si–O
vibration of outer SiO
2
layer or interface. This
kind of influence may increase the energy gap be-
tween excited state and ground state for Si–O vi-
bration absorption to cause the increasing of
higher frequency absorption in nanowires. Oppo-
sitely, the crystalline field effect does not exist in
nanoparticles of SiO
2
because it has no silicon
single crystal core. Second, the difference comes
from the interface structure of the SiO
2
/Si nano -
wires. In SiO
2
/Si nanowires, the interface between
silicon core and SiO
2
outer shell has a large ratio in
the structure of nanowires body. And there are a
lot of point defects such as vacancy and broken
bonds of Si–O on these interfaces. Therefore, these
could also bring the strong absorption intensity at
higher frequency.
Fig. 1. The FE-SEM images of samples A, B, and C.
Q. Hu et al. / Chemical Physics Letters 378 (2003) 299–304 301
In another aspect, themselves of SiO
2
/Si nano-
wires with micron-meter order length and nano-
meter-order diameter bring the disorder in some
extent in the measurement pellet. According to
Gaskell [11], the intensity of the absorption band
of amorphous SiO
2
at the high-energy side of the
main stretching mode can be enhanced in samples
with a large degree of structure disorder increased
by different means, for instance, by ion bom-
bardment. In the present work, the mixi ng of
nanoscale structures of SiO
2
/Si nanowires obvi-
ously results in a more open structure with free
volume and surface to produce disordered effect,
which cannot be achieved by the ordinary me-
chanical-grounding method. Thi s is one of reasons
for the enhanced intensity of the band around
1000–1300 cm
À1
.
Furthermore, the absorption band centered at
1130 cm
À1
indicates that the existence of an ox-
ygen atom dissolved in silicon nanowires cannot
be ignored. It is known that the SiO
2
outer shell
reacts with molten silicon, especially on the in-
terface between SiO
2
outer layer and silicon core
during the formation of silicon nanowires [12].
The oxygen in turn may dissolve in silicon single
crystalline core to a certain extent. Some of them
may form interstitial oxygen atoms. The intersti-
tial oxygen atoms are assumed to be bound to
two neighboring silicon atoms in regular lattice
sites [13]. This means that two neighboring silicon
atoms give up their covalent bond and engage
with an interstitial oxygen atom instead, forming
an isosceles triangle with Si–O–S i at the corners.
In Fig. 4, the interface between amorphous SiO
2
and single crystalline silicon can be clearly ob-
served. And the point defects and broken bonds
to be found on the interface also provide an
evidence for above discussion.
Moreover, in samples B and C, the enhance-
ment of the absorption band at 1160 cm
À1
,to
which the LO modes of Si–O–Si stretching con-
tribute, is observed. Usually, in an infinite bulk
sample of amorphous SiO
2
, the LO modes can
Fig. 2. The IR absorption spectra around 400–2000 cm
À1
for the samples A, B, and C.
Table 1
Relative distribution for each stretching mode from the fitting
analysis
1070 1130 1160 1200
(cm
À1
) (cm
À1
) (cm
À1
) (cm
À1
)
Sample A 0.91 0 0.04 0.05
Sample B 0.48 0.1 0.21 0.21
Sample C 0.52 0.06 0.08 0.34
302 Q. Hu et al. / Chemical Physics Letters 378 (2003) 299–304
only be observed by using polarized light with
some angles of incidence because the electro-
magnetic wave such as infrared wave cannot in-
teract with longitudinal phonons. For example,
Berreman carried out experiments in oblique in-
cidence with p-polarized light (with the electric
field vector parallel to the plane of incidence) [14].
But the excitation of longitudinal optical reso-
nances is possible if the film is sufficiently thin
compared to the incoming wavelength. In the
present work, the absorption band at 1160 cm
À1
was attributed to the fact that the thickness of
amorphous SiO
2
(20–100 nm) was much smaller
than the wavelength of the infrared optical reso-
nances (2500–25 000 nm). In addition, the inter-
face and boundary in SiO
2
/Si nanowires have
very high ratio to produce many chance that may
cause considerable absorption of LO modes, too.
These also cause the strong signals in the region
of the LO vibration modes.
Finally, in sample A, most of the nanoparticles
have no silicon single-crystalline core or chainlike
structure; the influence from the interstitial oxygen
vibration mode is either weak or zero. Therefore,
the strongest absorption peak locates at 1082
cm
À1
, which only comes from the influence of the
TO resonances of the Si–O–Si asymmetric
stretching modes. The shoulder of the absorption
band around the 1170 cm
À1
results from the co-
existence of the LO and the TO resonances of
Si–O–Si asymmetric stretching modes.
Further work is underway to investigate the
thickness variation of the amorphous SiO
2
outer-
Fig. 4. The HRTEM image of one part of sample C.
Fig. 3. The deconvolution in four absorption bands with
symmetrical Gaussian shape centered at about 1070, 1130,
1160, and 1200 cm
À1
for samples A, B, and C.
Q. Hu et al. / Chemical Physics Letters 378 (2003) 299–304 303
shell dependence of IR absorption intensity and
position.
4. Conclusion
Enhancement of the relative intensity of IR
absorption spectra around 1000–1300 cm
À1
from
an open structure with a free volume of SiO
2
/Si
nanowires was observed. The interface effect and
interstitial oxygen from SiO
2
/Si nanostructural
characteristics were suggested to result in the en-
hancement of above vibration modes. In addition,
the stronger LO resonances at 1160 cm
À1
was
found, which depend on the nanoscale size effect of
SiO
2
outer layer in SiO
2
/Si nanowires.
Acknowledgements
This study was financially supported, partially,
by the Budget for Nuclear Research of the Min-
istry of Education, Culture, Sports, Science, and
Technology, with screening and counseling by the
Atomic Energy Commission of Japan.
References
[1] T. Furukawa, W.B. White, J. Non-Cryst. Solids 38–39
(1980) 87.
[2] C.T. Kirk, Phys. Rev. B 38 (1998) 1255.
[3] J.R. Martinez, F. Ruiz, Y.V. Vorobiev, F. Perez-Robles,
J. Gonzalez-Hernandez, J. Chem. Phys. 109 (1998)
7511.
[4] C.J. Brinker, G.W. Scherer, J. Non-Cryst. Solids 70 (1965)
301.
[5] A.I. Klimovskaya, I.P. Ostrovaki, A.S. Ostrovskaya, Phys.
Status Solidi(a) 153 (1996) 465.
[6] J. Westwater, D.P. Gosain, S. Tomiya, S. Usui, J. Vac. Sci.
Technol. B 15 (1997) 554.
[7] T. Ono, H. Saitoh, M. Esashi, Appl. Phys. Lett. 70 (1997)
1852.
[8] Y.F. Zhang, Y.H. Tang, N. Wang, C.S. Lee, S.T. Lee,
Appl. Phys. Lett. 72 (1998) 1835.
[9] S.T. Lee, Y.F. Zhang, N. Wang, Y.H. Tang, I. Bello, C.S.
Lee, Y.W. Chung, J. Mater. Res. 14 (1999) 4503.
[10] Z.W. Pan, Z.R. Dai, L. Xu, S.T. Lee, Z.L. Wang, J. Phys.
Chem. B 105 (2001) 2507.
[11] P.H. Gaskell, D.W. Johnson, J. Non-Cryst. Solids 20
(1976) 171.
[12] H.Y. Peng, N. Wang, W.S. Shi, Y.F. Zhang, C.S. Lee, S.T.
Lee, J. Appl. Phys. 89 (2001) 727.
[13] W. Kaiser, P.H. Keck, C.F. Lange, Phys. Rev. 101 (1956)
1264.
[14] D.W. Berreman, Phys. Rev. 130 (1963) 2193.
304 Q. Hu et al. / Chemical Physics Letters 378 (2003) 299–304